
Abstract
Purpose:
The purpose of this study is to examine the behaviour of trading volumes in commodity futures markets over the life of the contract and to analyse the relationship between changes in price, volume and open interest.
Methodology:
The volume progression is examined by dividing the life of a futures contract to six phases and analysing how the volumes picked up during each phase. The relationship between price, volume and open interest was examined using the Pearson correlation and the vector autoregression (VAR) model.
Findings:
It is found that the volumes in commodity futures are clustered around the last phase of the contract’s life. As far as the relationship between price, volume and open interest is concerned, there is a very low correlation between the variables. Price is not influenced by volume or open interest. The volume changes are found to be influenced by open interest, and the open interest is influenced by its own past values.
Practical Implications:
The findings of the study have implications for traders in the commodity futures market as well as policymakers as it throws light on the crucial issue of lack of volumes in the futures market.
Contribution/Originality:
The study contributes to the literature in terms of analysis of volume progression, which is not researched extensively in the Indian market. The findings of the study, which contradict the findings of other similar studies, open up scope for further research.
Introduction
After decades of regulatory interventions and slow growth, the commodity derivatives market in India became active in 2002, when the government permitted the setting up of national-level online exchanges. Since then, the market has witnessed high growth, occasionally hampered by events such as the introduction of Commodity Transaction Tax and the recent COVID-19 pandemic. Futures contracts contribute to the major share of trade in the Indian commodity markets. Trading in options was permitted recently, and the market has not grown significantly. Multi Commodity Exchange of India (MCX) holds the largest share of trade in India.
The primary functions of a derivatives market are price discovery and risk transfer. Futures contracts are used by various stakeholders for hedging the price risk. Speculators also play a significant role by adding liquidity to the market. However, in the absence of participation by hedgers, the market can turn into a playground for speculators, who can artificially manipulate the prices. Hence, all exchanges all over the world try to attract hedgers to the market by promoting their products and creating awareness of the benefits of derivatives trading.
The relationship between price and volume is an important indicator of the efficiency of the market. Many researchers have found positive correlations between the prices and volumes in financial assets. Though limited in number, similar studies are also available in the commodity market. Moosa and Silvapulle (2000), Ciner (2002) and Yu-Shan and Yi-Cheng (2016) studied price–volume relationships in various overseas commodity markets. Kumar (2009), Kumar and Pandey (2010) and Biswas and Rajib (2011) analysed the price–volume relationship in the Indian commodity markets. While most of these studies focused on the causal relationship between price and volume, an important aspect of how the volumes behave as the life of a futures contract progresses, has not been researched extensively. The progression of volumes during the life of a futures contract can throw light on the nature of traders in the market and their role in price discovery. In this background, the current study aims to examine the volume progression in the futures market for bullion and precious metals in India. The study is expected to describe the behaviour of trading volume during the life of a futures contract and examine the causal relationship between price, volumes and open interest.
Review of Literature
In his seminal paper, Samuelson (1965) argued that the volatility of futures contract prices increased as the contract reached closer to maturity. This is known as the Samuelson hypothesis in literature. Many researchers such as Duong and Kalev (2008), Gupta and Rajib (2012) and Brooks and Teterin (2020) tested the Samuelson hypothesis in different markets. Duong and Kalev (2008) examined 20 futures markets in agriculture commodities, metals, energy and financial futures. They found evidence to support the Samuelson hypothesis in agricultural markets but not in any other market. Gupta and Rajib (2012) analysed futures contracts of metals, bullion and energy traded at MCX. They did not find evidence to prove the Samuelson hypothesis in the Indian commodity markets. They concluded that the volume of trade and open interest had a stronger impact on volatility of prices than time to maturity. Brooks and Teterin (2020) examined the Samuelson hypothesis in 10 US commodity futures markets and found that the Samuelson effect was absent in many markets. While the Samuelson hypothesis dealt with the maturity of futures contract and the behaviour of volatility, the volume of trade is another important indicator of the efficiency of the market.
In one of the earliest studies related to volume of trade and price, Cornell (1981) tested the relationship between volume and price variability for futures contracts of 18 commodities that were actively traded in commodity markets in the United States. A significant positive contemporaneous correlation was found in the case of 14 out of 18 commodities studied. Conversely, the correlations between changes in price variability and lead or lagged changes in volume were found to be insignificant. Moosa and Silvapulle (2000) studied the causal relationship between volume and price in crude oil market futures contracts traded in the New York Mercantile Exchange. They analysed both linear and non-linear causality between volumes and price. They concluded that linear causality flew from volume to price for all the contracts considered. In the case of non-linear causality, bidirectional causality was observed in most of the sample contracts. Ciner (2002) tested the relationship between volume and price changes for the Tokyo commodity futures market. The study focused on the information content of volume for the magnitude and direction of price changes. He could not detect predictive power for lagged volume, although there was causality running from returns to volume. However, he observed that non-linear Granger causality tests supported bidirectional causality between volume and returns. Chen et al. (2004) studied price–volume relationship in China’s commodity futures markets based on four agricultural commodities. Using the Granger causality test to investigate contemporaneous and lead–lag relationships, they found no contemporaneous correlation between return and trading volume. However, there was significant causality following from absolute returns to trading volume and vice versa. Hadsell (2006) applied the TARCH model to establish a relation between returns, volatility and volume in the electricity futures market. Four electricity futures contracts on NYMEX were examined. The results indicated persistence in volatility of the contracts and asymmetry of trader responses to new information. Trading volume and futures price volatility were found to be correlated. Al-Deehani (2007) studied the asymmetry in price–volume relationship of nine international stock markets and found that higher volumes were associated with an increase in prices.
Kumar (2009) studied the relationship between futures trading activity and the volatility in spot market for various commodities in India. The purpose of this study was to examine if the trading activity in the futures market has an impact on the spot market volatility. A positive correlation was observed between the volume of futures trading and spot market volatility. But the relationship between open interest and spot market volatility was found to be insignificant. Kumar and Pandey (2010) examined the relationship between volatility, volume of trade and open interest for agricultural, metal, precious metal and energy commodities traded in India. They found a significant and positive correlation between trading volume and volatility for all commodities examined. The relationship between open interest and volatility was found to be insignificant. However, they also found that the volatility is more clearly explained by its own lagged values than the volume of trade. Kayali (2010) tested the causality between price and volumes in the futures market of the stock index in Turkey. It was concluded that causality runs from trading volume to returns and not in the opposite direction. Biswas and Rajib (2011) tested price–volume relationships for Indian commodity futures contracts using three commodities, gold, silver and crude. They developed a methodology for testing linear Granger causality between return and volume, absolute return and volume, open interest and absolute return to examine whether changes in one series caused changes in another. They observed bidirectional causality between absolute return and volume change for gold and silver and unidirectional causality from volume to absolute return for crude. Algieri (2012) examined the relationship between price volatility and speculation in commodity markets. He concluded that it is not speculation that results in higher volatility in the commodity prices, but excessive speculation, which makes the markets skewed and pushes the volatility. Boonvorachote and Lakmas (2016) examined the price volatility, trading volume and market depth in Asian commodity markets. A sample was collected from four Asian countries: China, Thailand, Singapore and Japan. They found a positive relationship between volumes and volatility and a negative relationship between open interest and volatility. They concluded that speculative activities enhanced volatility in the market, whereas hedging activity, captured by open interest, stabilised the market. Yu-Shan and Yi-Cheng (2016) analysed the price–volume relationship in the futures market for crude oil. They concluded that when the price of crude oil went up, the trading volumes increased and a decline in the futures prices resulted in the shrinkage of volumes. Alhussayen (2022) tested the causality between trading volume and returns of the stock market in Saudi Arabia and concluded that volume does not cause returns, whereas there is causality flowing from previous period rates of returns to trading volume. Dimitrios and Tseriki (2022) studied the trading volume and price of five agricultural commodities and observed bidirectional predictability between volume and price movements. They also concluded that low values of returns have higher predictive power as far as volumes are concerned. Hoàng-Long et al. (2022) examined the role of time-varying asymmetric information on the volatility of commodity futures returns. They used the data related to 12 commodity futures contracts traded on CME. They concluded that speculative activity is responsible for increased volatility in the futures price as the contract approaches maturity. Sunay (2022) found strong price volume relationship in the US market. But no such relationship was observed in other markets.
Research Gap
A brief review of the literature reveals that though the relationship between trading volume and price (volatility) has been researched extensively, not many studies are available on commodity markets in India. Most of the available literature is based on data related to near-month futures contracts over a continuous time period. It mostly examines the causal relationship between volumes and price using long-term continuous data. However, studies based on the price and volume relationship during the life of a single contract are not available. Similarly, no study is available on how the volumes behave over the life of a futures contract in the Indian context. Hence, this study attempts to examine the progression of volumes or patterns of volume change over the life of a contract in the Indian market. It also attempts to analyse the causal relationship between volume, price and open interest for the selected commodities.
Research Methodology
Objectives
To examine the progression of volume during the life of futures contracts.
To analyse the relationship between price, volumes and open interest of futures contracts.
Data Description
The study is based on the commodity futures contracts traded in the MCX. The study considers commodities included in two categories: bullion and base metals. Based on the volume of trade, two commodities (gold and silver) are considered in bullion, and two commodities (copper and zinc) are considered from base metals. Twenty-five futures contracts traded between 2019 and 2023 are randomly selected for the study by choosing five contracts from each year. Data pertaining to daily closing price of futures contracts, volume of trade and open interest are collected for the entire life of the contract, that is, from contract launch to maturity. All data are collected from the website of MCX.
Scheme of Analysis
The analysis was carried out in two phases. The first phase was aimed at examining the pattern and progression of volumes during the life of futures contracts. For this purpose, the life of a contract was divided into six phases as given below:
Early months: the period from the launch date to four months prior to expiry. Four months: the month representing four months prior to expiry. Three months: the month representing three months prior to expiry. Two months: the month representing two months prior to expiry. Last month: the last month of the life of the contract, excluding the tender period. Tender period: the last five days in the life of a contract. (Tender period represents the time before which those traders who are not interested in physical delivery are required to exit the contract by squaring their positions.)
For example, the February 2019 futures contract on gold was launched on 16 February 2018, and the expiry was 5 February 2019. In this case, data from 16 February 2018 to 30 September 2019 were considered as early months; October 2018 as four months; November 2018 as three months; December 2018 as two months; January 2019 as the last month; and the last five days of the contract (in February 2019) as tender period. The same methodology has been adopted in classifying the life of all contracts. Daily volumes of trade are cumulated for each of the above time periods. The percentage of volume during each period as against the total volume traded during the entire life of the contract is examined to understand how the volumes behaved during the life of the contract.
The second phase of analysis involved examining the relationship between price, volume and open interest. Since most of the contracts did not have any volume during the initial phase of the contract, the price, volume and open interest data pertaining to the active phase of the contract, mostly the last three months of the contract, have been considered for analysing the relationship between the variables. The data pertaining to all the 25 contracts considered for the study are cumulated for the analysis. The daily changes in price (Δ Price), volume (Δ Volume) and open interest (Δ Open Interest) have been computed for the data set. Initially, the relationship between the variables is examined using Pearson correlation. Further, the differenced data series were tested for stationarity using augmented Dickey–Fuller test. The short-run dynamics between price, volume and open interest were studied using the vector autoregression (VAR) model. Three VAR models were estimated as specified in Equations (1) to (3).
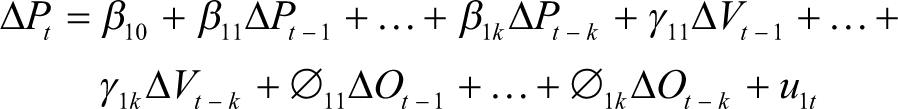

In Equations (1) to (3), ΔP represents changes in daily price, ΔV represents changes in volume, and ΔO represents changes in open interest. The time is indicated by ‘t’, ‘k’ represents the number of lags used in the VAR model, and ‘u’ is the residual term.
Data Analysis
Pattern of Volume
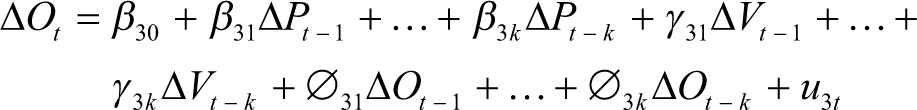
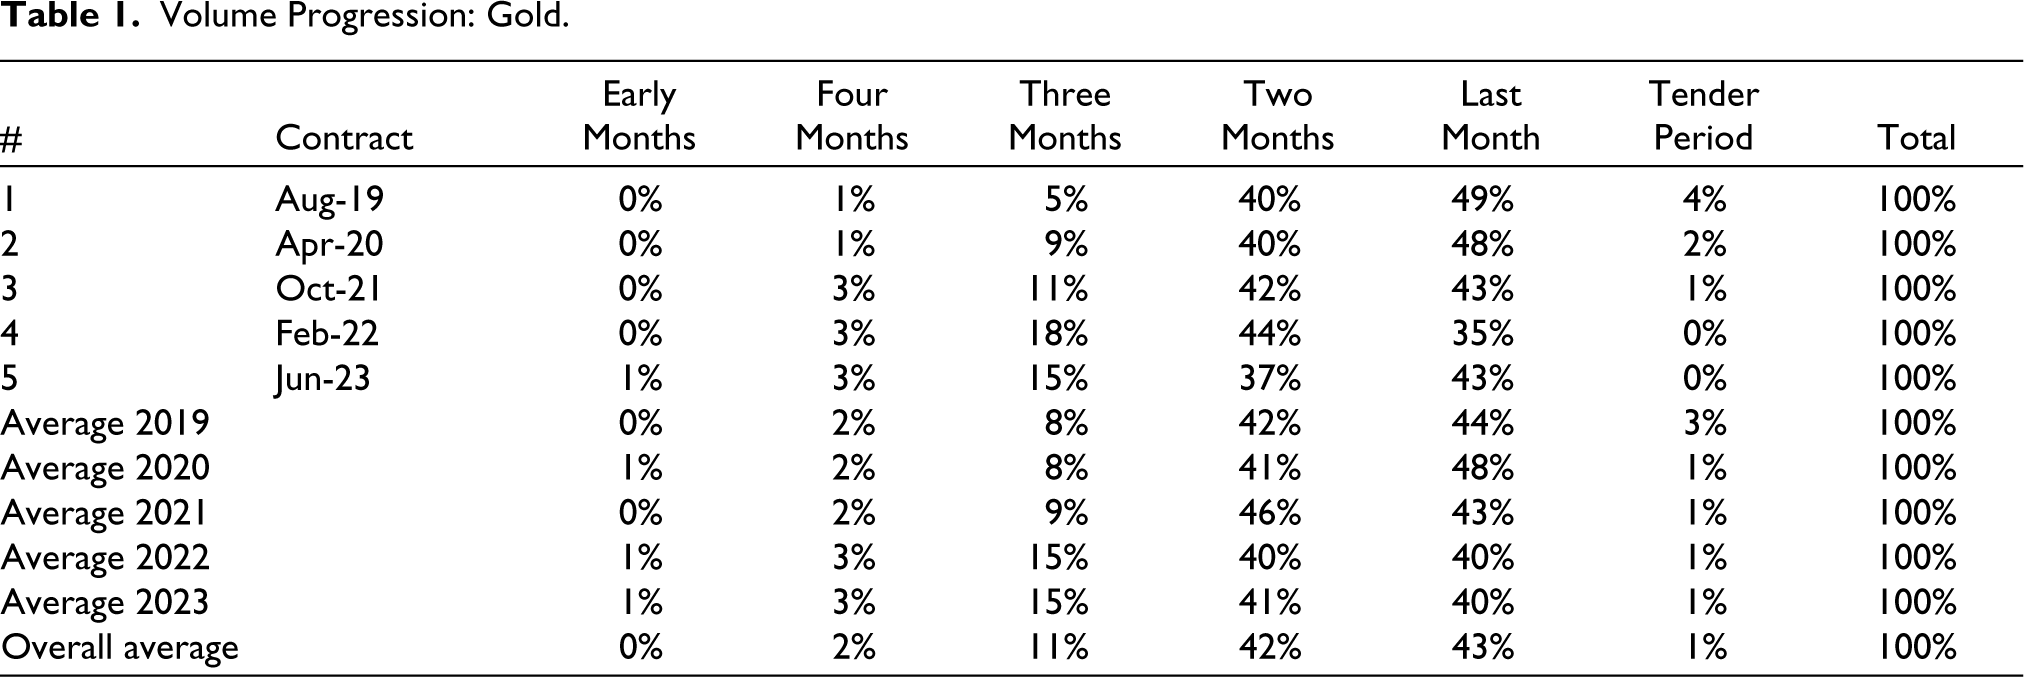
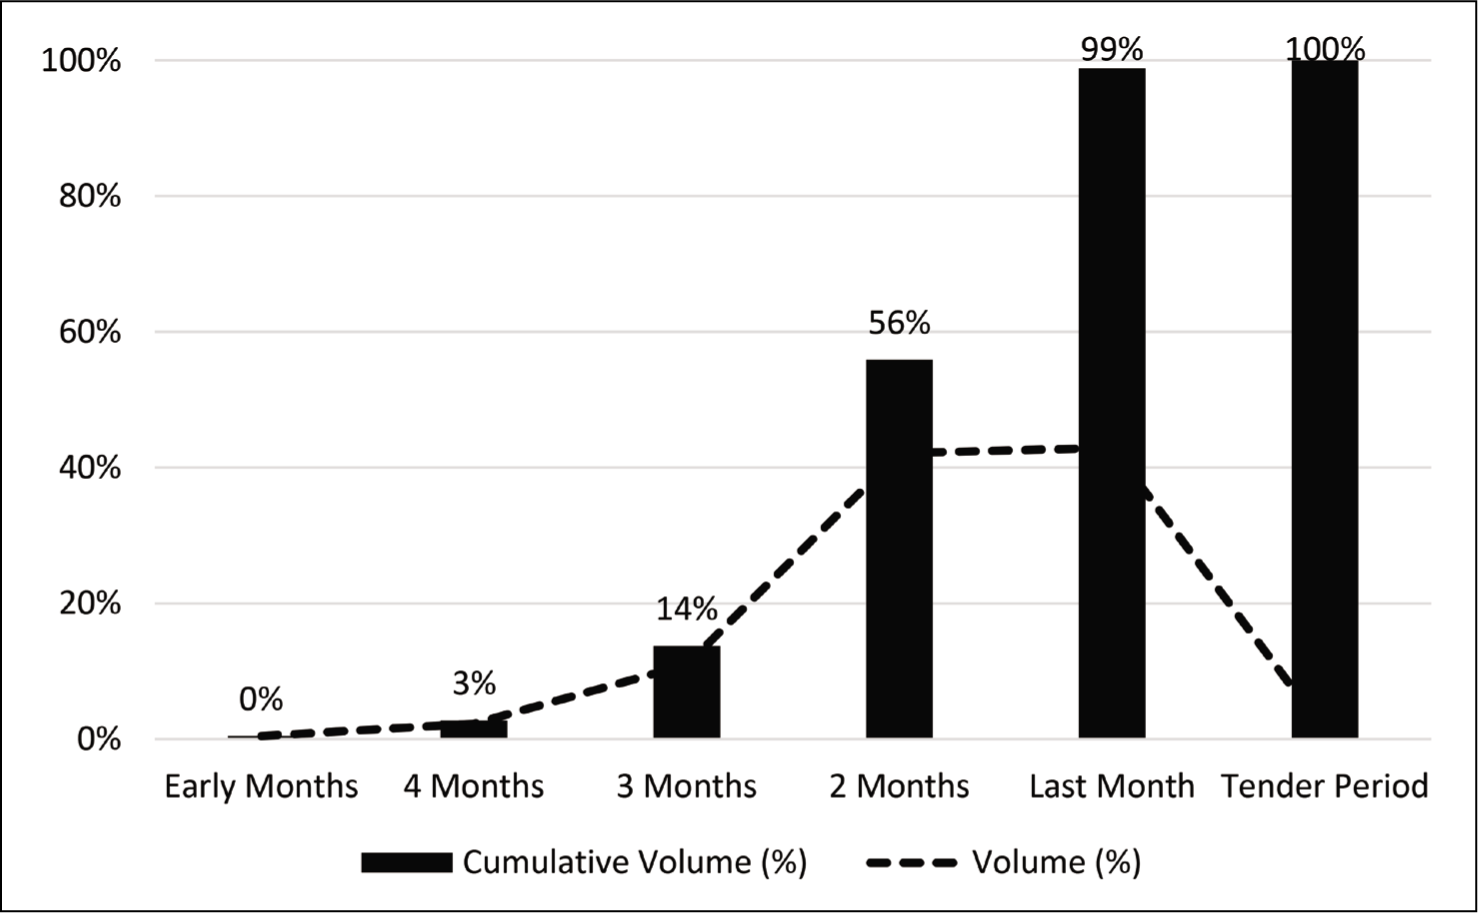
The pattern of changes in the volume of trade over the life of 25 selected futures contract of the four commodities was examined using the percentage of volume in each of the six phases identified. The results of only five sample contracts chosen as one contract from each are shown here. Details of the other contracts are not shown due to paucity of space. The details of all contracts are given in a separate supplementary file made available online. The average values of volume progression considering all the 25 contracts are represented graphically. The results of volume changes for gold contracts during each phase of the contract’s life are given in Table 1. The average percentage of volume in each phase, along with the cumulative volumes over the life of the contract, is shown in Figure 1.
It can be observed from Table 1 that the volume of trade during the early trading days of the contract as a percentage of the total volume during the life of the contract is very small. The volumes are low even when four months and three months are left for the expiry. The volume is seen to be picking up only when just two more months are remaining in the life of the contract. The same trend was observed in all the 25 contracts analysed. On average, about 85% of trade happens during the last two months. A dip in volumes during the tender period is quite obvious, as all those who are not interested in physical delivery would have squared off before this period. The percentage volume and cumulative volume over the life of the contract can be seen in Figure 1. The cumulative volume is represented as columns and the percentage volume as a dotted line. Figure 1 also shows that the major share of the trade is clustered around the last two months of the contract.
Volume Progression: Gold.
Volume Progression: Gold.
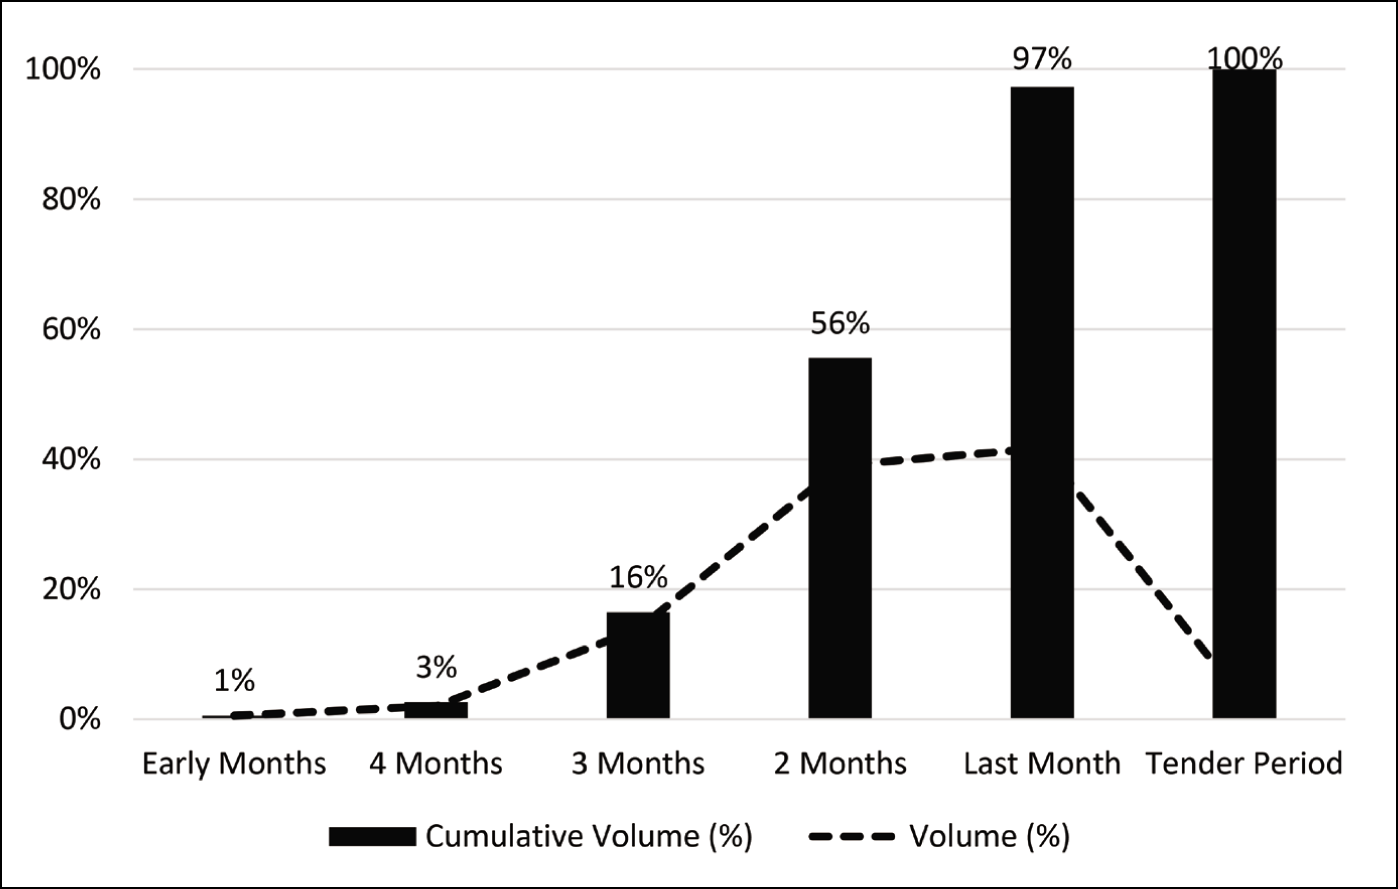
An analysis of the volume for silver futures contracts is presented in Table 2 and Figure 2. Like gold futures contracts, a similar trend is observed in silver futures contracts too. Until three months to expiry, the total volume traded is just about 17% and the remaining trade happens during the last two months of the contract, which accounts for 39% and 42%, respectively, on average. Figure 2 shows the same trend, where the cumulative volumes grow very slowly during the early stage up to three months to maturity and show an exponential jump during the last two months.
Volume Progression: Silver.
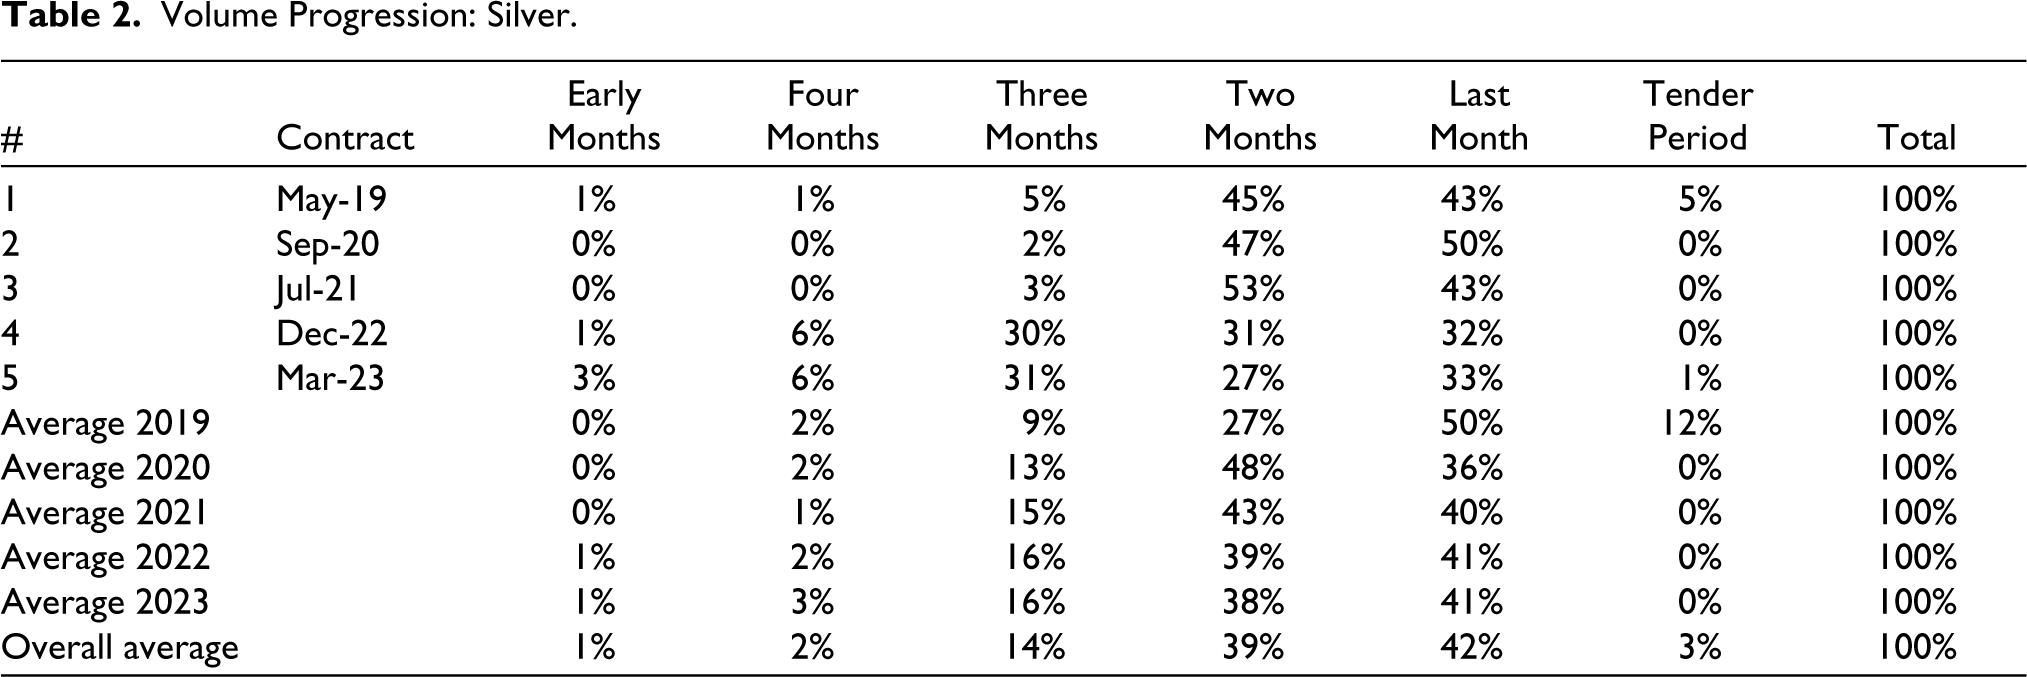
Volume Progression: Silver.
It can be seen that both the commodities under the bullion category exhibit similar patterns as far as the progression of volumes during the life of the contract is concerned. However, compared to gold, the volumes in silver contracts during the initial months seem to be marginally higher.
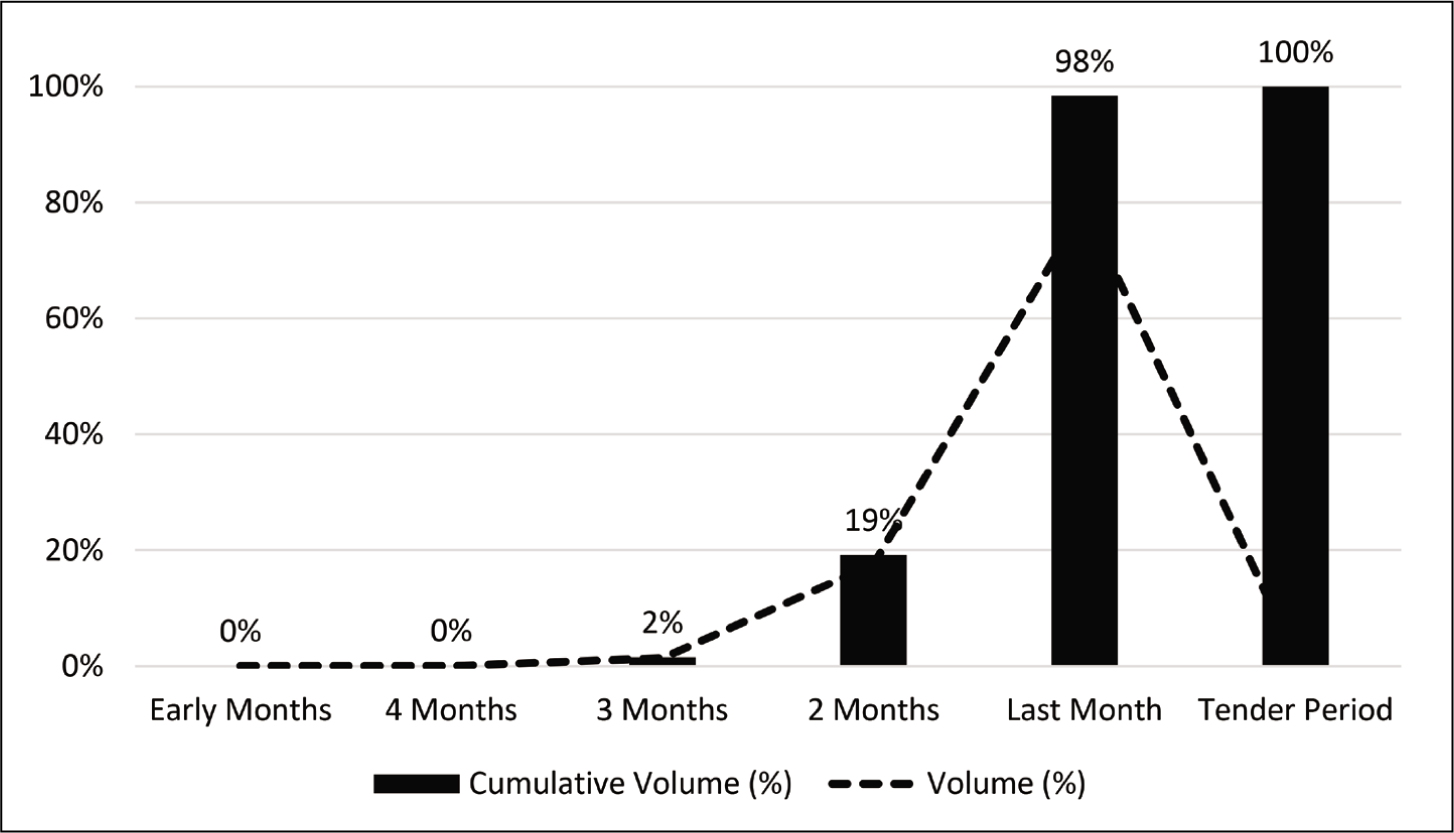
The progression of volume in the case of copper and the pattern of cumulative volume are presented in Table 3 and Figure 3. It can be seen that there is hardly any trading during the early days of the contract, leading up to three months to expiry. The volumes are skewed towards the last two months of the contract, with the last month alone accounting for 79% of the volume in copper contracts. The same is seen in Figure 3 as well.
Volume Progression: Copper.
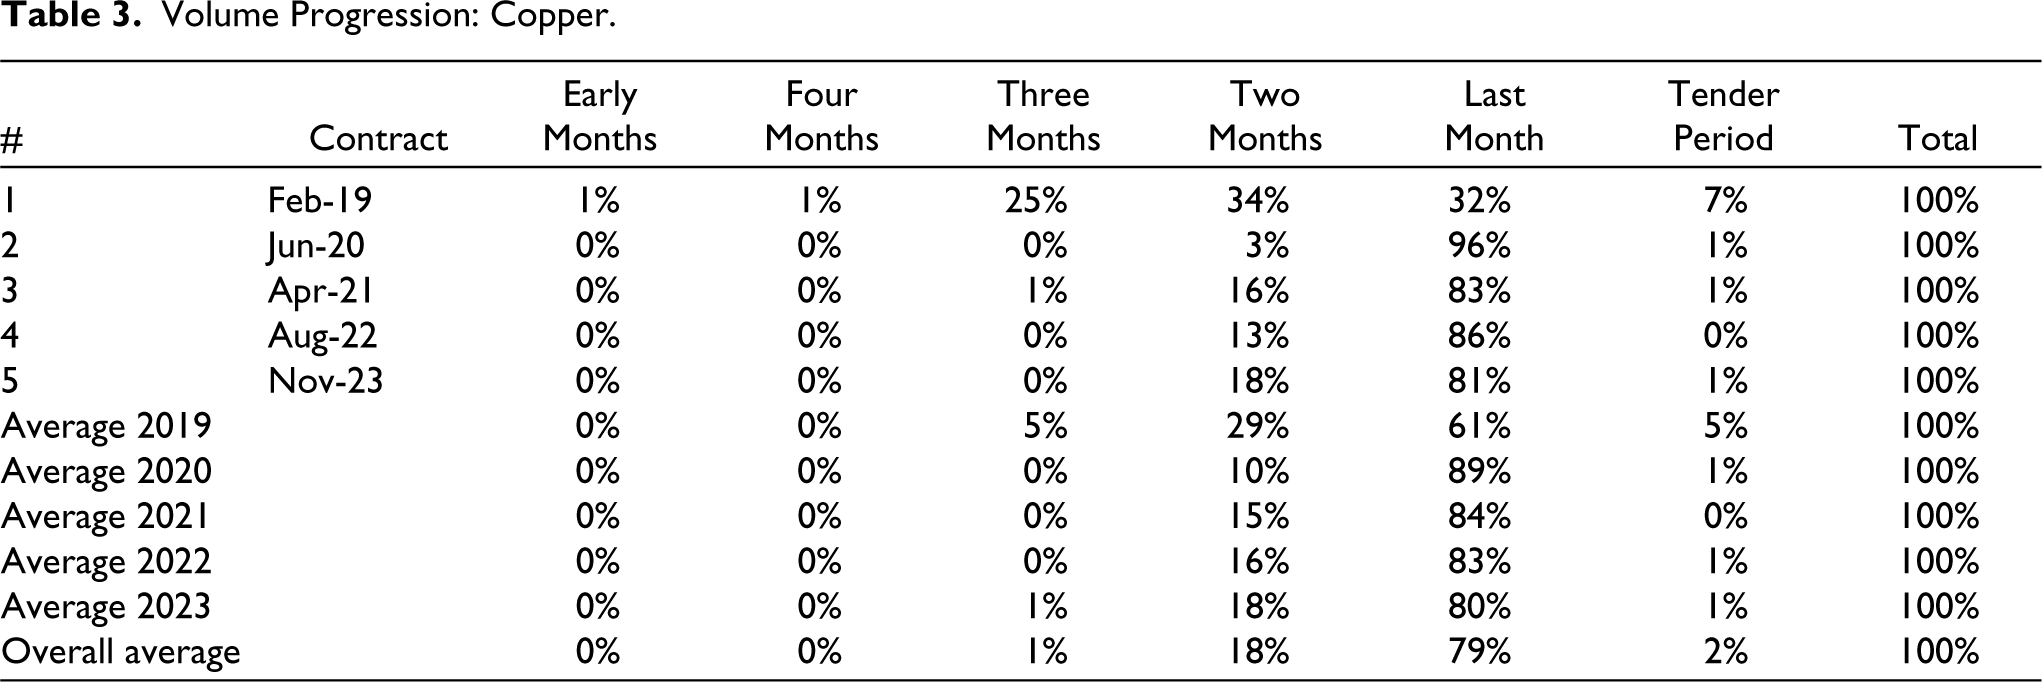
Volume Progression: Copper.
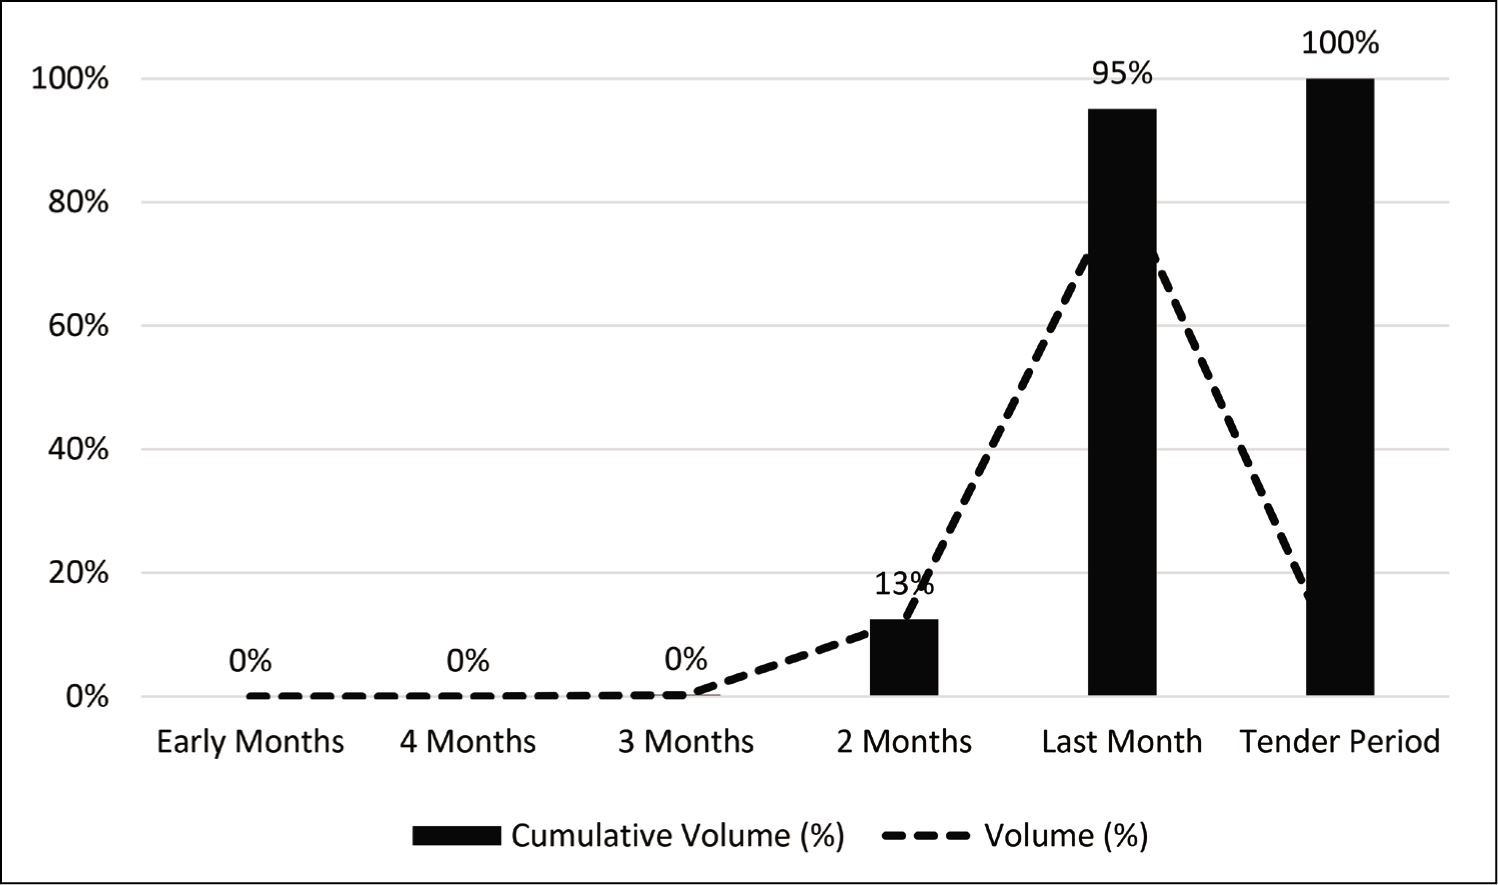
The progression of volume for zinc is given in Table 4, and the same is graphically represented in Figure 4. Like other commodities, the volume of trade is very much skewed towards the last two months in the case of zinc as well. In fact, compared to all the other three commodities, zinc contracts exhibit the highest percentage of trade (83%) during the last month of the contract period. It can be observed in Figure 4 as well that the percentage of trade during the initial phase of the contract, up to three months prior to the expiry is zero.
Volume Progression: Zinc.
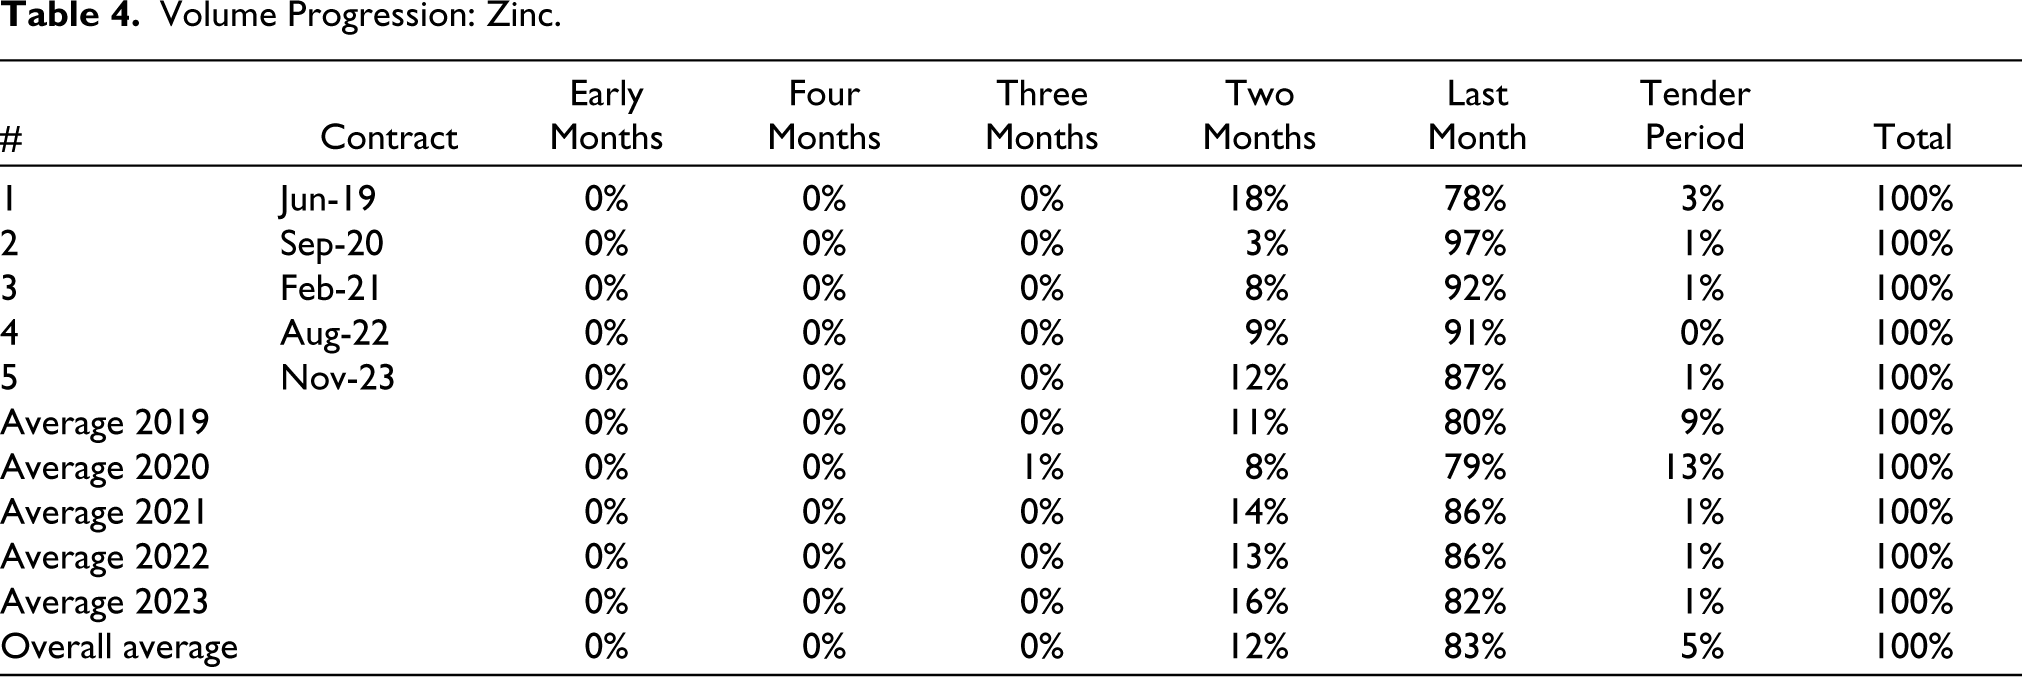
Volume Progression: Zinc.
When the base metal commodities are compared to bullion, even though the patterns are similar, there is some volume of trade during the early days leading up to three months to maturity in the case of bullion, whereas the volume during this period is almost zero in the case of base metals. It indicates that the bullion market is able to attract at least some trade during the initial part of the contract’s life, but the base metals are not getting any trade during this period.
Price–Volume Relationship
In order to analyse the relationship between price of commodities, volumes and open interest, the daily data related to these variables for all the 25contracts for the 4commodities were examined. As the first step, the stationarity of the variables was tested using the augmented Dickey–Fuller test. It was found that all the variables were non-stationary at base but turned stationary on first differencing. Since the study aims at examining the relationship between the changes in these variables, the first differenced series was further analysed. First, the correlation between the changes in price, volume and open interest was computed, which is reported in Table 5.
Pearson Correlation.
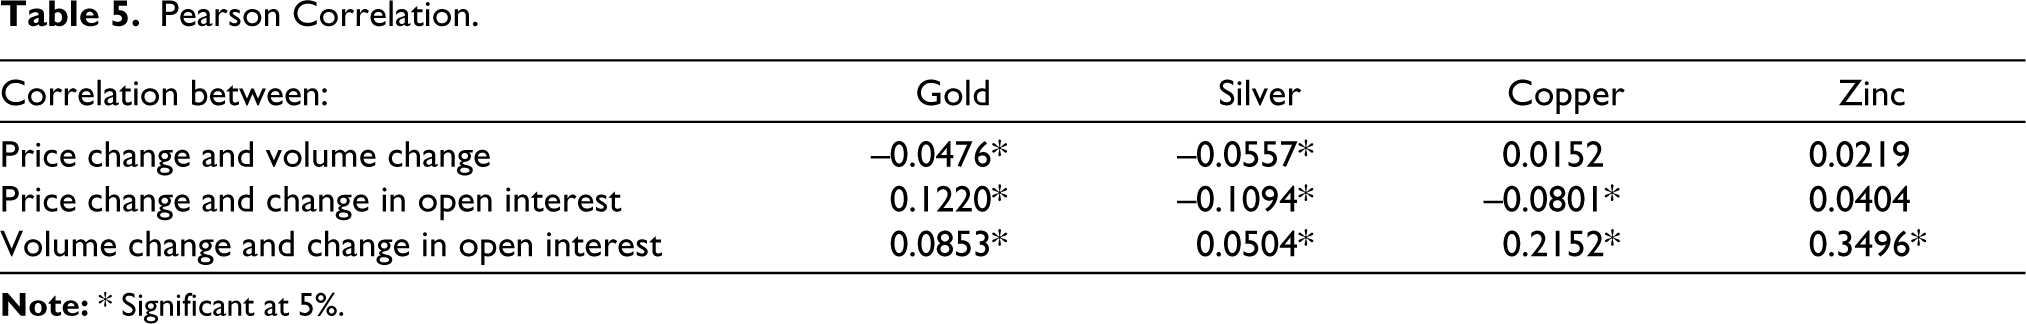
It is observed that the correlations between the variables are very weak across all commodities. The correlation between changes in price and volume is statistically significant for gold and silver but not for copper and silver. The correlation between price and volume for gold and silver is negative, indicating movements in opposite directions. The correlation between price change and change in open interest is significant for all commodities, except zinc. In the case of gold, it is positive, and is negative for silver and copper. As expected, the correlation between volume and open interest is positive for all commodities, with zinc showing the highest value. The correlation between volume and open interest is obvious as open interest depends on the volume.
In the next phase of the analysis, the VAR model is estimated for changes in price, volume and open interest. The lag length for the VAR model was decided based on the Schwarz information criterion. Accordingly, a lag length of three was chosen for gold and silver and two for copper and zinc. The parameter estimates of the VAR model for gold contracts are given in Table 6.
Coefficients of the VAR Model: Gold.
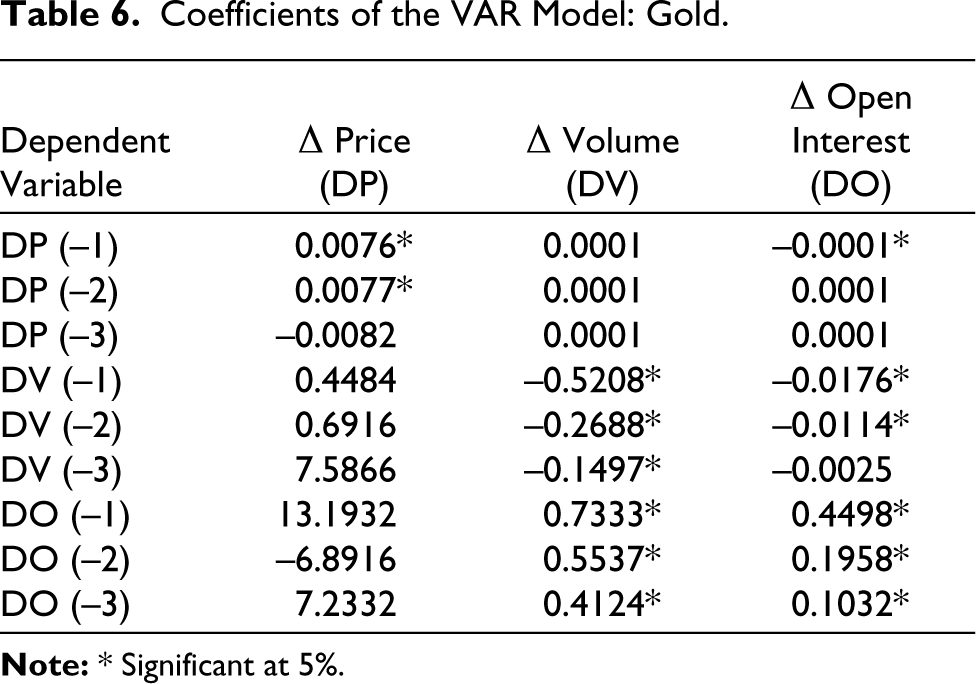
The columns of Table 6 represent the parameters estimated for Equations (1) to (3) for the gold contracts. The short-run dynamics between the variables, as shown by the VAR model, indicate that in the case of gold, the price change is not influenced by either volume or open interest. Even in the return direction, the price change is not influencing changes in volume. The price changes are influenced by its past values. The volume changes are seen to be affected by its own lagged values and also by the lagged values of open interest. In the case of open interest, it is observed that the change in price has a slight influence on it at the first lag level. Open interest is affected by the changes in volume as well as its own lagged values.
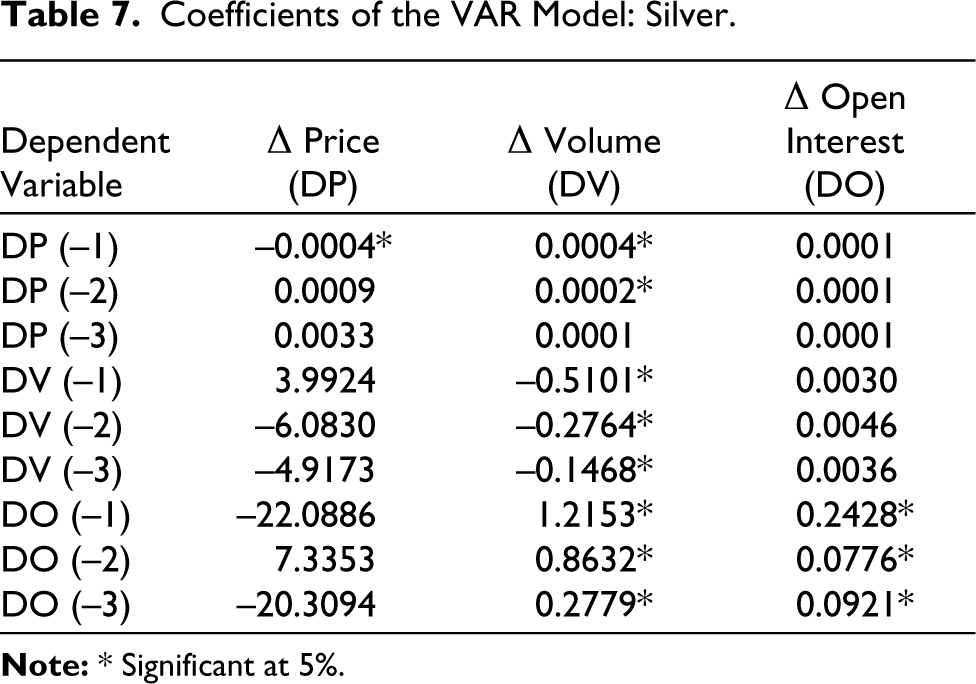
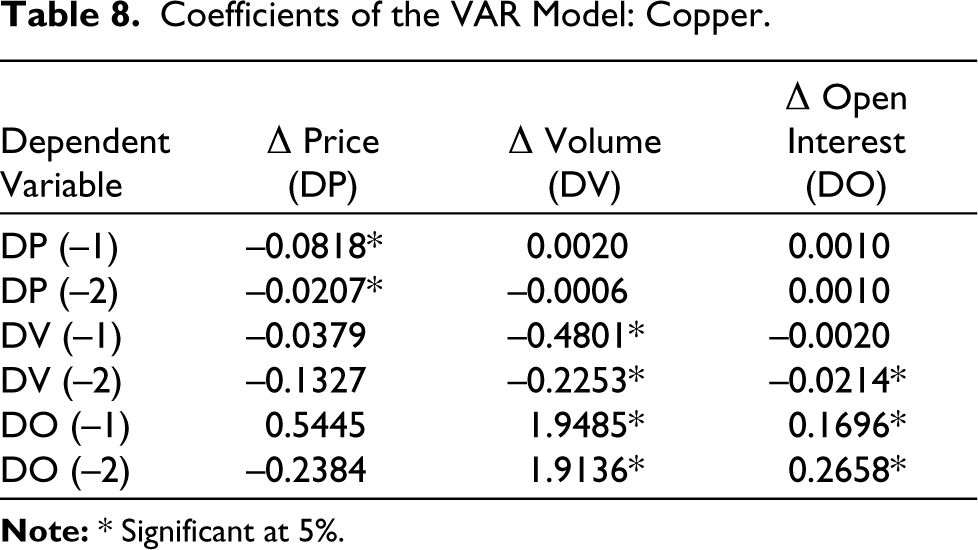
Table 7 presents the results of the VAR model for silver. In the case of silver also, the price changes are independent of changes in volume and open interest. However, price changes are seen to be influencing the changes in volume. Price movements are influenced by its lagged values. Volume movements are affected by their own lagged values as well as lagged values of open interest. The coefficients for open interest indicate that the changes are influenced only by its own lagged values and not by changes in price or volume of silver contracts. Table 8 presents the VAR estimates for copper contracts. Like gold and silver, the copper price movements are neither influenced by changes in volume or open interest nor do they influence changes in volume and open interest. The past values of price changes are influencing the price. The volume changes are seen to be affected by its own past values and open interest, whereas the open interest changes are influenced slightly by volume and by its own past values.
Coefficients of the VAR Model: Silver.
Coefficients of the VAR Model: Copper.
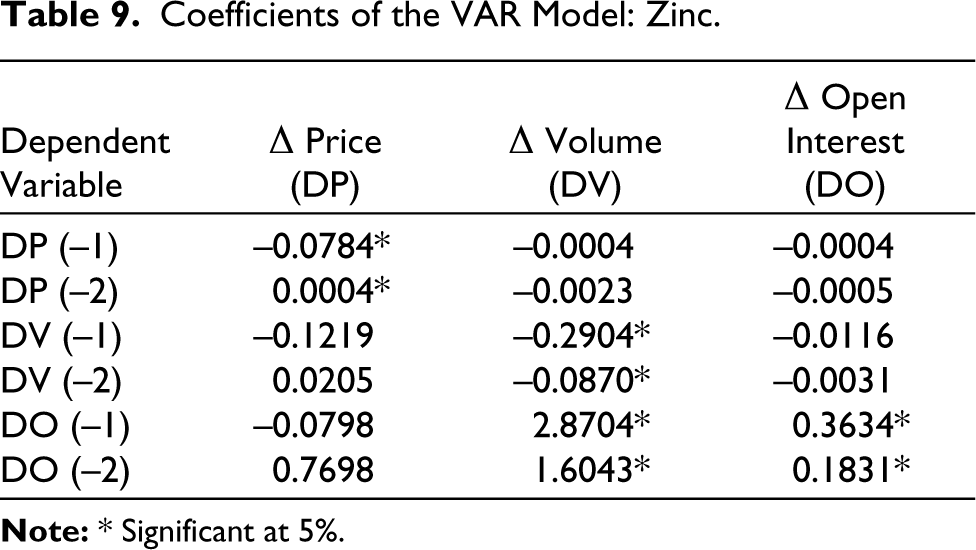
The results of the VAR model for futures contracts of zinc are given in Table 9. Similar to the other three commodities, price changes are not seen to be caused by changes in volume or open interest but are influenced by its lagged values. The price changes are not influencing the volume and open interest in the reverse direction either. Volume changes are influenced by its own past values and changes in open interest. But open interest is seen to be affected by its own values.
Coefficients of the VAR Model: Zinc.
The results of the VAR model can be summarised as follows:
As far as the changes in price of futures contracts are concerned, they are affected neither by changes in volume nor by changes in open interest. But the price change is seen to be influenced by its own lagged values. This is true for all the four commodities studied. There is unidirectional causality flowing from price to changes in volume in the case of silver. But in the case of the other three commodities, the price does not influence volume. The volume changes are caused by its own past movements as well as changes in open interest. There is unidirectional causality of a small magnitude flowing from price changes to changes in open interest in the case of gold, whereas for all other commodities, price has no influence on open interest. Volume changes are influencing changes in the case of gold and copper. Open interest is also influenced by its own past movements. The influence of open interest on changes in volume seems to be stronger than the influence in the reverse direction.
Results and Discussion
The study attempted to analyse the nature of the progression of volume during the life of futures contracts and to examine the relationship between the price, volume and open interest for bullion and base metal futures in India. The analysis of volume progression clearly shows the following:
The volume of trade in the case of bullion and base metal futures contracts is very thin during the initial months of a contract. The volumes picked up only during the last two months of the contract. Hence, the volumes are seen only in those contracts which are close to maturity (near-month contracts). There is no liquidity in the contracts till they approach maturity. This has serious limitations on the ability of a hedger to hedge the price risk from a medium to long-term perspective. Lack of volumes in the early days has implications on the ability of the market to perform the function of price discovery efficiently. Lack of volume during the tender period is an indicator that only a small percentage of contracts actually result in physical delivery. While the exchange is launching the contracts with sufficiently long trading cycles, it is not able to attract traders during the early days of the contract. Clustering of volumes towards the last two months of the contract might also be an indicator of a greater proportion of speculators in the market, as speculators hardly get into far-month contracts.
The economic rationale of derivatives markets is price discovery and risk transfer. From the results of the study, it can be concluded that efficient price discovery happens only in near-month contracts, where the volume of trade is high. In the case of contracts which are not near-month, the lack of volumes is hampering the price discovery process. Similarly, hedgers who want to take a position in futures contracts would find the lack of depth in the market as a deterrent to efficient risk transfer.
The second part of the study explored the causal relationship between changes in price, volume and open interest with correlation and the VAR model. The correlation between the changes in price, volume and open interest is observed to be very weak. The VAR model results indicate that the futures prices of bullion and base metals in India are not influenced by volumes. The volumes are influenced by price only in one commodity but are influenced by changes in open interest. The existing literature in the international markets, such as Moosa and Silvapulle (2000), Ciner (2002), Chen et al. (2004) and Hadsell (2006), suggests the presence of correlation and causality between price changes and volumes in the derivatives market. In the Indian context, Kumar (2009) reported a positive correlation between price volatility and volumes. Similar results were reported by Kumar and Pandey (2010) and Biswas and Rajib (2011). However, the current study failed to find similar results in the Indian market.
Implications
The major findings of the study have serious implications for traders, policymakers and commodity exchanges. Clustering of volumes towards the end of the life of futures contracts and the absence of causal relationship between volumes and price hampers the ability of hedgers in efficiently covering the price risk. This might force traders, especially the large ones, to migrate to the overseas derivatives market for hedging. As far as the exchanges are concerned, lack of volume directly results in lower revenue. The policymakers in collaboration with the exchanges and trading members have to initiate measures to attract genuine traders to the market and improve the volumes.
Conclusion
The study attempted to examine how the volume of trade behaved over the life of commodity futures contracts in India. Additionally, it also studied the causal relationship between futures price of commodities, volume of trade and open interest. The results indicate a lack of depth in the market during the initial phase of contracts. The volumes are clustered around the last phase of the life of the contract when it enters the near-month cycle. No evidence of strong causality between the price, volumes and open interest could be found. Since this has serious limitations on the fundamental functions of futures markets, the policymakers and the exchanges should try to attract more genuine traders and add depth to the market. Currently, the exchanges are conducting awareness programmes to explain the benefits of futures trading and are trying to attract more meaningful players in the market. These efforts are to be enhanced in the future, so that the efficiency of the market improves.
The commodity derivatives market in India is evolving, offering ample scope for future research. Further research can be carried out to examine the reasons for volume clustering towards the end of the life of the contract; reasons for lack of participation by traders during the initial phase of the contract; effect of speculative trading on the futures price and volume and hedging effectiveness of futures contracts. Whether the lack of depth is keeping the large hedgers away from the market or their absence is resulting in lack of volumes is a question that needs to be probed further. A similar study on futures contracts on agricultural commodities can also be carried out.
Supplemental Material
Supplemental material for this article is available online.
Footnotes
Declaration of Conflicting Interests
The authors declared no potential conflicts of interest with respect to the research, authorship and/or publication of this article.
Funding
The authors received no financial support for the research, authorship and/or publication of this article.
References
Supplementary Material
Please find the following supplemental material available below.
For Open Access articles published under a Creative Commons License, all supplemental material carries the same license as the article it is associated with.
For non-Open Access articles published, all supplemental material carries a non-exclusive license, and permission requests for re-use of supplemental material or any part of supplemental material shall be sent directly to the copyright owner as specified in the copyright notice associated with the article.