
Abstract
Purpose:
The purpose of this article is the scale development, refinement, and psychometric evaluation of the multi-item scale (E-SERV-EX) for assessing the customers’ expectations from the online retail services and exploring the impact of different demographic and behavioral factors on customer’s expectation.
Design/Methodology/Approach:
It was conclusive research, which is quantitative and cross-sectional in nature. Data were collected through a survey method using a structured questionnaire from 518 respondents, selected through judgmental sampling from Delhi NCT. The primary statistical tools used in the study were exploratory factor analysis, confirmatory factor analysis for scale development, and partial least square-structural equation modelling for hypothesis testing.
Findings:
The final scale had 31 items divided into nine dimensions. Assurance/trust, efficiency, fulfillment/reliability, responsiveness, security/privacy, web-design, personalization, price aspects, and customer engagement. Scales demonstrated good psychometric properties based on the findings from various reliability and validity tests conducted in this study. Web design was the most crucial factor, and personalization was the least important factor expected. When we speak about demographic factors, males had more expectations than females in individual and overall expectations. With an increase in age and income, customers’ expectations from online retailer services decrease. With the increase in distance from the physical retail outlet, customers’ expectations from online retail service increase. Consumers with more experience in internet usage and online retail usage had higher expectations. Consumers who surf and purchase more from online retailers also expect more.
Practical Implications:
The e-expectation scale developed in this study will help marketers and retailers better understand e-service quality expectations. Knowing the consumers’ expectations would help the retailers in framing the e-marketing mix and strategies. The expectations scale can be used in policy formulation and web designing. This scale will also help fill GAP 1 (expected service and management’s perceptions of consumer expectations) and GAP 5 (customer expectations and customer perceptions) of the service quality gap model of Parasuraman, Zeithaml, and Berry.
Originality/Value:
This research paper contributes to the literature by developing, refining, and evaluating a novel multi-item scale, E-SERV-EX, with good psychometric properties for measuring customer expectations from online retail services whereas most of the papers in the past measured the perceptions. E-SERV-EX can be employed by marketers, retailers, and policymakers to develop effective e-marketing strategies, web designs, and policy formulation by understanding consumer expectations. Most importantly, this scale helps fill GAP 1 (expected service and management’s perceptions of consumer expectations) and GAP 5 (customer expectations and customer perceptions) of the service quality gap model proposed by Parasuraman, Zeithaml, and Berry.
Introduction
The idea of service quality (SQ) was introduced by Grönroos (1984). Lovelock et al. (2011) acknowledged SQ as a mark of intransigent standards and high achievements or conformance to the specifications or affordable excellence. The concept of SQ varies depending upon the needs and wants of the customers. Due to the different characteristics of services expected from products, such as inseparability, intangibility, perishability, and variability, it becomes difficult to measure quality in the service settings. Quality is a significant determinant of success for any organization, especially in the online environment, as negative word of mouth travels faster in cyberspace than in traditional settings (Cox & Dale, 2001). Besides, e-commerce is rising at a fast pace. Moreover, online customer is more informed and have more options available to switch from one provider to another. Therefore, it is even more imperative to control the online SQ, which Zeithamal et al. (2011) defined as the magnitude to which a website supports effective and efficient service offerings, which has a vast range from the search features to the delivery, a platform catering to all the needs of customers.
SQ can be studied either by analyzing the disconfirmation models or the perception models. The disconfirmation model is developed by comparing customer’s perceptions of the service received with their expectations as Parasuraman et al. (1988) used. In contrast, in perception models, the expectations are considered irrelevant, and SQ is measured by the perceptions of the service received as was used by Cronin and Taylor (1994); for developing Service Performance (SERVPERF) After reviewing the past studies, most of the studies measured the SQ from a perceived performance point of view. Furthermore, no major research was found in the review explaining the e-SQ scale from the expectations’ perspectives; in this research, researchers tried to measure SQ from an expectations’ point of view. Moreover, no specific study was found explaining those expectations from the demographic, customer’s experience, and distance from the physical retail outlet point of view; and none of the models previously framed were completely comprehensive, satisfying, or acceptable in the Indian market (Cronin & Taylor, 1992; Ghorbani, 2013; Kim & Kim, 2010; Zhang et al., 2015).
Although there are diverse kinds of internet sites, this research covers only the online retail sites. Researchers were concerned about the complete e-tail purchase process, not just the initial interface of the website. They restricted participants to those who purchased goods rather than services (e.g., consultancy services) and received packages rather than downloading products over the internet (e.g., music or software). Hence, a phenomenological study is used for discovering and interpreting the interior essence of the cognitive processing of the participants (Patton, 2002).
Concept Definitions
Customer expectations are very individualistic and dependent on personal circumstances. Customer expectations are the pretrial beliefs about a product (goods or services) that serve as the reference points against which performances are adjudged (Zeithamal et al., 2011). Customer expectations are the beliefs about service delivery. Expectations could vary from customer to customer; also, based on the product purchased, the objective of the current study was to find overall expectations that most customers have from online retail sites. Zeithaml et al. (1993) defined expectations into three forms. Desired service- ‘level of services the customer wishes or hopes to obtain’ (What customers want?). Adequate service—‘level of services the customer will accept’ (What customers are willing to accept with satisfaction?). Predicted services—‘level of service customers believe or anticipate they are likely to get’ (What customers believe is likely to occur?).
Expectations measured in this study are normative expectations or desired service, referring to how service should be performed for the consumer to be satisfied or what should happen in an appropriate service encounter. Level of services the customer hopes or wishes to receive. Expectations are what customers wish for (Miller, 1977) and what they think should occur in their subsequent service encounters (Boulding et al., 1993). It can be customers’ wants and customers’ beliefs, but in this research, expectations mean the customers’ want rather than their beliefs about what service provider will offer, that is, not what will happen but what should happen. Perceived service performances broadly vary due to customer expectations (Boulding et al., 1993; Shank et al., 1996). Therefore, in place of perceived performance, researchers studied expectations in this study. For this objective, researchers performed mixed research, that is, formed a conceptual model theoretically through (qualitative) literature review and phenomenological interviews and later proved it (quantitative) empirically and came up with a valid and consistent comprehensive scale to measure customers’ expectations of services in Indian e-tailing context.
Objective of the Study
To develop, refine, and psychometrically evaluate the multi-item scale (E-SERV-EX) for assessing the customers’ expectations from the online retail services.
To explore the impact of different demographic and behavioral factors on customers’ expectations.
The remainder of the study is divided into five sections: Section 2 gives the background of the research and a review of the literature on SQ scales. Section 3 presents the overview of the methodology used in this study. Section 4 describes the stages used in the scale development, refinement, and evaluation of the psychometric properties of the scale. It is followed by identifying the relative importance of the dimensions and the impact of the demographic and behavioral factors on the overall expectations. Section 5 covers the conclusion, followed by Section 6, which has the future scope of the research.
Background Study or Literature Review
Online retailers have started realizing that the basic reasons for a company’s success are not just product availability or lower prices; it also includes online SQ (Zeithaml et al., 2002). However, despite such high importance, significant studies have not been conducted in this area (Akinci et al., 2010). SQ impact can be shown at several steps as stated by Wolfinbarger and Gilly (2003); a customer’s online shopping experience involves online search, evaluation of the alternatives, purchase decision, financial transaction, product delivery, returns if unsatisfied, and customer service. Therefore, in this study, researchers tried to cover them. Before developing its scale, the researchers reviewed around 110 studies, out of which 55 were found relevant.
A few notable studies from the Indian context were by Kandulapati and Shekhar Bellamkonda (2014); they found ‘Efficiency, fulfillment, privacy, and system availability’ as the most critical SQ dimensions. Bhattacharya et al. (2012) found ‘Citizen-centricity, transaction clarity, technical adequacy, usability, complete information, privacy and security, and usefulness of the information’ as the most notable SQ dimensions. Sahadev and Purani (2008) found ‘Efficiency, fulfillment, system availability, privacy’ as the most notable SQ dimensions.
In this study, a total of 55 research articles were reviewed, which studied the SQ in e-commerce settings; a few notable of them are mentioned in Table 1. In the studies explored, the most frequently found factors are as follows: security/privacy/trust (26), reliability (12), information/website content (12), ease of use (10), responsiveness (9), fulfillment (7), customer service (7), website design (6), customization/personalization (5), convenience (5), assessibility (5), efficiency (5), and process (4). The brackets have mentioned the number of studies according to which these studies were among the most important. These factors have helped the researchers in evaluating SQ.
Review of SQ Dimensions (Most Notable Models).
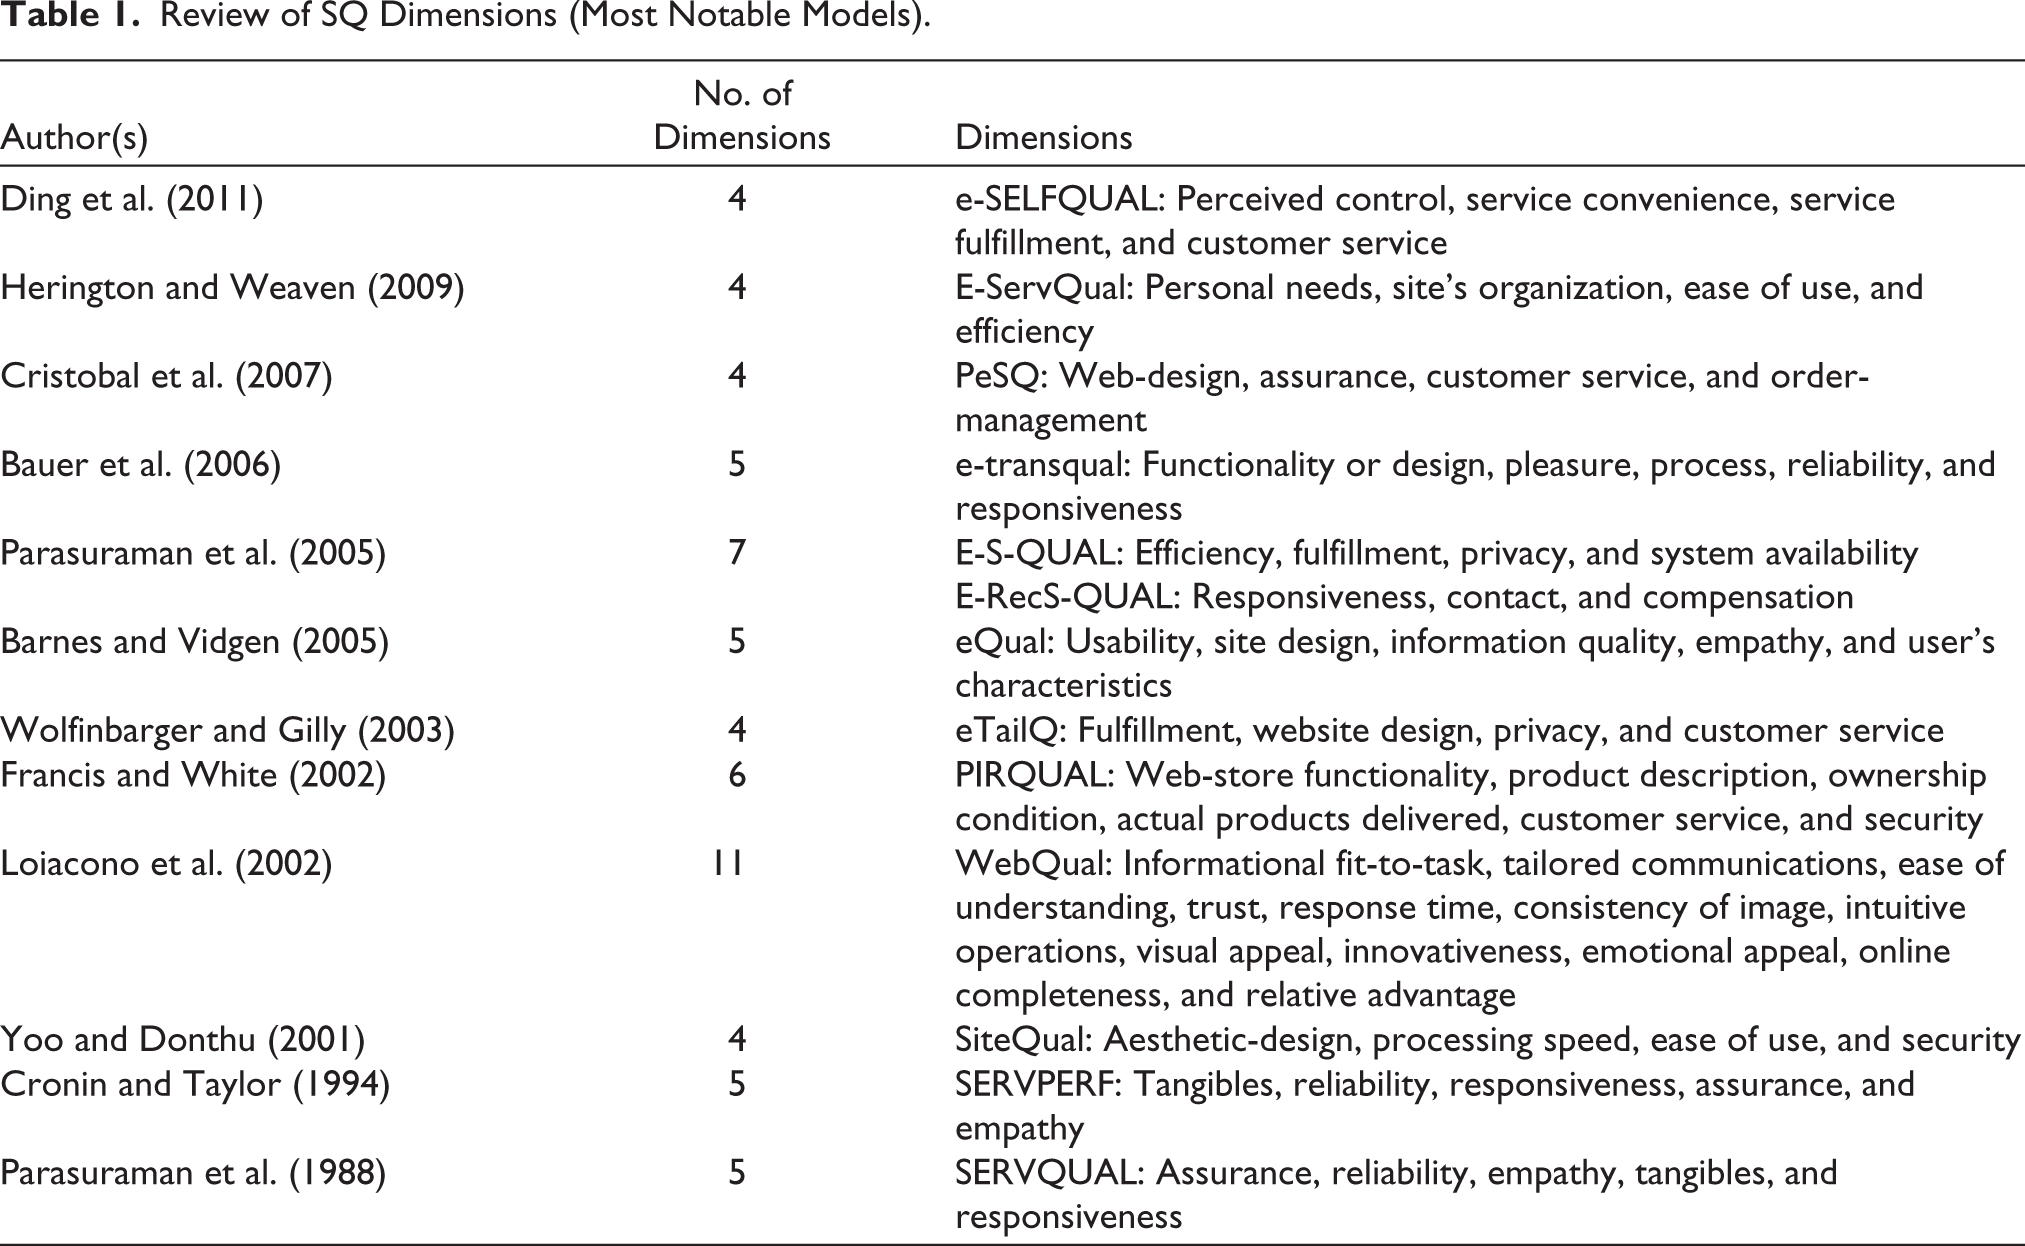
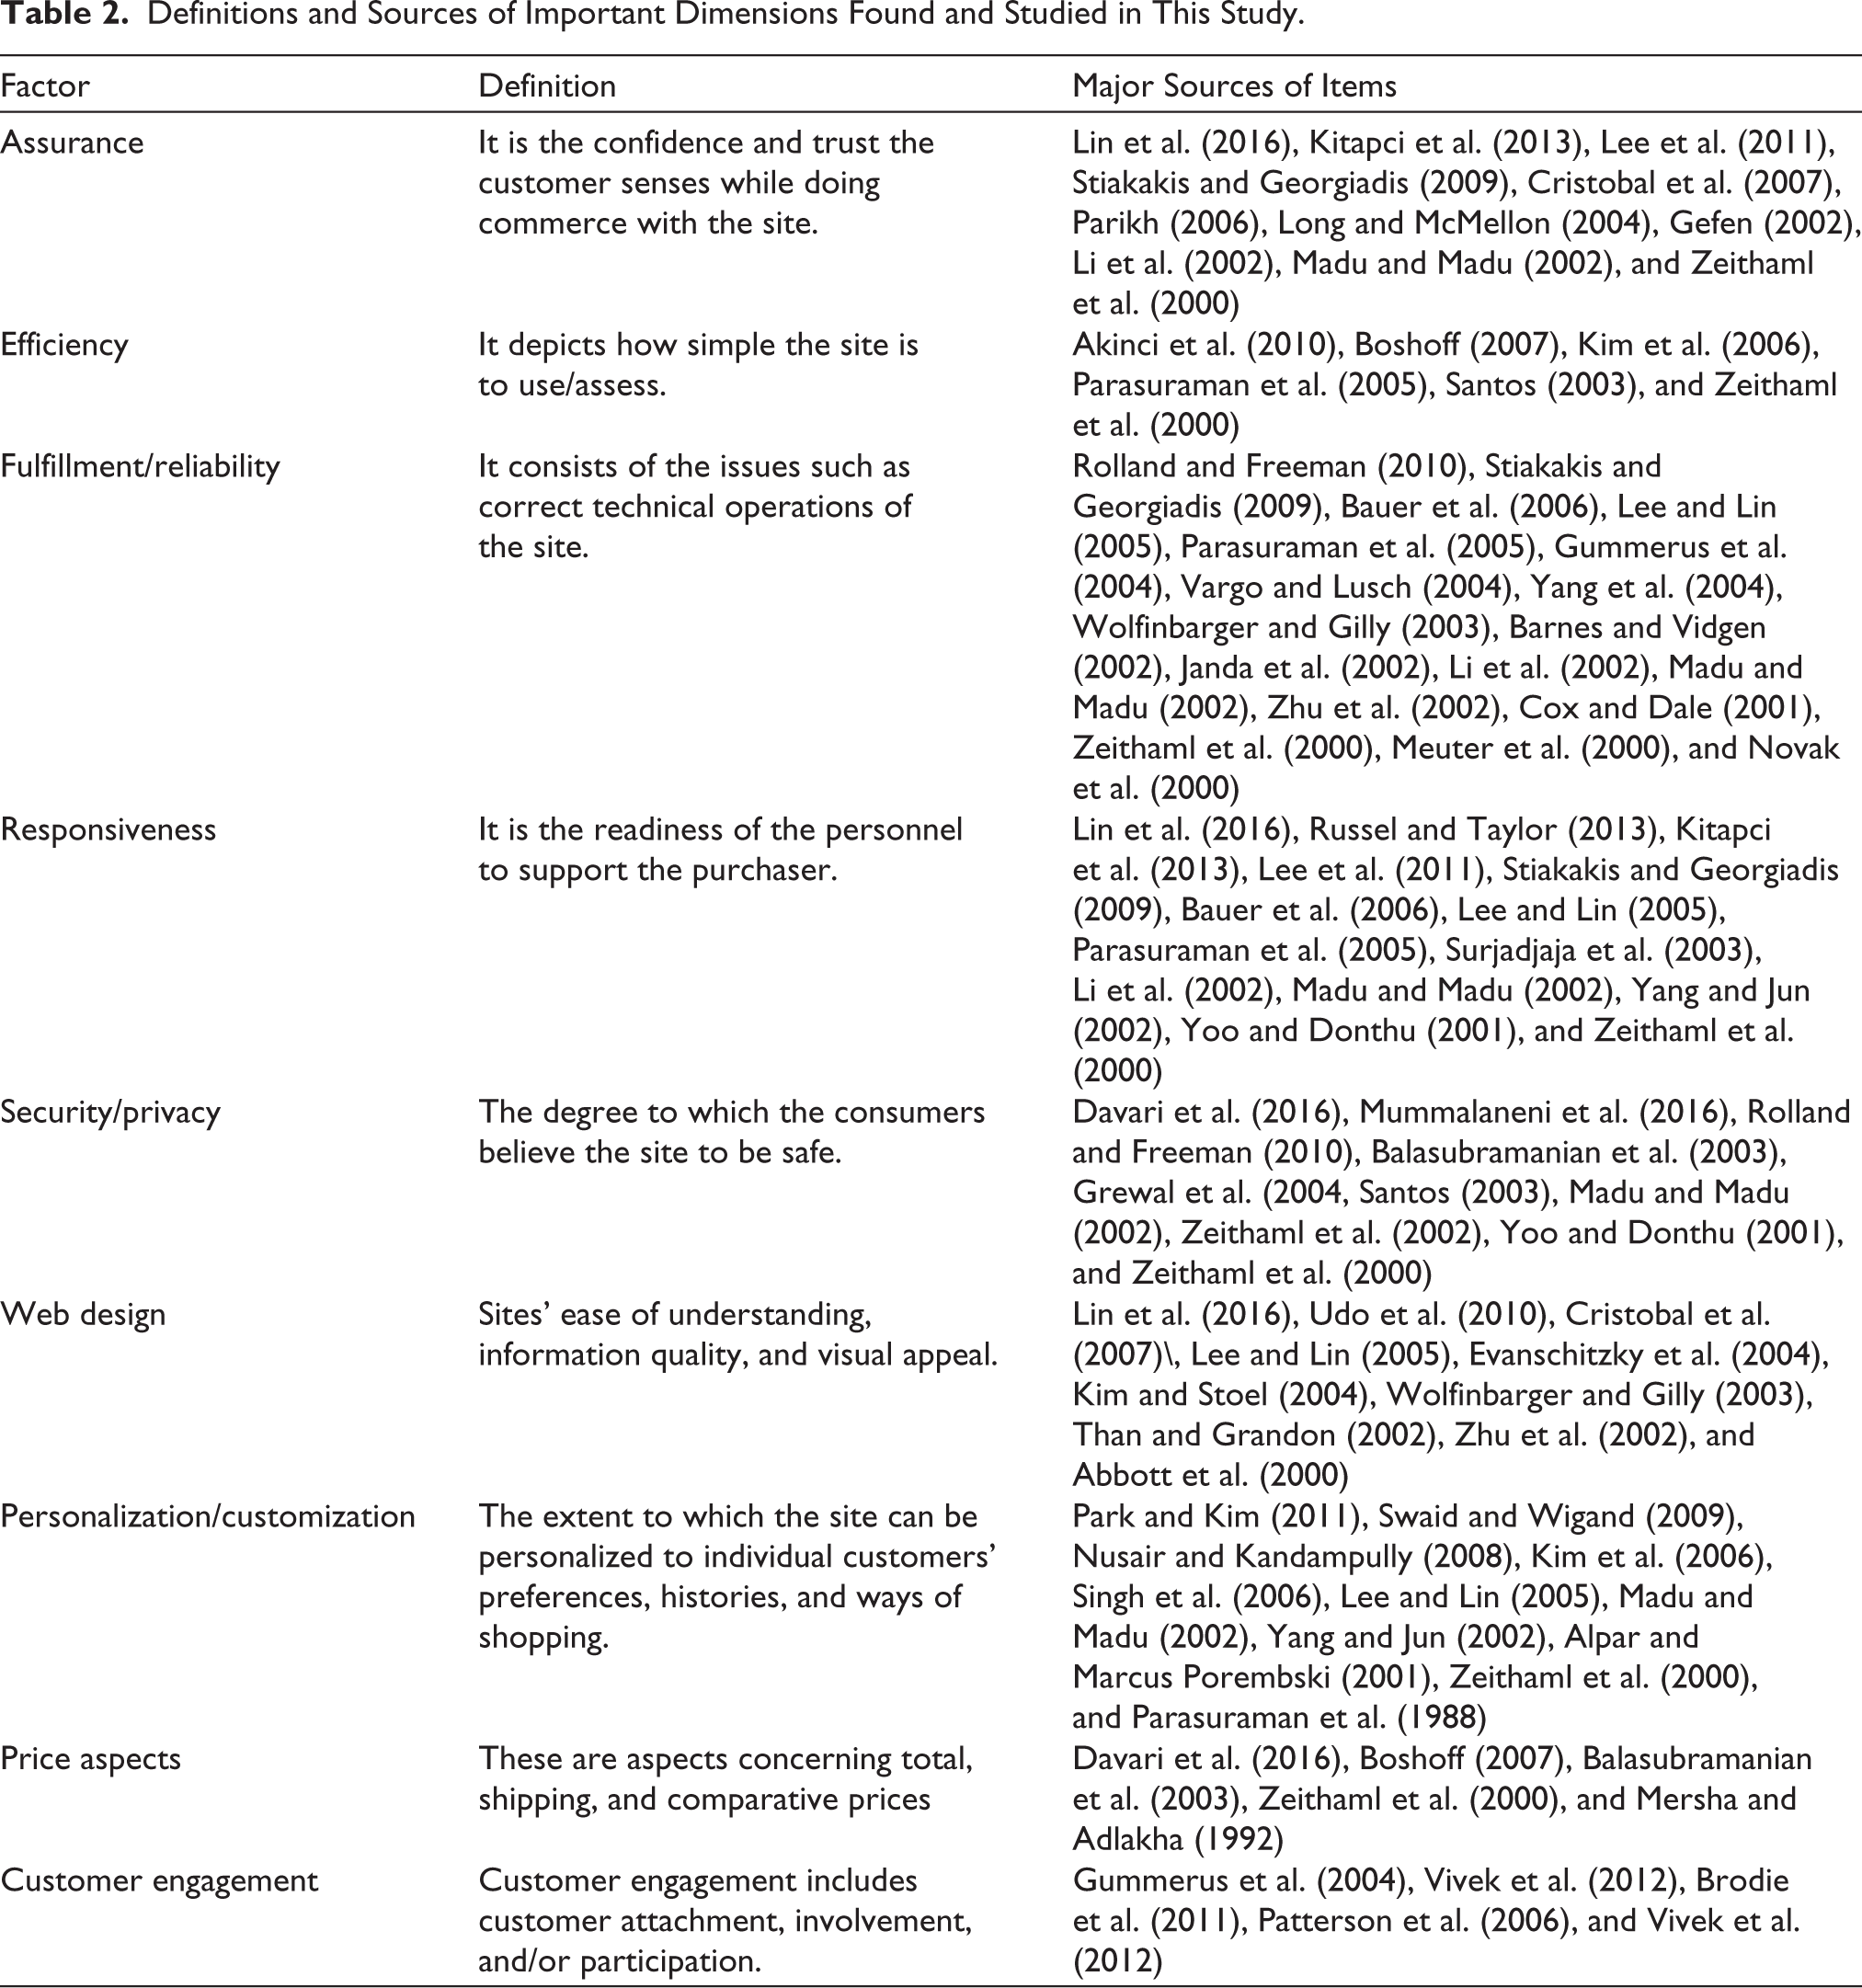
After the extensive research review, no major study was found explaining the e-SQ scale from the customer’s expectations point of view. In contrast, the literature supports that SQ is measured as perceived performance. Additionally, none of the SQ measurement models previously framed was completely comprehensive and satisfying as per the Indian perspective, which led to the study’s first objective of developing, refining, and psychometric evaluation of the multi-item scale (E-SERV-EX) for assessing the customer’s expectations from the online retail services. The definitions and sources of important dimensions found and studied in this study are mentioned in Table 2.
Definitions and Sources of Important Dimensions Found and Studied in This Study.
Additionally, several other studies were also explored explaining the impact of various factors on shopping behavior, such as those by Wong et al. (2018), Sahney et al. (2013), Jayawardhena et al. (2007), Grewal et al. (2004), and Arnold and Reynolds (2003), who studied the impact of gender. Donthu and Garcia (1999), and Korgaonkar and Wolin (1999) studied the impact of income. Wong et al. (2018), Sahney et al. (2013), Comegys and Brennan (2003), Joines et al. (2003), and Keng Kau et al. (2003) studied the impact of age. Brown et al. (2003) and Keng Kau et al. (2003) studied the effect of experience. Perea y Monsuwé et al. (2004) explored the impact of distance from the retail outlet on shopping behavior. In the literature review, several pieces of research were found studying the impact of various demographic and behavioral factors on customer shopping behavior, having mixed findings. Still, no major study was found that explained their impact specifically on their expectations, leading to the study’s second objective study, that is, exploring the impact of different demographic and behavioral factors on total expectation and the following hypotheses:
H1: Different demographic and behavioral factors have a significant effect on total expectation.
Research Methodology
Researchers followed the scale development paradigm proposed by Carpenter (2018), Arnold and Reynolds (2003), Nunnally and Bernstein (1994), and Churchill (1979). An inductive research approach with conclusive (descriptive) designs were used in this study. Methodologies applied in the study were quantitative and cross-sectional. The survey technique was used for the data collection using a structured, multi-item, five-point, and self-administered questionnaire. Online surveys were conducted through emails and mobile messaging apps, while offline surveys were conducted in the respondent’s colleges and homes. Only the people who have used online retail services were selected for the survey. Before conducting more complex structural analyses, scale developers must investigate the response distributions for each item. When examining these distributions, it is essential to identify and eliminate items with highly skewed and imbalanced distributions (Clark & Watson, 1995). Because, as a result of their limited variability, these items are likely to have weak correlations with other items in the pool and will perform inadequately in subsequent structural analyses.
First, important dimensions were identified, and the primary scale was developed using 65 focus group interviews and reviewing 55 previous research leading to a total of 180 items. This was followed by the preliminary study where 15 experts (academicians, working professionals, and methodologists) selected through judgmental sampling, checked the content and face validity of the items as stated by Netemeyer et al. (2003); this process left the researchers with 97 items, which were found to be necessary, non-repetitive, non-ambiguous, and non-redundant. All 97 items were sent for a pilot study. Researchers sent the questionnaire to around 300 respondents from Delhi NCT, from which the researchers received 130 responses, out of which 91 responses were found complete and suitable. The average age of respondents was 26.4 years, and it consisted of 42 males and 49 females. The pilot study data was checked for its internal consistency using the examination of the item to total correlation (>0.50), item to item correlation (>0.30), and Cronbach’s alpha (>0.70), investigation of dimensionality through exploratory factor analysis (EFA) (Netemeyer et al., 2003; Nunnally & Bernstein, 1994). This process left the researchers with a total of 45 items divided into a total of 9 dimensions.
Since the publication of Churchill’s paper, there has been a greater emphasis on test reliability and validity in marketing measurement (Peter, 1981; Peter & Churchill, 1986). After the preliminary and pilot study, the scale with 45 items was sent for validation to a sample of more than 900 respondents from Delhi NCT, out of which around 518 responses were returned; the sample size was above the prescribed limits stated by Ringle et al. (2012), Hair et al. (2011), and VanVoorhis and Morgan (2007). Ringle et al. (2012) meta-analyzed 204 studies, which were done using partial least square (PLS)-SEM; they found that the average sample size in those studies was 238.12, and the median was 198. Observations should be at least 10 times the variables under study (Hair et al., 2014); in this study, there were 45 items; therefore, the study should have at least 450 responses. VanVoorhis and Morgan (2007) considered the sample size of 500 as very good in such studies.
The population studied in this study was just the Delhi NCT region. Delhi was selected as the most multicultural and diverse city in India, and Delhiites have proper facilities of traditional and online retail. Most importantly, the results of Delhi could be similar to other metropolitan cities, which are the biggest markets for online retailers. In this study, researchers used (non-probability) purposive sampling for sample selection because the exact population parameters were unknown, and the sampling frame was not available (Kotler & Armstrong, 2016; Yeo et al., 2017). Mostly the students were selected for this study as they happen to be the most active online buyers (Yoo & Donthu, 2001). The final scale had 31 items (9 factors) shortlisted after the exploratory and confirmatory factor analysis (CFA).
The study’s major statistical tools were EFA (principal axis factoring [PAF]), CFA, and PLS-bootstrapping for hypothesis testing. PLS-SEM has a higher level of statistical power compared to CB-SEM (Hair et al., 2011), simpler (Tenenhaus, 2008), and more sensitive in detecting relationships (Sosik et al., 2009). It can work with a small and much wider range of sample sizes (Diamantopoulos & Siguaw, 2013). Major software used in the study were Jamovi 0.9.0.3, SmartPLS 2.0 Module 3 and Grammarly.
Findings and Analysis
Demographic Profiling of Respondents
A total of 518 respondents were surveyed in the final study (female = 226 and male = 292). The average age of the respondents was 24.5 years, and the average family income was ₹62,527. Among the respondents, Amazon (55.6%, n = 288) was the most popular online retail site, followed by Flipkart (28.2%, n = 146). Clothing and accessories (42.5%, n = 220) followed by electronics (30.5%, n = 158), and books, media, and music (13.5%, n = 70) were the most sought-after categories. The approximate distance between the nearest physical retail store from the respondent’s place was 1.3 km. On average, they have been using the internet for the last 8 years and 10 months and online retail sites for the past 3 years and 7 months. They visit online sites 25.36 times on average per month, whereas they shop only 2.97 times per month.
Scale Development
Exploratory Factor Analysis
After the preliminary and pilot study (as explained in the methodology chapter), data were passed through the EFA. Before applying EFA, common method bias (CMB) was checked through Harman’s single factor score. Total variance for the single factor found was 32.1%, and a score of less than 50% suggests that CMB does not affect this data (Mat Roni, 2014). This was followed by EFA, that is, PAF was used as it analyses the covariance and is better suited in cases like this (Carpenter, 2018). PAF was conducted on the 45 items with orthogonal rotation (Varimax) (Tabachnick et al., 2007).
Before proceeding with factor analysis, its assumptions were verified, which were found under the limits suggested by Hair et al. (2014) and Nunnally and Bernstein (1994). In the first assumption, Bartlett’s test of sphericity for correlations among the variables was found. As shown in Bartlett’s test of sphericity, chi-square was significant with a probability of less than 0.001, followed by the second assumption, that is, Kaiser–Meyer–Olkin’s (KMO) measure of sampling adequacy value was 0.907, much higher than the minimum recommended value of 0.60. KMO’s measure of sampling adequacy of each item was found, and it was ranging between 0.766 and 0.954, which was above the minimum level of 0.60, for proceeding further to factor analysis. The third assumption represents that all the communalities (h2) ranged between 0.517 and 0.932 and were higher than the threshold level of 0.50. In the fourth assumption, extracted factors explained 75.951%, much more than the minimum recommended value of 50%.
Retention of the factors was decided through Kaiser–Guttman criterion; factors having eigenvalues more than at least one were retained (Carpenter, 2018; Vooris & Clavio, 2017). The minimum loading in the study was 0.657, as explained in Table 3, which is above the minimum acceptable limit of 0.4 Carpenter (2018) and Nunnally and Bernstein (1994). Five variables were deleted due to lower communalities after EFA (Carpenter, 2018; Hair et al., 2014). This process left the researchers with a total of 40 items.
EFA and CFA Results.
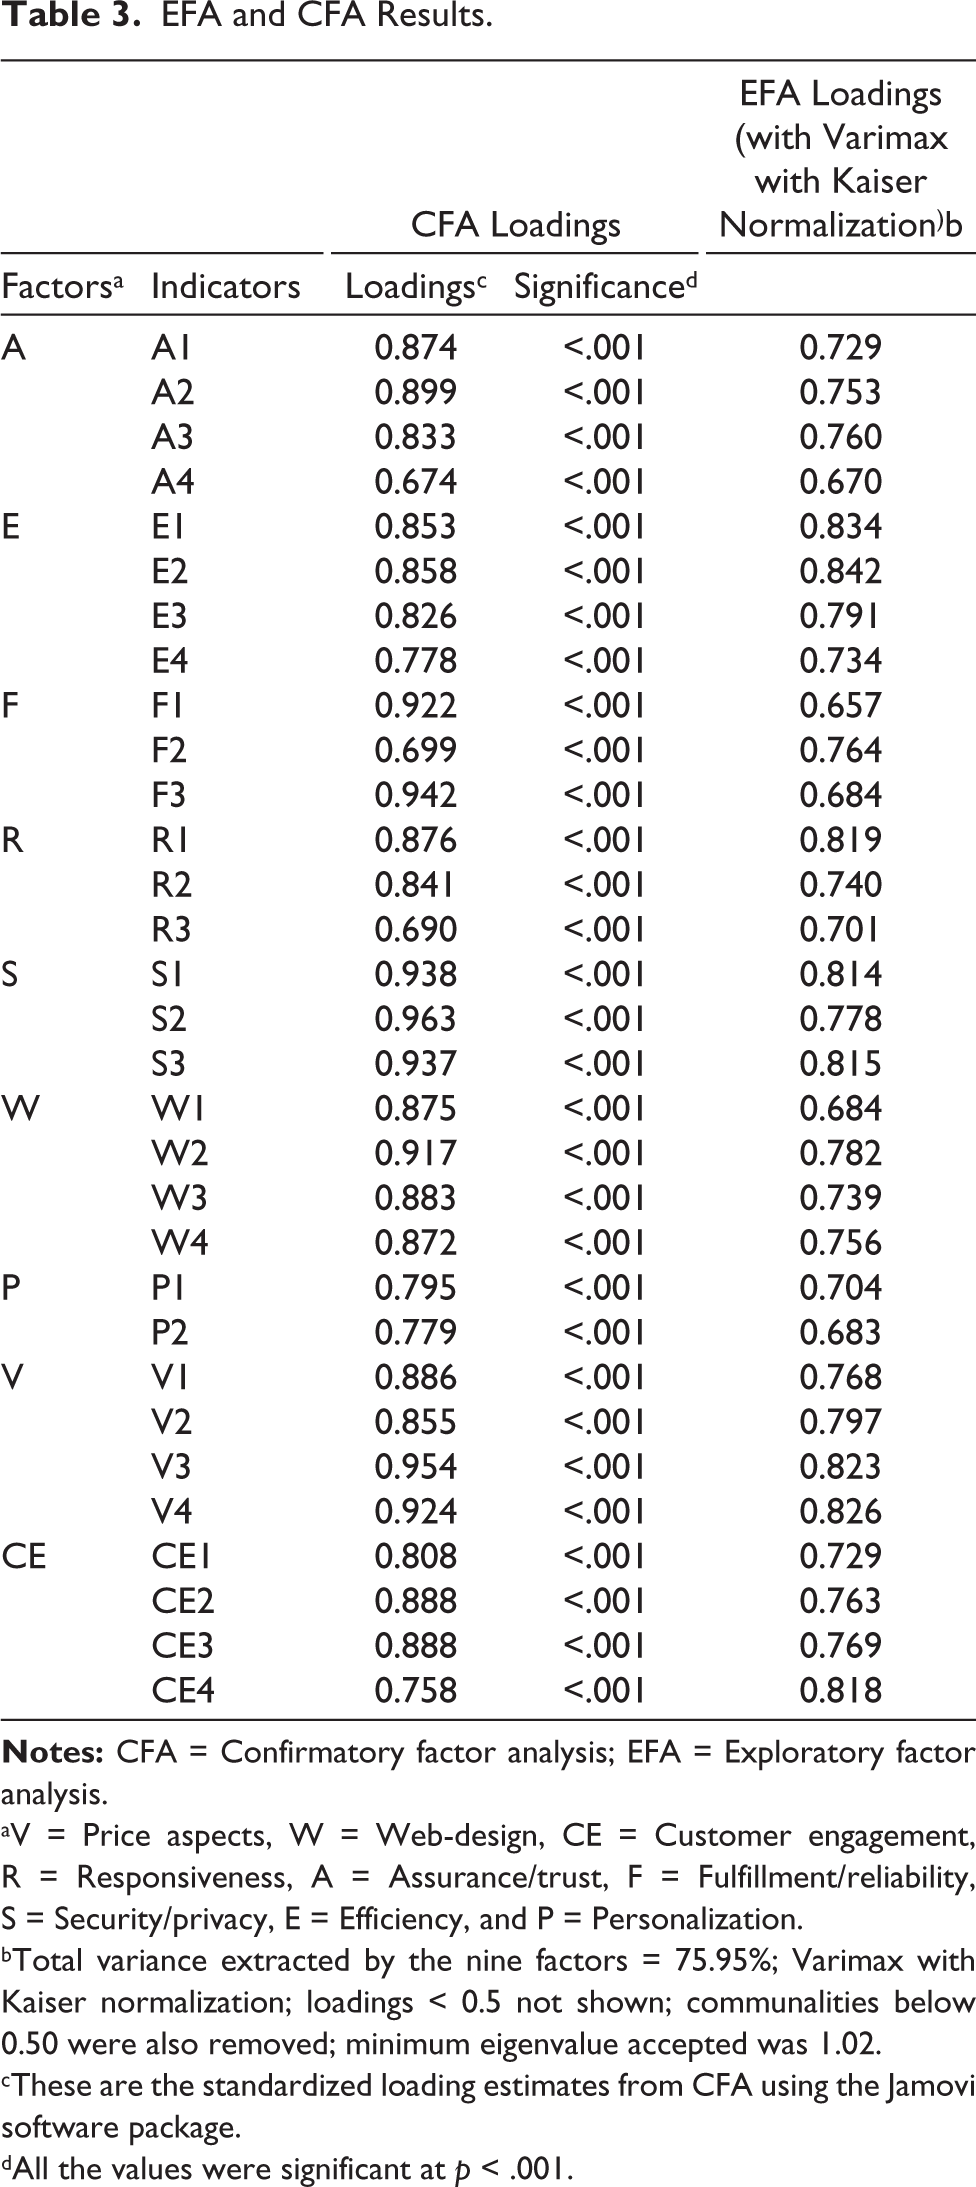
aV = Price aspects, W = Web-design, CE = Customer engagement, R = Responsiveness, A = Assurance/trust, F = Fulfillment/reliability, S = Security/privacy, E = Efficiency, and P = Personalization.
bTotal variance extracted by the nine factors = 75.95%; Varimax with Kaiser normalization; loadings < 0.5 not shown; communalities below 0.50 were also removed; minimum eigenvalue accepted was 1.02.
cThese are the standardized loading estimates from CFA using the Jamovi software package.
dAll the values were significant at p < .001.
Confirmatory Factor Analysis
After the EFA, the CFA measurement model was applied to assess the constructs’ validity and reliability. Standard loadings in this study were ranging between 0.674 and 0.963, as explained in Table 3, which were above the minimum accepted value of 0.5 (Hair et al., 2014). In addition, all of them were significant at the 0.001 level. Average Variance Extracted (AVE) of every factor was above 0.50 (ranged between 0.619 and 0.895) to demonstrate convergent validity (Hair et al., 2014; Vooris & Clavio, 2017). Additionally, all the composite reliability (CR) values were more than AVE values (Min. CR was 0.765, Min. AVE was 0.619), proving the convergent validity of the contract (Hair et al., 2014). CR was above the recommendation criteria of 0.7 (min in the study was 0.765), and Cronbach’s α values were above-recommended level of 0.70 (min in the study was 0.764) as suggested by Hair et al. (2014) for internal consistency. Values of maximum shared variance or average shared variance were less than AVE (Hair et al., 2014), leading to prove the discriminant validity of the construct.
The model also showed significant fit measured through standardized root mean square residual value was 0.0333, much below the goodness-of-fit (GoF) value of 0.08 as suggested by Hu and Bentler (1999). Root mean square error of approximation, the value was 0.0531, much below the GoF value of 0.1 as suggested by Hair et al. (2014). Comparative fit index (0.957) and Tucker–Lewis index (0.950) or also known as non-normed fit index, values of these measures were above 0.90 and 0.95, respectively, for the model to be satisfactorily-fit, which implies the trustworthiness or reliability of the model under different criteria as Hair et al. (2014). For improving the model fit, items with loadings less than 0.50 were removed, starting with the factors with a maximum number of items to a minimum (Vooris & Clavio, 2017). Items with high modification indices were also deleted as their deletion improved the model’s fitness indexes. In the CFA process, a total of nine items were deleted to improve the model fit. Finally, after the preliminary, pre-pilot, pilot study, and the final EFA and CFA, a total of 180 variable or expectation items were reduced to 9 factors containing 31 variables in total.
As the underlying assumptions of CB-SEM, that is, normality of data for parametric tests, were not fulfilled, researchers moved towards a more robust estimator, variance-based PLS-SEM (Reinartz et al., 2009). According to Hair et al. (2011), the minimum sample size for PLS-SEM should be 10 times the largest number of statistical paths directed at a particular latent construct in the structural model. According to which, the minimum sample size for studying this objective was 90 but considering our sample size to be equal to 518, it was sufficient. The research framework used in the study was developed by the PLS model using SmartPLS 2.0 software to measure and make structural model estimates (Ringle et al., 2012). As the PLS-SEM algorithm converged data in 11 iterations (less than 300), it means that the data are normal, having sufficient sample size, absence of outliers and data not having too many identical values in indicator (Wong, 2013)
There are two sub-models/components in a PLS-SEM model. The first component is the outer loop or measurement model, which has exogenous constructs that do not have any structural path relationship pointing at them (Hair et al., 2011). It represents the relationships between the latent variables and their observed indicators. This is where all the measurement models were examined for their psychometric properties. The second component of the PLS-SEM model is a structural model or inner loop, which has endogenous constructs explained by other constructs through structural model relationships (Hair et al., 2011). It specifies the relationships between the independent and dependent latent variables. This part focuses on testing the research hypotheses.
Overall Measurement Model Results for the Objective
The internal consistency of constructs is measured through CR and Cronbach’s alpha, CR values in this study ranged between 0.765 and 0.975. Cronbach’s alpha values between 0.765 and 0.947. Both were above minimum accepted values of 0.6 and 0.7 for CR and Cronbach’s alpha, respectively (Nunnally & Bernstein, 1994). Indicator reliability is measured using indicator loadings, whose values in this study were between 0.774 and 0.970, which were much above 0.7, as suggested by Hair et al. (2011). Construct validity was measured of each latent construct in the measurement model through convergent validity and discriminant validity: For convergent validity, the value of AVE should be greater than 0.50 (Hair et al., 2011), and in our study, it ranged between 0.757 and 0.929. Leading to convergent validity of the models. Except when measuring the effect of various demographic factors on total expectation when AVE was 0.349, in that case, the model did not show convergent validity.
For the discriminant validity, AVE should be more than the construct’s highest squared correlations with any other latent construct (Fornell–Larcker criterion) (Fornell & Larcker, 1981); in this study, minimum AVE found was 0.757, which was more than squared correlations between other latent constructs which were less than 0.00265. The model’s capacity to predict (Rigdon, 2014) measured through Stone-Geisser’s Q2 (Stone, 1974) obtained through blindfolding, which gives cross-validated redundancy and communality. Hair et al. (2011) suggested the cross-validated redundancy (Q2) to be more than zero, explaining the construct’s predictive relevance. Here, these values were more than zero, 0.072–0.329, showing its predictability.
The GoF proposed by Tenenhaus et al. (2005) was used to assess the structural model. The geometric mean of average AVE and the average R2 is used to calculate the GoF value. The resulting values of GoF for the models were between 0.189 and 0.560. The cutoff values proposed by Wetzels et al. (2009) for assessing the result of GoF analysis are GoF = 0.10 (small), GoF = 0.25 (medium), and GoF = 0.36 (large). All these values show that the measurement model reflects good construct validity, reliability, and predictability.
Structural Models
A nonparametric bootstrapping procedure with 5,000 resamples of the dataset (N = 518) was applied before running the PLS algorithm (for which the path weighing scheme was used) to find the statistical significance of factor loadings and path coefficients (Hair et al., 2011).
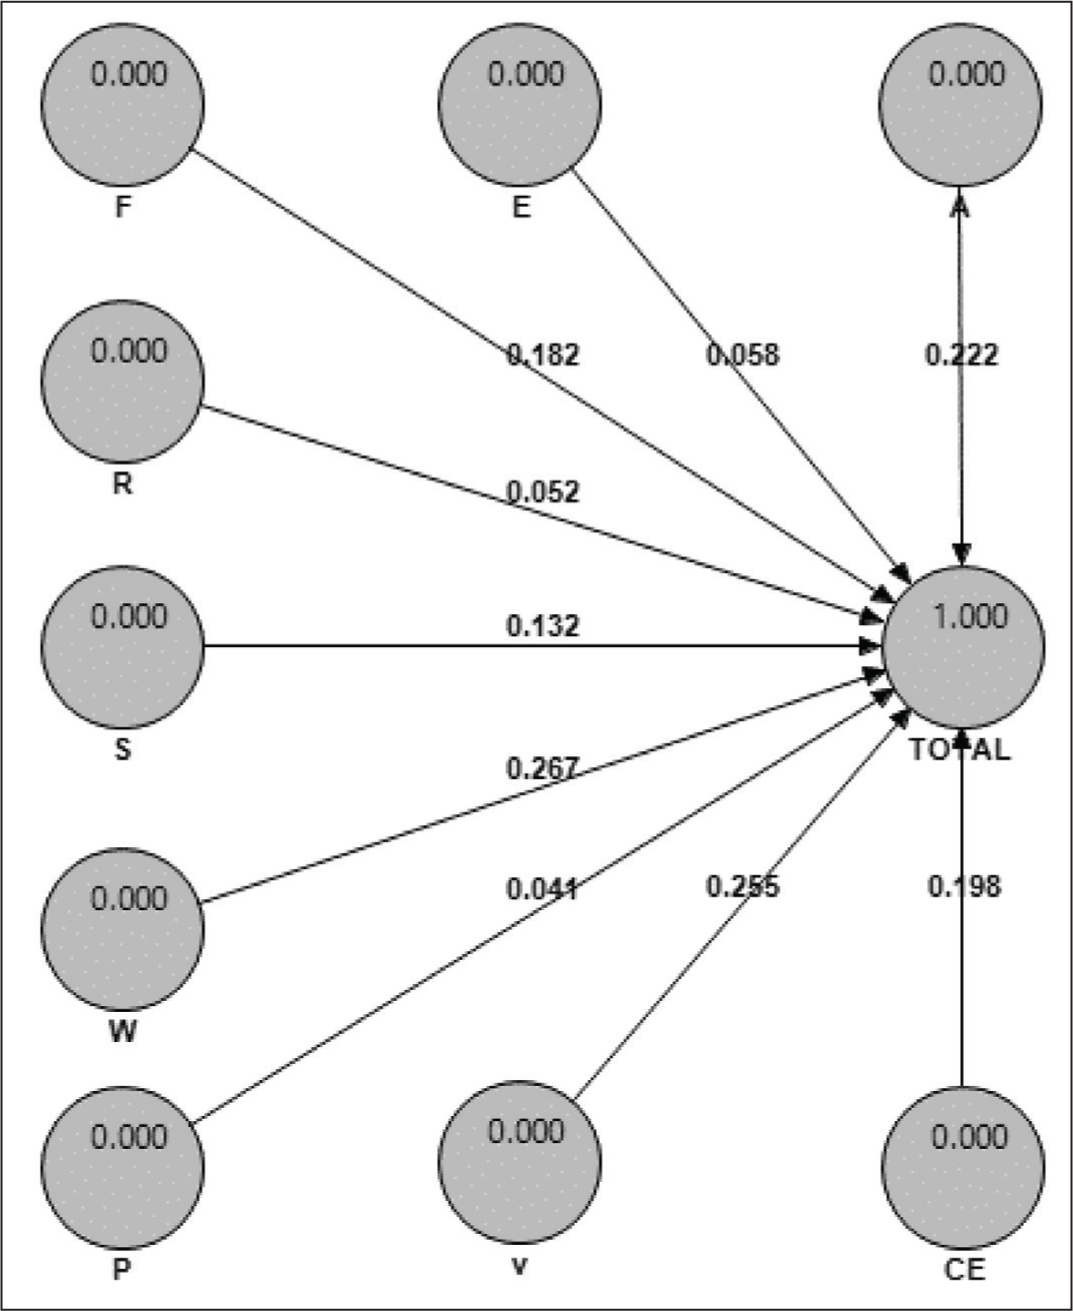
According to Figures 1 and 2, it was found that all the expectation factors, that is, A = Assurance/trust, E = Efficiency, F = Fulfillment/reliability, R = Responsiveness, S = security/privacy, W = Web-design, P = Personalization, V = Price aspects, and CE = Customer engagement, had a significant effect on the consumer’s total expectations from the online retailers, although the impact of web design (0.255) was the maximum, and the minimum result was of personalization (0.041).
Path Coefficients, Different Expectations.
t-Value, Different Expectations.
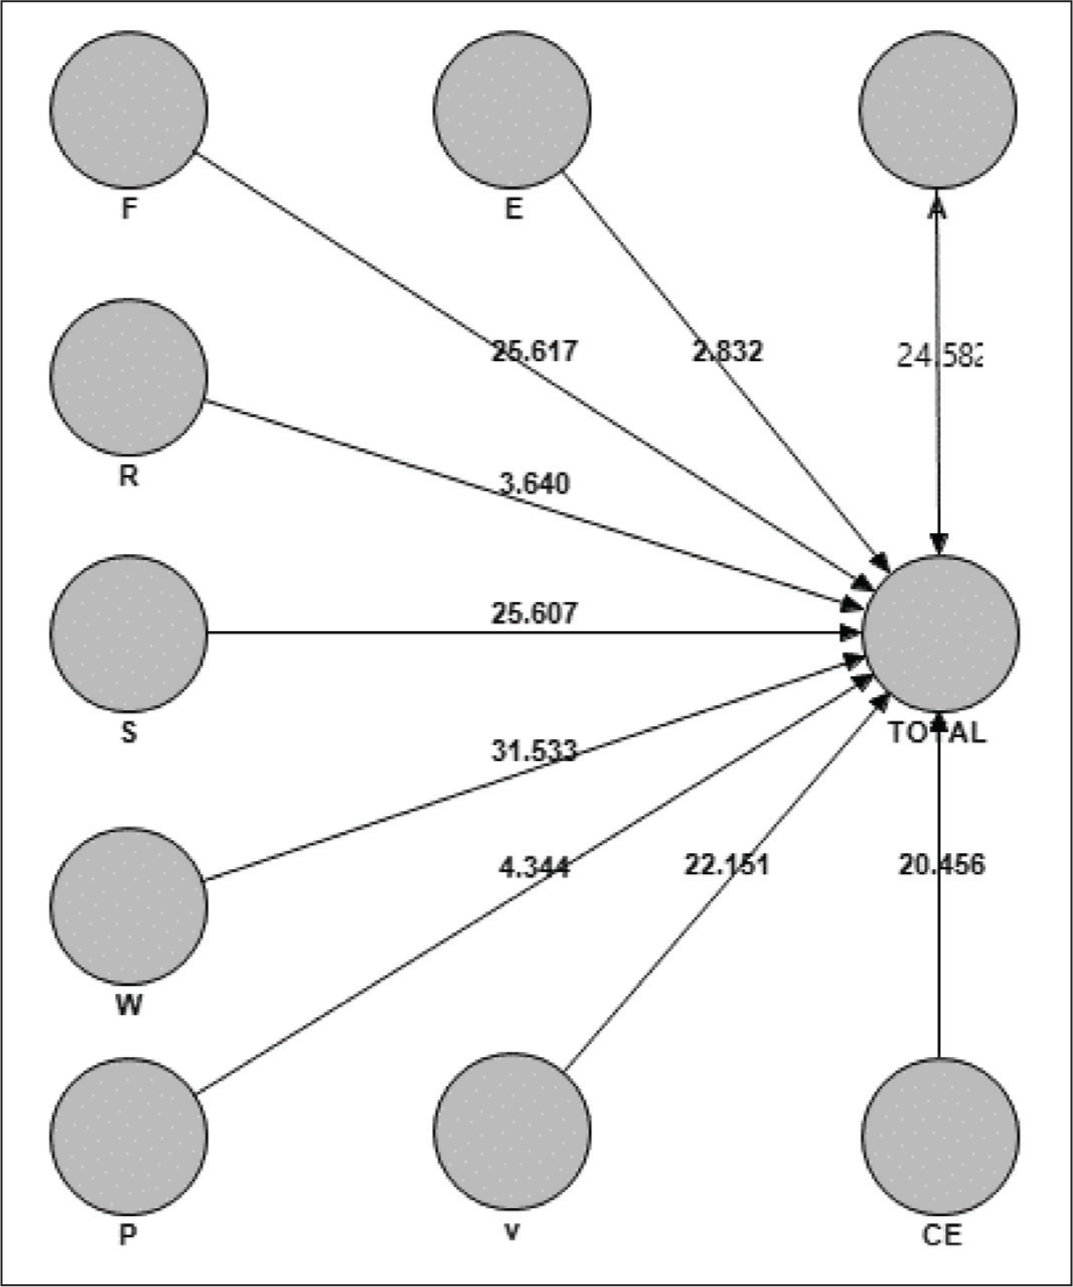
For testing the hypotheses, PLS regression was used using SmartPLS and its results are mentioned in Table 4.
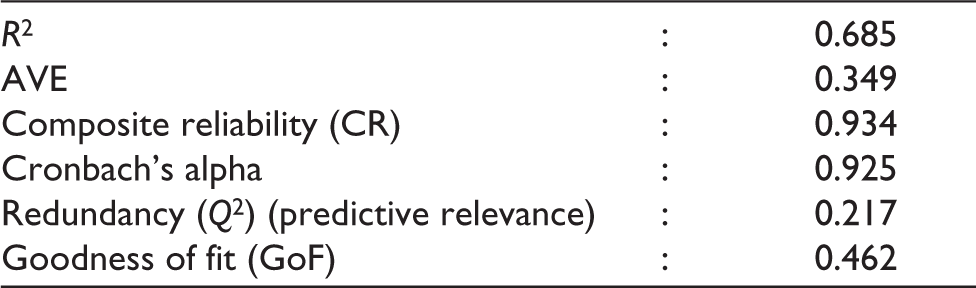
Distance, experience of internet usage, experience of online retail usage, average number of times surfing the online retail sites/apps, and average number of times purchasing from the online retail sites/apps had a significant positive effect on consumers’ expectations from the online retail sites/apps, that is, with their increase, the consumer’s expectations also increase. In contrast, age and income had a significant negative relationship on consumer’s expectations from the online retail sites/apps, that is, with their increase, the consumer’s expectations decrease. Change in gender also significantly affected the consumer’s expectations from online retail sites/apps. Males (mean = 4.49) had higher expectations from online retail sites/apps than females (mean = 4.32). In the analysis, gender was coded as a dummy variable. The results of the model estimation are given in Table 4. Overall, the model explains 68.5% of the variance in consumer expectations. R2 values of 0.2 are considered high in consumer behavioral studies (Hair et al., 2011). Other values of redundancy, validity, reliability and GoF were also satisfactory, as explained earlier.
Effect of Various Demographic and Behavioral Factors on Total Expectation.
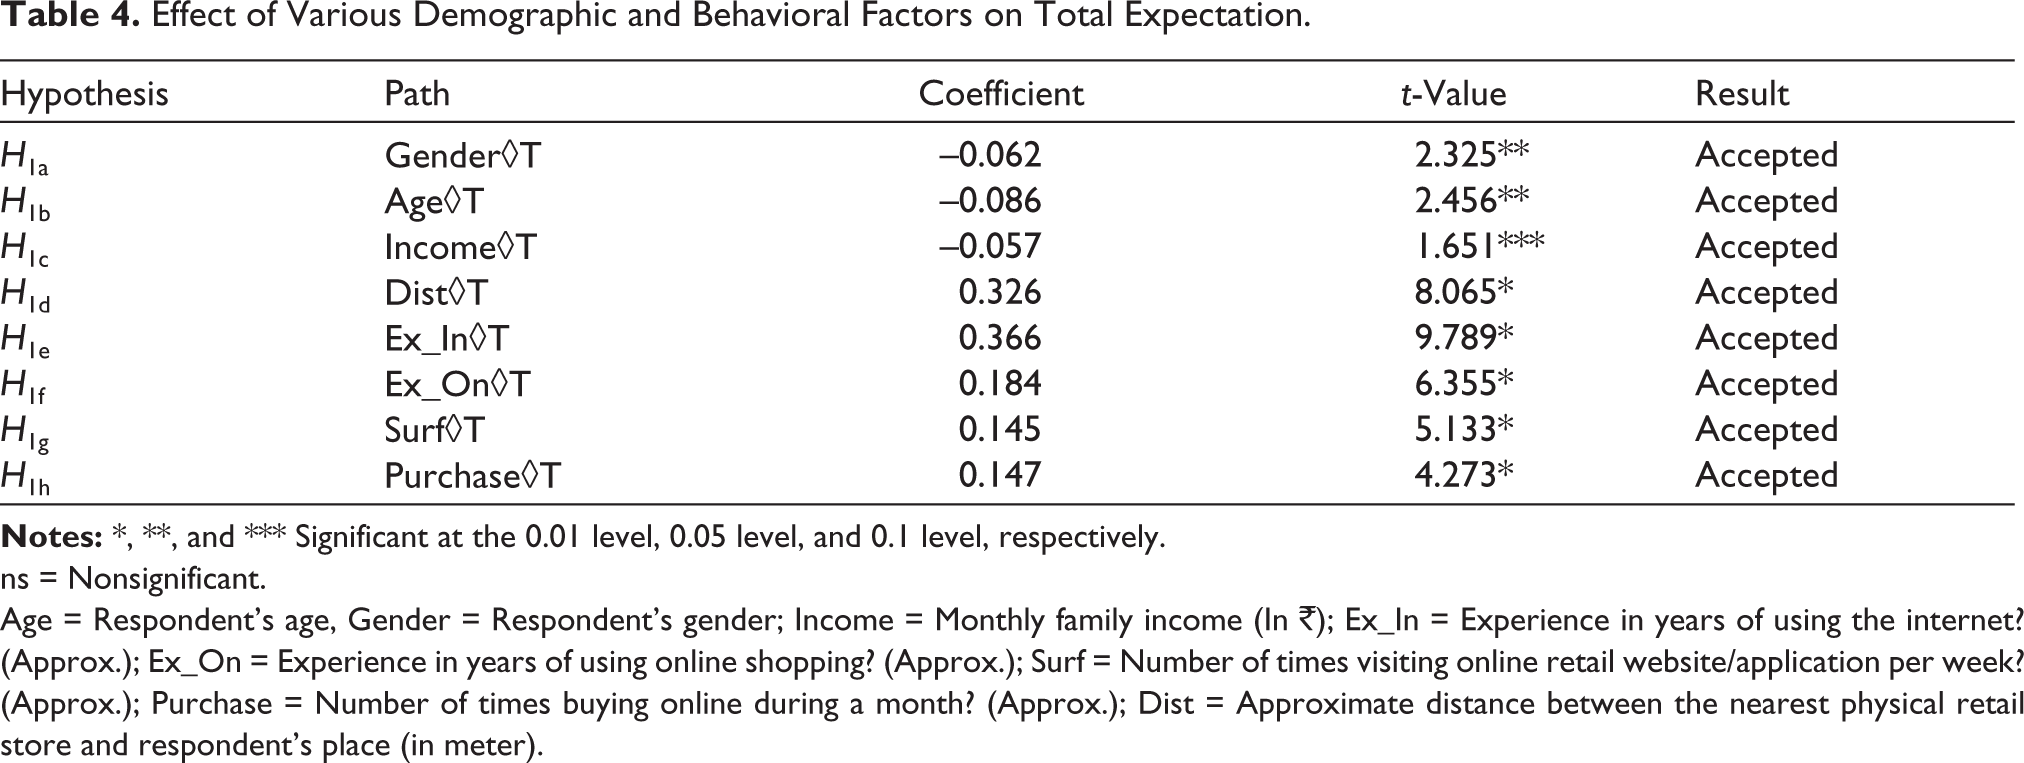
ns = Nonsignificant.
Age = Respondent’s age, Gender = Respondent’s gender; Income = Monthly family income (In ₹); Ex_In = Experience in years of using the internet? (Approx.); Ex_On = Experience in years of using online shopping? (Approx.); Surf = Number of times visiting online retail website/application per week? (Approx.); Purchase = Number of times buying online during a month? (Approx.); Dist = Approximate distance between the nearest physical retail store and respondent’s place (in meter).
Conclusions and Policy Implications
Overall expectations were divided into nine factors, that is, assurance/trust, efficiency, fulfillment/reliability, responsiveness, security/privacy, web-design, personalization, price aspects, and customer engagement. In past studies by Cristobal et al. (2007), Zehir et al. (2014), Zemblytė (2015), Jiang et al. (2016), Davari et al. (2016), Loonam and O’loughlin (2008), Chiang and Dholakia (2003), and Vivek et al. (2012), these factors are found to be necessary in their studies, respectively.
The e-expectation scale developed in this study will help marketers and retailers better understand the needs of the consumers. The scale is recommended to measure e-SQ expectations in an e-retail context. Knowing the consumer’s expectations would help the retailers in framing the e-marketing mix and strategies. The expectations scale can be used in policy formulation and web designing. This scale will also help in filling GAP 1 (expected service and management’s perceptions of consumer expectations) and GAP 5 (customer expectations and customer perceptions) of the SQ Gap model designed by Parasuraman et al. (1988). Web design was the most crucial factor, and personalization was the least important factor expected. The firms should keep this in their mind during budget allocation and policy formation, as investing in more important aspects will make the firm’s budgeting more efficient. Through this, the companies can focus more on the most crucial expectations and less on the least ones.
The researchers conducted a series of reviews to test the nomological validity of their theory and found consistent results across multiple studies, such as by Park and Gretzel (2007), Trocchia and Janda (2003), and Li and Suomi (2009). When we speak about demographic factors, males had more expectations than females. Garbarino and Strahilevitz (2004) had found a similar result in their study. With an increase in age and income, customer’s expectations from online retailers decrease. Results were similar to the study performed by Keng Kau et al. (2003). With the increase in distance from the physical retail outlet, customers’ expectations from online retail service increase. Results strengthened the findings of Ren and Kwan (2009). Consumers with more experience in internet usage and online retail usage had higher expectations. Results were similar to the findings of Jayawardhena et al. (2007) and contradictory to the conclusions from Barnes and Vidgen (2004). Consumers who surf and purchase more from online retailers also expect more. The results were very similar to the findings of Beldona et al. (2004). Low-income young males, with more internet and online retail experience and with a large distance from the physical retail stores, had higher expectations; this could help retail managers make more efficient grievance handling.
Future Scope of Research
The research was cross-sectional. In the future, the researchers suggest a cross-cultural and longitudinal study. The study was more quantitative. In the future, more qualitative study is recommended.
The scale is suggested to be tested with a different population, city, culture, region or country, product categories and retail formats, such as supermarkets, departmental stores, and unorganized kiryana (convenience) stores. This scale should also be replicated in other industries to check its external validity.
Studies exploring products or services independently and studies in the other online industry contexts, such as social networking, are suggested with more focus on mobile commerce as it is booming faster. E-retail site is a broad term, and it offers a huge variety of product categories. Therefore, researchers suggest performing future studies across a broad range of products, especially comparing high- and low-involvement products, high- or low-priced products, or search or credence products. Consumer behavior, expectations, perceptions, and satisfaction differ between durable and nondurable products, so separate studies are required, as also suggested by Churchill and Surprenant (1982).
Studies with more factors such as psychographic factors: personality traits, customer loyalty, aspects of pre- and post-purchase behavior, factors of impulsive buying, type of product, education of user, familiarity with e-commerce, self-efficacy, previous shopping experience, the effect of advertising, influence of certain factors such as festivals (Diwali and Rakshabandhan), and perceived risk should be considered. Hedonic aspects of expectations should also be involved in future studies. There happens to be a substantial difference between consumers and service providers (Hubbert et al., 1995); therefore, they should be studied separately, and comparative analysis can be formed in future research.
Footnotes
Declaration of Conflicting Interests
The authors declared no potential conflicts of interest with respect to the research, authorship, and/or publication of this article.
Funding
The authors received no financial support for the research, authorship, and/or publication of this article.