
Abstract
For marketers, the digital world offers a plethora of novel opportunities. Marketing in the modern day is all about relationships, involvement and relevancy. Digital marketing is the practice of marketers promoting goods and services through electronic media. The main objective of this study is to study the perception of customers towards digital marketing strategies implemented in the banking sector. Data were gathered from 535 banking customers by transmitting the questionnaire via Google Forms and handing out printed copies of the questionnaire. Results suggested that customers perceive digital marketing strategies as informative, interactive, entertaining and trustworthy but not offensive and personalised. Further, it was found that there is no significant difference among customers of different educational levels and occupations regarding customer perception towards digital marketing while a significant difference was found among customers based on age and income level. This analysis adds a great deal to the body of knowledge on marketing and has useful implications for marketing professionals as comprehending the perception of customers towards digital marketing may assist them in anticipating the usage of digital marketing.
Keywords
Introduction
Digital marketing emerged as a result of the WWW, social media’s growing popularity and the growing use of mobile phones by prospective consumers. In the 1990s, the phrase ‘digital marketing’ initially originated. ‘The introduction of the internet and the development of the Web 1.0 platform’ marked the beginning of the digital age. The first significant surge in digital marketing was predicted to have happened in 2006 when search engine traffic was expected to reach over 6.4 billion queries in a single month. Customers stopped being passive consumers and began to participate more actively with the introduction of Web 2.0. Web 2.0 can be used by people to communicate with companies and other users. Digitally marketed goods are now always accessible to buyers.
Utilising information technology to achieve marketing goals is the core of digital marketing. The term ‘digital’ refers to a technology with stable properties that are related to the flow of information. Consistent information is supplied continuously through digital technology. A marketing assignment is considered to be digital if it depends on a digital platform to carry out its marketing functions. Digital marketing is the aggregate of all those strategies that companies undertake to create and satisfy customers’ needs via digital channels. Digital marketing can also be referred to as ‘web marketing, online marketing, internet marketing and E-marketing’.
Customers are shifting to digital platforms at an increasing rate; the scope of digital marketing is also rising. Thus it is important to assess the perception of customers towards digital marketing. This study aims at achieving the following objective:
To study the perception of customers towards digital marketing strategies implemented in the banking sector.
This research article’s remaining sections are arranged as follows: The next section presents a thorough analysis of the body of literature and is followed by a section on the methodology of research. Afterwards, results and discussion are presented followed by the conclusion section.
Literature Review
Customer perception is defined as the mental states or the experiences that a customer believes they will have when utilising a good or service. Comprehending the customers’ perspective is crucial while using technology (Rahman et al., 2023). If marketers can comprehend the perception of the technology to be employed from the perspective of customers, it helps them anticipate the usage of technology. One such tool that is gaining popularity is digital marketing, which makes use of mass media outlets like radio, television and the internet (Painoli et al., 2021). Retailers who do not recognise and comprehend online customer perceptions towards digital marketing may lose their competitive edge and market share.
Digital marketing is the application of technology to support marketing campaigns and increase consumer awareness. Digital marketing enhances the online interactions between customers and retail stores. Retailers need to give their customers simple, helpful web interfaces that foster online relationships, enhance purchasing experiences and create repeat purchases (Khan & Siddiqui, 2013). By using digital marketing strategies, businesses may respond to pertinent customer feedback and better meet their demands (Mallik et al., 2022). In contrast, prospective customers can use feedback and suggestions to help them decide whether to use the service or purchase a good.
Methodology
This study used a quantitative, descriptive design where data were collected to assess customer perception towards digital marketing. The population of this study includes all those customers who engaged with banks through digital media. Retail customers of the leading eight banks (namely State Bank of India, HDFC, PNB, Bank of Baroda, ICICI, Canara Bank, Union Bank of India and Axis Bank) based on market share would be part of the population of this study. Data were gathered from banking customers by transmitting the questionnaire via the internet and handing out printed copies of the questionnaire. Data from banking customers with a variety of demographic profiles were obtained to make the study relevant and effective. This study included a total of 535 questionnaires that were correctly completed by participants. Before analysing the data, normality is tested with the help of skewness and kurtosis, and reliability of data is tested through Cronbach’s alpha. After that, descriptive analysis, t-test and analysis of variance (ANOVA) were employed to assess the perception of customers towards digital marketing employed in the banking sector.
Results and Discussion
Respondents’ Profile
The following depicts the demographic profiles of the respondents.
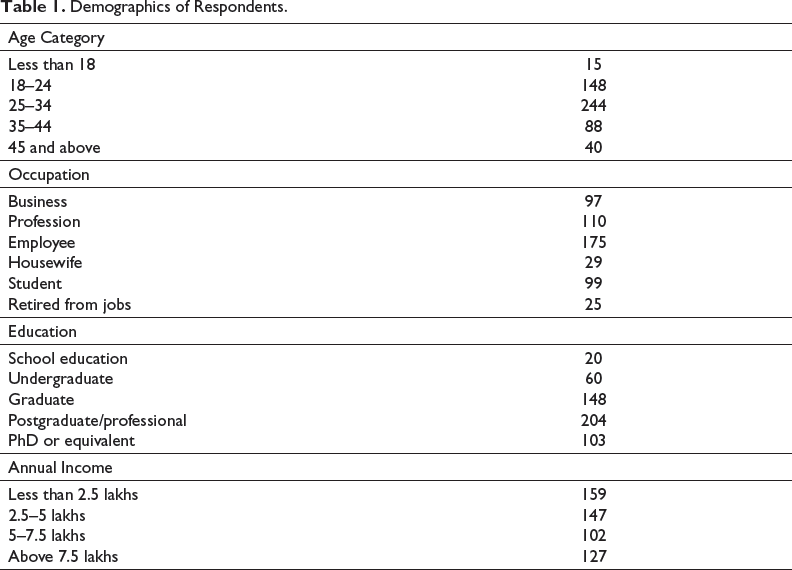
Table 1 depicts that a total of 535 participants who successfully completed the survey in which 45.6% of respondents are male and 54.4% of respondents are female; 40.93% of respondents are single and 59.06% of respondents are married; more than 32% of respondents belong to the Employee category followed by Profession (20.56%), Student (18.50%) and Business category (18.13%); more than 38% of respondents belong to the Postgraduate/professional category followed by Graduate (27.66%), PhD or equivalent (19.25%), and more than 76% of respondents are less than 34 years of age. The younger generation has a higher representation as compared to the older generation.
Demographics of Respondents.
Normality Testing
In order to perform further analysis to attain this objective, the assumption of normality of data should be satisfied. In the current research, descriptive statistics are utilised for measuring the value of skewness and kurtosis. Data are considered to be normally distributed if the value of both skewness and kurtosis is equal to zero (Graham & Field, 2008; Malhotra et al., 2017). However, in behavioural sciences, a skewness value between –1 and +1 and a kurtosis value between –1 and +1 are acceptable. The values of ‘skewness and kurtosis’ were noted to be within the acceptable range in the current research. Values are presented in Table 2.
Normality Testing.
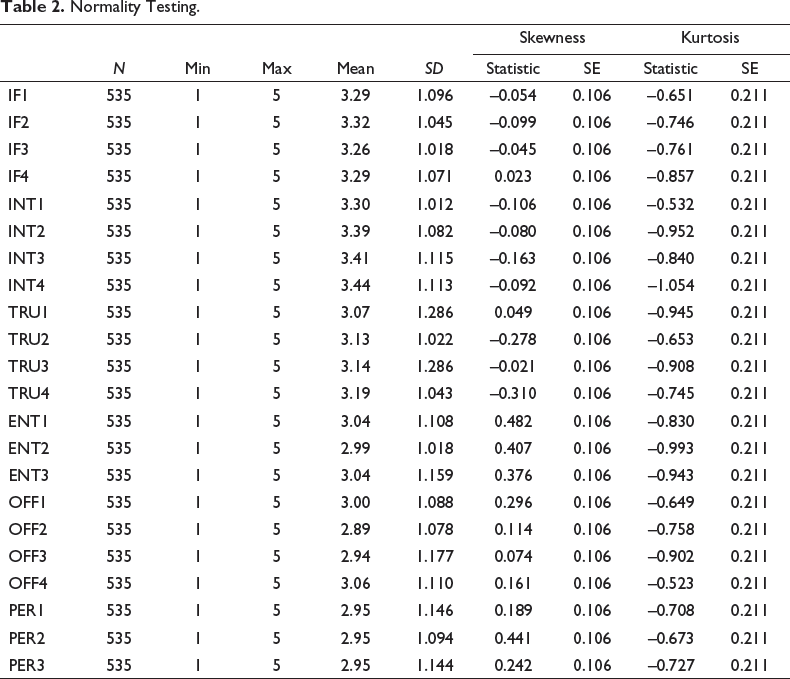
The skewness and kurtosis have been found to be less than 1 in Table 2, reflecting that the distribution is near to normal; hence the results drawn from the analysis can be generalised.
Reliability
A scale’s reliability is determined by how consistently findings from different measurements are obtained (Hair et al., 2011). According to Das et al. (2019), it denotes the extent to which a scale yields consistent results for the studied measures each time the study is carried out. Reliability is a measure of an instrument’s ability to produce reliable results that accurately reflect relevant data. Certain researchers have suggested that a scale’s dependability reveals bias-free scale (Sekaran, 2003). According to Kirk and Miller (1986), reliability is a reflection of the internal consistency of results and the stability of measurement. The capacity of an item in a construct to correlate with the other things in the same construct is known as internal consistency.
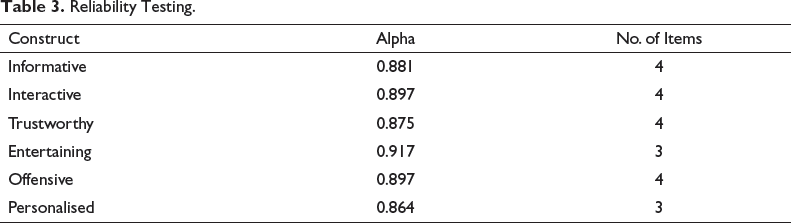
Cronbach’s alpha (Cronbach, 1951) is the method most frequently employed in empirical research to assess a scale’s internal consistency (Henson, 2001). A high Cronbach’s alpha score indicates a high degree of correlation between the scale items. According to previous studies, a Cronbach’s alpha score of larger than 0.70 is appropriate. In the current study, Cronbach’s alpha values above 0.70 were deemed acceptable in accordance with the recommendations of prior studies.
The Cronbach’s alpha of the constructs in Table 3 is found to be 0.88, which is more than the recommended minimum level of 0.7. As a result, it may be stated that there exists significant internal consistency reliability in these responses.
Reliability Testing.
Perception of Customers Towards Digital Marketing
Informative
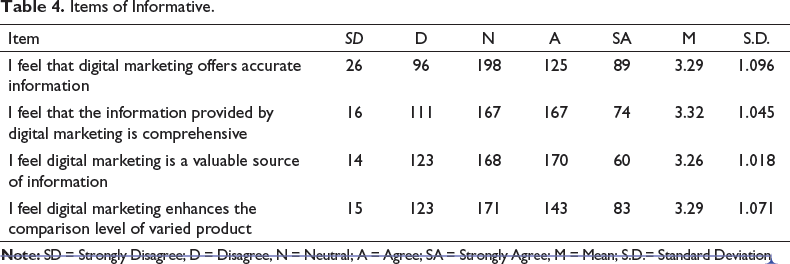
The descriptive statistics of various measurement items of Informative are presented in Table 4. In this table, the mean score for ‘I feel that the information provided by digital marketing is comprehensive’ has the highest mean score (3.32) followed by ‘I feel digital marketing enhances the comparison level of varied product’ and ‘I feel that digital marketing offers accurate information’ with a mean score of 3.29. The statement ‘I feel digital marketing is a valuable source of information’ has the lowest mean score (3.26). The mean score of all the items is above 3 reflecting that the majority of respondents agree with different Informative statements. The standard deviation of the responses has been found to be 1.018–1.096 reflecting that there is variation in responses received from different respondents.
Items of Informative.
Interactive
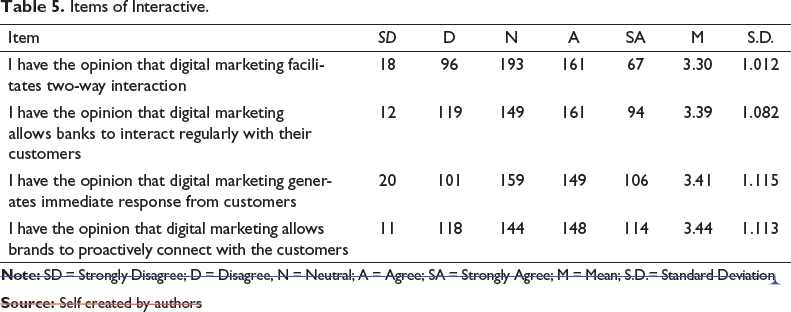
The descriptive statistics of various measurement items of Interactive are presented in Table 5. In this table, the mean score for ‘I have the opinion that digital marketing allows brands to proactively connect with the customers’ has the highest mean score (3.44) followed by ‘I have the opinion that digital marketing generates immediate response from customers’ and ‘I have the opinion that digital marketing allows banks to interact regularly with their customers’ with a mean score of 3.41 and 3.39. The statement ‘I have the opinion that digital marketing facilitates two way interaction’ has the lowest mean score (3.30). The mean score of all the items is above 3 reflecting that the majority of respondents agree with different Interactive statements. The standard deviation of the responses has been found to be 1.012–1.115 reflecting that there is variation in responses received from different respondents.
Items of Interactive.
Trustworthy
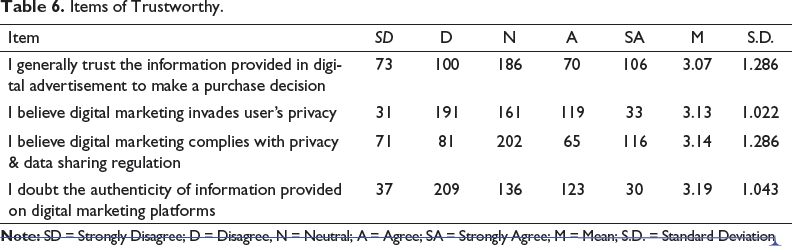
The descriptive statistics of various measurement items of Trustworthy are presented in Table 6. Respondents are inclined towards the agree side of statements ‘I generally trust the information provided in digital advertisement to make a purchase decision’ and ‘I believe digital marketing complies with privacy & data sharing regulation’ while the majority of the respondents disagreed with the statements ‘I believe digital marketing invades user’s privacy’ and ‘I doubt the authenticity of information provided on digital marketing platforms’. This indicates that the respondents found digital marketing trustworthy. The standard deviation of the responses has been found to be 1.022–1.286 reflecting that there is variation in responses received from different respondents.
Items of Trustworthy.
Entertaining
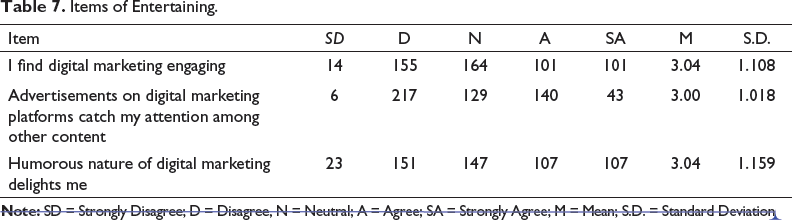
The descriptive statistics of various measurement items of Entertaining are presented in Table 7. In this table, the mean score for ‘I find digital marketing engaging’ and ‘Humorous nature of digital marketing delights me’ has the highest mean score (3.04). The statement ‘Advertisements on digital marketing platforms catch my attention among other content’ has the lowest mean score (3.00). The mean score of all the items is equal to above 3 reflecting that the majority of respondents agree with different interactive statements. The standard deviation of the responses has been found to be 1.018–1.159 reflecting that there is variation in responses received from different respondents.
Items of Entertaining.
Offensive
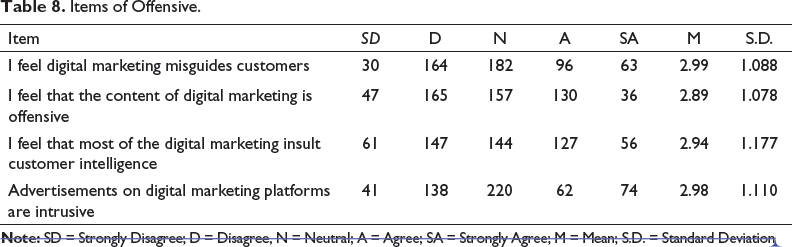
The descriptive statistics of various measurement items of Offensive are presented in Table 8. In this table, the mean score for ‘I feel digital marketing misguides customers’ has the highest mean score (2.99) followed by ‘Advertisements on digital marketing platforms are intrusive’ and ‘I feel that most of the digital marketing insult customer intelligence’ with a mean score of 2.98 and 2.94. The statement ‘I feel that the content of digital marketing is offensive’ has the lowest mean score (2.89). The mean score of all the items is below 3 reflecting that the majority of respondents disagree with different Offensive statements. The standard deviation of the responses has been found to be 1.078–1.177 reflecting that there is variation in responses received from different respondents.
Items of Offensive.
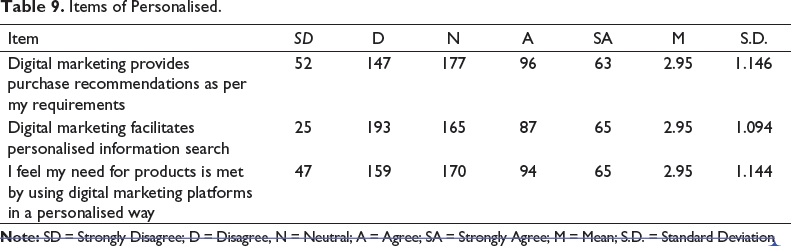
Personalised
The descriptive statistics of various measurement items of Personalised are presented in Table 9. The mean score of all the items is below 3 reflecting that the majority of respondents disagree with different personalised statements. The standard deviation of the responses has been found to be 1.094–1.146 reflecting that there is variation in responses received from different respondents.
Items of Personalised.
Income Group
One-way ANOVA has been used to test if there is any significant difference among customers based on income with respect to perception regarding digital marketing strategies. The concept of variance lies at the core of the ANOVA. The fundamental process involves extracting two distinct population variance estimates from the data and using the ratio of these estimates to compute statistics (between group and within group variance). A significant F value indicates that population means are unequal.
The hypotheses based on the income are tested for each dimension of perception, namely Informative, Interactive, Trustworthy, Entertaining, Offensive and Personalised. For this analysis, respondents have been divided into four groups based on their income. The researcher posed six sub-hypotheses to check the differences among various income groups.
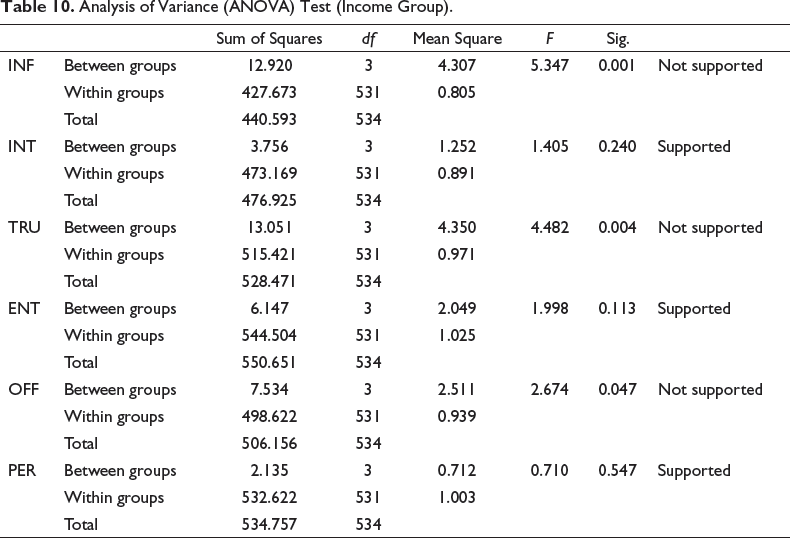
Table 10 shows the result of one-way ANOVA which has been used to check significant differences among customers across different income groups. In the case of Informative, the ‘F value’ is 5.347 and ‘the p value’ is .001 which is less than 0.05 reflecting there is a ‘significant variation’ among the respondents. In the case of Interactive, the ‘F value’ is 1.405 and the ‘p value’ is .20 which is higher than 0.05 reflecting there is ‘no significant variation’ among the respondents. In the case of Trustworthy, the ‘F value’ is 4.482 and the ‘p value’ is .004 which is under 0.05 reflecting there is a ‘significant variation’ among the respondents. In the case of Entertaining, the ‘F value’ is 1.998 and the ‘p value’ is .113 which is higher than 0.05 reflecting there is ‘no significant variation’ among the respondents. In the case of Offensive, the ‘F value’ is 2.674 and ‘the p value’ is .047 which is under 0.05 reflecting there is a ‘significant variation’ among the respondents. In the case of Personalised, the ‘F value’ is 0.710 and ‘the p value’ is .547 which is higher than 0.05 reflecting there is ‘no significant variation’ among the respondents of different income groups.
Analysis of Variance (ANOVA) Test (Income Group).
Educational Qualification
One-way ANOVA has been used to test if there is any significant difference among customers based on education level with respect to perception regarding digital marketing strategies. The concept of variance lies at the core of the ANOVA. The fundamental process involves extracting two distinct population variance estimates from the data and using the ratio of these estimates to compute statistics (between group and within group variance). A significant F value indicates that population means are unequal.
The hypotheses based on the income are tested for each dimension of perception, namely Informative, Interactive, Trustworthy, Entertaining, Offensive and Personalised. For this analysis, respondents have been divided into five groups based on their education. The researcher posed six sub-hypotheses to check the differences among various education level groups.
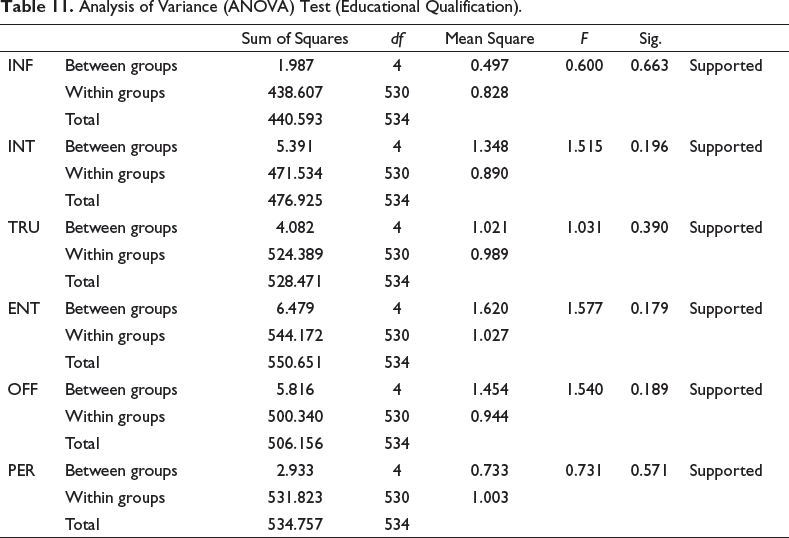
Table 11 shows the result of one-way ANOVA which has been used to check significant differences among customers across different income groups. In the case of Informative, the ‘F value’ is 0.600 and ‘the p value’ is .663 which is higher than 0.05 reflecting there is ‘no significant variation’ among the respondents of different education levels. In the case of Interactive, the ‘F value’ is 1.515 and the ‘p value’ is .196 which is higher than 0.05 reflecting there is ‘no significant variation’ among the respondents of different education levels. In the case of Trustworthy, the ‘F value’ is 1.031 and ‘the p value’ is .390 which is higher than 0.05 reflecting there is ‘no significant variation’ among the respondents of different education levels. In the case of Entertaining, ‘the F value’ is 1.577 and ‘the p value’ is .179 which is higher than 0.05 reflecting there is ‘no significant variation’ among the respondents of different education levels. In the case of Offensive, the ‘F value’ is 1.540 and ‘the p value’ is .189 which is higher than 0.05 reflecting there is ‘no significant variation’ among the respondents of different education levels. In the case of Personalised, the ‘F value’ is 0.731 and ‘the p value’ is .571 which is higher than 0.05 reflecting there is ‘no significant variation’ among the respondents of different education levels.
Analysis of Variance (ANOVA) Test (Educational Qualification).
Occupation
One-way ANOVA has been used to test if there is any significant difference among customers based on occupation with respect to perception regarding digital marketing strategies. The concept of variance lies at the core of the ANOVA. The fundamental process involves extracting two distinct population variance estimates from the data and using the ratio of these estimates to compute statistics (between group and within group variance). A significant F value indicates that population means are unequal.
The hypotheses based on the occupation are tested for each dimension of perception, namely Informative, Interactive, Trustworthy, Entertaining, Offensive and Personalised. For this analysis, respondents have been divided into six groups based on their occupation. The researcher posed six sub-hypotheses to check the differences among various occupational groups.
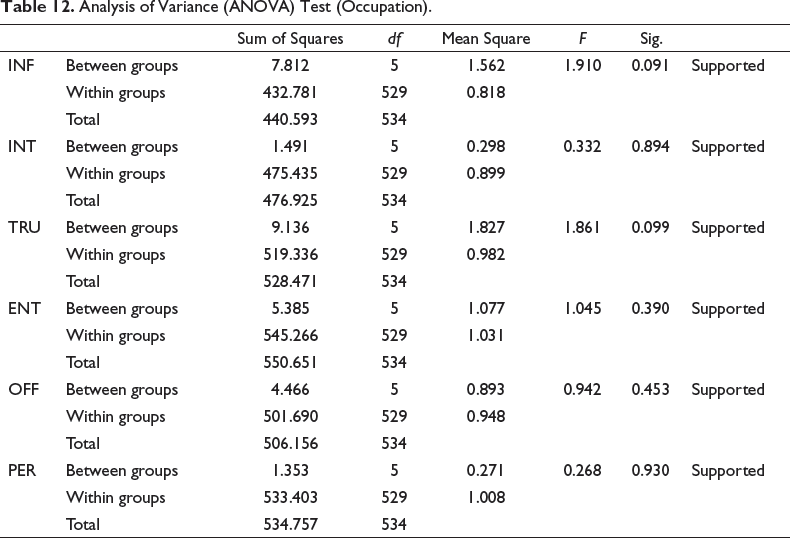
Table 12 shows the result of one-way ANOVA which has been used to check significant differences among customers across different occupational groups. In the case of Informative, the ‘F value’ is 0.910 and the ‘p value’ is .091 which is higher than 0.05 reflecting ‘there is no significant variation’ among the respondents of different occupations. In the case of Interactive, ‘the F value’ is 0.332 and ‘the p value’ is .894 which is higher than 0.05 reflecting ‘there is no significant variation’ among the respondents of different occupations. In the case of Trustworthy, ‘the F value’ is 1.861 and ‘the p value’ is .099 which is higher than 0.05 reflecting ‘there is no significant variation’ among the respondents of different occupations. In the case of Entertaining, ‘the F value’ is 1.045 and ‘the p value’ is .390 which is higher than 0.05 reflecting ‘there is no significant variation’ among the respondents of different occupations. In the case of Offensive, ‘the F value’ is 0.942 and ‘the p value’ is .453 which is higher than 0.05 reflecting ‘there is no significant variation’ among the respondents of different occupations. In the case of Personalised, ‘the F value’ is 0.268 and ‘the p value’ is .930 which is higher than 0.05 reflecting ‘there is no significant variation’ among the respondents of different occupations.
Analysis of Variance (ANOVA) Test (Occupation).
Age
One-way ANOVA has been used to test if there is any significant difference among customers based on age with respect to perception regarding digital marketing strategies. The concept of variance lies at the core of the ANOVA. The fundamental process involves extracting two distinct population variance estimates from the data and using the ratio of these estimates to compute statistics (between group and within group variance). A significant F value indicates that population means are unequal.
The hypotheses based on age are tested for each dimension of perception, namely Informative, Interactive, Trustworthy, Entertaining, Offensive and Personalised. For this analysis, respondents have been divided into five groups based on their age. The researcher posed six sub-hypotheses to check the differences among various age groups.
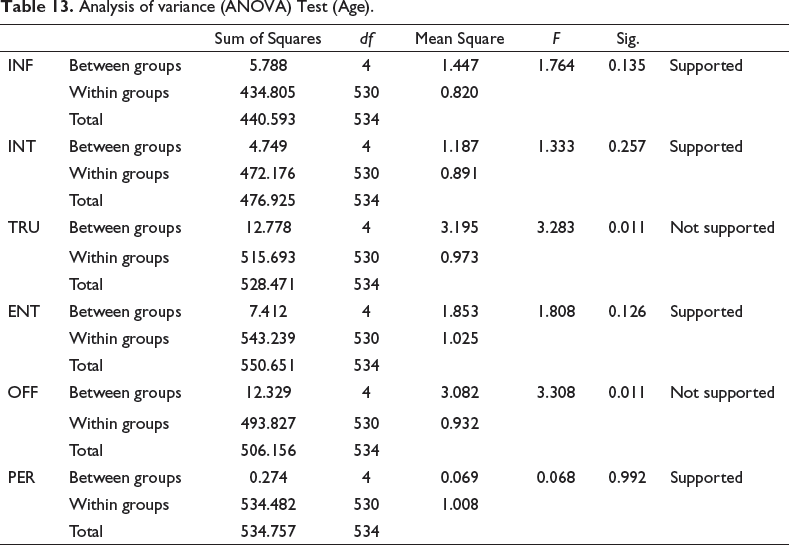
Table 13 shows the result of one-way ANOVA which has been used to check significant differences among customers across different age groups. In the case of Informative, ‘the F value’ is 1.764 and ‘the p value’ is .135 which is higher than 0.05 reflecting ‘there is no significant variation’ among the respondents of different age groups. In the case of Interactive, ‘the F value’ is 1.333 and ‘the p value’ is .257 which is higher than 0.05 reflecting ‘there is no significant variation’ among the respondents of different age groups. In the case of Trustworthy, ‘the F value’ is 3.283 and ‘the p value’ is .011 which is under 0.05 reflecting ‘there is a significant variation’ among the respondents of different age groups. In the case of Entertaining, ‘the F value’ is 1.808 and ‘the p value’ is .126 which is higher than 0.05 reflecting ‘there is no significant variation’ among the respondents of different age groups. In the case of Offensive, ‘the F value’ is 3.308 and ‘the p value’ is .011 which is under 0.05 reflecting ‘there is a significant variation’ among the respondents of different age groups. In the case of Personalised, ‘the F value’ is 0.068 and ‘the p value’ is .992 which is higher than 0.05 reflecting ‘there is no significant variation’ among the respondents of different age groups.
Analysis of variance (ANOVA) Test (Age).
Conclusion
The main objective of this study is to understand the perception of banking customers towards digital marketing. To achieve this objective, data were gathered from 535 banking customers by transmitting the questionnaire online and offline. Results suggested that customers perceive digital marketing strategies as informative, interactive, entertaining and trustworthy but not offensive and personalised. Further, it was found that there is no significant difference among customers of different educational levels and occupations regarding customer perception towards digital marketing while a significant difference was found among customers based on age and income level.
The nature of the current research is time-bound. Future changes are anticipated to occur in technology, technological adoptions, human mindsets and behaviour, all of which are dynamic in nature. Furthermore, the study’s scope is limited to the banking industry within financial institutions. It is imperative that the various categories of financial organisations be studied. Better results and recommendations in the financial sector may come from the inclusion of a variety of financial institution types. Furthermore, the thoughts and experiences of the respondents form the basis of this empirical study. It is impossible to totally rule out the chance of consumer bias.
Besides these drawbacks, this study has useful implications for marketing professionals as comprehending the perception of customers towards digital marketing may assist them in anticipating the usage of digital marketing. In addition, the current research demonstrates that perceptual differences exist across different demographics towards digital marketing practices. Thus, practitioners can modify their strategies as per their target customers. Furthermore, this analysis adds a great deal to the body of knowledge on digital marketing.
Footnotes
Declaration of Conflicting Interests
The authors declared no potential conflicts of interest with respect to the research, authorship and/or publication of this article.
Funding
The authors received no financial support for the research, authorship and/or publication of this article.