
Abstract
Despite the numerous contributions assessing the efficiency and effectiveness of Cohesion Policies, their role in stimulating growth and cohesion in different macroeconomic settings and in different business cycle periods remains highly debated. This article aims at contributing to this literature by investigating the link between Cohesion Policy, economic growth and interregional inequalities over periods of crisis and recovery. In particular, the article analyses whether Cohesion Policy is beneficial for the recovery of those regions mostly hit by the crisis and contributes to narrowing interregional gaps enhanced by the crisis. In addition, the paper analyses how the link between Cohesion Policy and interregional inequalities changes by investment axes, as it is the case of Research, Technology Development and Innovation funds, targeted to different goals. Based on an analysis covering all EU27 and UK NUTS2 regions in the period 2008–2019, the article confirms the multifaceted nexus between Cohesion Policy and interregional inequalities. It also raises warnings about the potential conflicts between its overarching goals and its multiple and expanding strategic objectives.
Introduction
Cohesion Policy stands as a fundamental cornerstone of past and current European investment policy, designed to address spatial inequalities and ensure territorial, social and economic cohesion among European regions. Over time, the increasing amount of funds allocated to this policy (almost a third of the EU budget in the programming period 2021–2027) has turned into one of the main instruments available to regions for sustaining their growth endeavours. Understanding the effects of Cohesion Policy is therefore a primary yet complex task, given its multiple territorial scales, its multi-level governance, and the multiple rationales it pursues (Dąbrowski et al., 2014; Iacobucci, 2021). This complexity has spurred a lively scientific debate which has assessed multiple aspects of Cohesion Policy, in parallel and synergy with the ex-post evaluation activities carried out at the EU, Member States and subnational levels. 1 Primarily, scholars have examined the impacts of Cohesion Policy on economic growth (Pellegrini et al., 2013) and regional convergence (Bourdin, 2019; Ramajo et al., 2008), also within clubs of regions (Cutrini, 2023; Cutrini and Mendez, 2023). While there is a moderate consensus on the positive impact of Cohesion Policy (Dall’Erba and Fang, 2017; Fidrmuc et al., 2024), several studies have underscored the variation of the effectiveness of Cohesion Policy depending on local endogenous conditions (Bachtrögler et al., 2020; Crescenzi et al., 2020; Crescenzi and Giua, 2020). These factors include the quality of governance (Rodríguez-Pose and Garcilazo, 2015), the presence of good institutions (Barbero et al., 2023), human capital (Becker et al., 2013) and territorial capital (Bachtrögler et al., 2020).
Despite the numerous contributions, the role of Cohesion Policy in different macroeconomic settings and over business cycles remains a promising and open area of research (Mazzola and Pizzuto, 2020), especially given the strong rationale and case for Cohesion Policy to mitigate the negative and spatially asymmetric effects of economic crises and, by supporting structural interventions, to facilitate recovery (Di Caro and Fratesi, 2022) and to mitigate the interregional inequalities enhanced by the downturn.
First, several studies have highlighted the impact of Cohesion Policy on post-crisis economic recovery (Arbolino et al., 2020), but relatively fewer of them have examined its role in reducing interregional inequalities generated by the crisis, with early evidence suggesting some positive effects on convergence within groups of regions but divergence across them (Furceri et al., 2021; Mazzola and Pizzuto, 2020).
Second, some of the investment axes of Cohesion Policy have been proved to deliver contrasting effects on regional growth and convergence (Rodríguez-Pose and Fratesi, 2004), leaving still unset whether and how different investment axes can operate in different macroeconomic settings and over business cycles. This contrast is especially relevant in the case of innovation funds. Despite the uncontroversial importance of technological change for regional growth, potential conflicts between the specific measures implemented in the frame of the innovation investment axis and the overarching cohesion objective may arise. In fact, innovation naturally tends to concentrate in wealthier regions; once directed towards disadvantaged regions, it may generate limited economic returns compared to those obtained in advanced areas, with partial, if no, effects on interregional inequalities (Camagni et al., 2023; Capello and Lenzi, 2015; Celli et al., 2021; Hoekman et al., 2013; McCann and Ortega-Argilés, 2015). Moreover, the crisis aftermath was characterized by a widening of gaps in terms of national, regional and firm innovation performances (Archibugi et al., 2013; Archibugi and Filippetti, 2011; Delgado et al., 2024; Izsak and Radošević, 2017).
Third, the literature has highlighted the role of regional heterogeneity (e.g. in terms of sectoral structure) for resilience to shocks (Grabner and Modica, 2022; Martin et al., 2016; Pontarollo and Serpieri, 2020, 2021), and the role of Cohesion Policy for boosting regional resilience (Arbolino et al., 2020; Crescenzi et al., 2021). However, less is known about how the link between Cohesion Policy and inequalities is affected by the regional resilience to shocks. Such an interplay, in fact, could potentially explain some of the nuances uncovered in regional recovery outcomes and the consequent narrowing of interregional gaps produced by the crisis.
This article, thus, aims at providing a contribution in these directions by introducing two novel insights. First, the article explores whether Cohesion Policy as a whole, and its innovation investment axis in particular, also have a cyclical nature, which would further support their strategic relevance and use across different business cycles. In fact, Cohesion Policy can support regional resilience and after-shock recovery directly and indirectly through demand multiplier effects (Neumark and Simpson, 2014).
Second, consistent with their prevalent long-term orientation, Cohesion Policy funds are primarily used for public structural investments and expenditures in the most disadvantaged regions. Accordingly, the article analyses whether Cohesion Policy and its innovation investment axis are particularly beneficial for the recovery of regions hit the most by the crisis, defined in the article as vulnerable regions, thus contributing to narrowing interregional gaps enhanced by the crisis. By this effort, the article not only adds to the scientific debate on Cohesion Policy but also informs EU ex-post evaluation analyses, which, especially in the case of RTDI (Research and Technological Development and Innovation), investments are frequently based on single Member States quali-quantitative case studies. 2
The rest of the article is structured as follows. ‘Literature background: the heterogeneous link between Cohesion Policy, regional growth and interregional inequalities’ section provides the literature background; ‘Data and econometric setting’ section presents the data used and the econometric approach adopted. Results are presented in ‘The nexus netween Cohesion Policy, regional growth and inequalities: empirical evidence’ section, while the final section summarizes the main conclusions along with some policy reflections.
Literature background: the heterogeneous link between Cohesion Policy, regional growth and interregional inequalities
The effects of Cohesion Policy on regional growth and interregional inequalities have been widely discussed in the literature, even if results have proved to be subject to large variations (Berkowitz et al., 2020; Fiaschi et al., 2018; Fidrmuc et al., 2024). The variety of results obtained can be attributed to the diversity of the settings being analyzed in terms of geographic and temporal coverage as much as of the methodological choices being applied (Dall’Erba and Fang, 2017). In particular, the latter include both more traditional spatial and non-spatial regression models, generally designed in a beta-convergence framework (Bourdin, 2019; Fiaschi et al., 2018; Fidrmuc et al., 2024), and quasi-experimental techniques (Becker et al., 2018; Crescenzi and Giua, 2020; Pellegrini et al., 2013), aimed to uncover the causal relationship between Cohesion Policy expenditures and economic growth, either through the utilization of microdata (Crescenzi et al., 2020) or by leveraging the existence of different groups of regions, eligible for different investment objectives (Becker et al., 2010; Pellegrini et al., 2013).
The majority of studies point to the existence of some positive effects and a narrowing of interregional inequalities, even if subject to regional endogenous characteristics (Bourdin, 2019; Crescenzi and Giua, 2020; Di Caro and Fratesi, 2022; Pellegrini et al., 2013) not only in advanced areas but also in lagging ones (Gagliardi and Percoco, 2017). In particular, the quality of local institutions and the abundance of local human and territorial capital have been proved to mediate the impact of Cohesion Policy making its effects heterogeneous across EU regions (Bachtrögler et al., 2020; Becker et al., 2013; Rodríguez-Pose and Garcilazo, 2015; Coppola et al., 2024; Pošta, 2023).
Differently, less attention has been devoted to understanding how Cohesion Policy funds operate in relation to specific exogenous and adverse macroeconomic conditions. On the one hand, there is increasing evidence about the severe and spatially asymmetric impact of the Great Recession and, more recently, the COVID-19 pandemic on European countries and regions, challenging the process of territorial integration, regional convergence and the cohesion efforts (Kapitsinis and Gialis, 2023; Mazzola and Pizzuto, 2020). On the other, macroeconomic policies have been proved to affect, through the impact on specific local assets, the process of (unequal) long-run regional growth as well as short-run resilience to economic shocks (Agnello et al., 2016; Furceri et al., 2021). In times of crisis, therefore, Cohesion Policy may appear at first glance less compelling and appropriate with respect to short-term, fiscal and monetary policies, a view much diffused among Cohesion Policy detractors, highlighting its limited effects and questioning its nature and implementation, if not its existence (Bachtler and Mendez, 2020). Yet, Cohesion Policy may remain of great importance to boost regional resilience in possible disruptive contexts (Crescenzi et al., 2021), together with other regional-level factors like industrial structure (e.g. Grabner and Modica, 2022) and technology networks (Tóth et al., 2022) as much as to sustain regional economies even in the short run through several demand-side channels (Psycharis et al., 2020). Moreover, by (partially) adapting the use of Cohesion Policy funds in terms of objectives to be pursued and co-financing with other policy measures, it can help rebalancing the spatially asymmetric effects of shocks and the divergence pressure among EU countries and regions, thus limiting the risk of having decades of enlargement, convergence and reduction of interregional inequalities being jeopardized (Camagni and Capello, 2015). Some evidence in fact seems to suggest that Cohesion Policy spending has boosted regional resilience, although with region- and crisis-specific patterns during different shocks (Di Caro and Fratesi, 2022) and has contributed to reducing intranational inequalities in the aftermath of the 2007/8 financial crisis (Furceri et al., 2019). Importantly, the very long-term and structural nature and implementation logic of Cohesion Policy can reduce flexibility to cyclical needs and short-term responses and adaptation to shocks. Yet, by favouring structural interventions in the most disadvantaged regions, Cohesion Policy can fuel enduring effects that may facilitate recovery in post-crisis periods, especially for those vulnerable regions particularly hit by adverse shocks.
If endogenous and exogenous factors, as much as the heterogeneous vulnerability and reactions of regions to macroeconomic shocks make the growth and inequalities effects of Cohesion Policy funds challenging to disentangle, additional complexity can be attributed also to the multifaceted, dynamic and evolving nature of Cohesion Policy (Calegari et al., 2023; Ferrara et al., 2017; Rodríguez-Pose and Fratesi, 2004). In fact, Cohesion Policy has undergone several reform phases to align its action with the new strategic objectives of the EU, which primarily include enhancing competitiveness, supporting research and innovation, and promoting employment (Bachtler and Mendez, 2020; Brunazzo, 2016; Crescenzi and Giua, 2020). Starting with the Lisbon Strategy, the European Union has set the explicit objective of building ‘the most competitive and dynamic knowledge-based economy’ able to compete with the United States and emerging Asian competitors.
As a consequence, funding allocation dedicated to achieving these objectives has progressively increased not only in the frame of the EU budget but also in the frame of Cohesion Policy. Notably, the share of Cohesion Policy funds allocated to RTDI doubled from the period 2000–2006 to the period 2007–2013, rising from 5% to 11% (European Commission, 2011). 3 However, the growing interest in RTDI, emerged in response to the new policy targets set at the EU level and to the uncontroversial role played by technological change for economic growth, underscores the need to harmonize the objectives of promoting innovation as the main tool to deliver economic and productivity growth, with those of convergence and mitigation of regional inequalities (Archibugi and Filippetti, 2011; Celli et al., 2021; Delgado et al., 2024; Ferrara et al., 2017; Izsak and Radošević, 2017). Notwithstanding, achieving this balance presents considerable challenges.
First, advancing cohesion necessitates channelling resources into disadvantaged regions, which may require fundamental investments in basic infrastructure (Iammarino et al., 2019). On the other hand, innovation and advanced research tend to organically cluster in more affluent and technologically advanced areas. These regions often enjoy a robust innovation environment, making the attraction and effective utilization of RTDI funding more feasible (Capello and Lenzi, 2015; Celli et al., 2021). Consequently, there exists an inherent tension between directing Cohesion Policy resources towards disadvantaged regions and nurturing innovation, which tends to naturally concentrate in wealthier regions (Hoekman et al., 2013; McCann and Ortega-Argilés, 2015).
Second, less developed regions may confront deficiencies in critical areas such as infrastructure, research institutions and a skilled workforce, which can hinder their ability to absorb and leverage RTDI funding effectively. This limitation, in turn, diminishes the potential impact of these funds on economic growth and regional convergence (Celli et al., 2021; Liagouras, 2010). Moreover, in such instances, evaluating the impact of RTDI investments in terms of regional development and inequalities may necessitate a more extended timeframe, given the complexity of these transformative processes (D’Adda et al., 2022; McCann and Ortega-Argilés, 2015). These challenges have been amplified by the crisis, which has impaired the convergence in innovation performances in Europe, its regions and firms (Archibugi et al., 2013, 2020; Archibugi and Filippetti, 2011; Capello and Dellisanti, 2024; Delgado et al., 2024; Izsak and Radošević, 2017).
The empirical analyses presented in this article have, therefore, the goal of shedding light on the link between Cohesion Policy, regional economic growth and inequalities in the presence of an asymmetric shock, that is, the Great Recession, and to highlight how Cohesion Policy has operated with regard to the recovery of the most vulnerable regions, that is, highly disadvantaged by the crisis. Furthermore, by unpacking Cohesion Policy into its specific investment axes, the article aims at highlighting the operation of Cohesion Policy in general and RTDI funds to mitigate interregional inequalities enhanced by the crisis.
Data and econometric setting
The definition of asymmetric shocks and vulnerable regions
The specific shock examined in this article is the one triggered by the 2007–2008 financial crisis, next propagated into the 2011 European Debt crisis. The two crises had a combined and enduring effect on the European labour markets (Capello et al., 2015, Table 1), thus allowing to treat them as a single crisis in the present context, with 2008 as the initial year and 2013 as its concluding one.
Employment growth rate of EU-27 + UK employment.
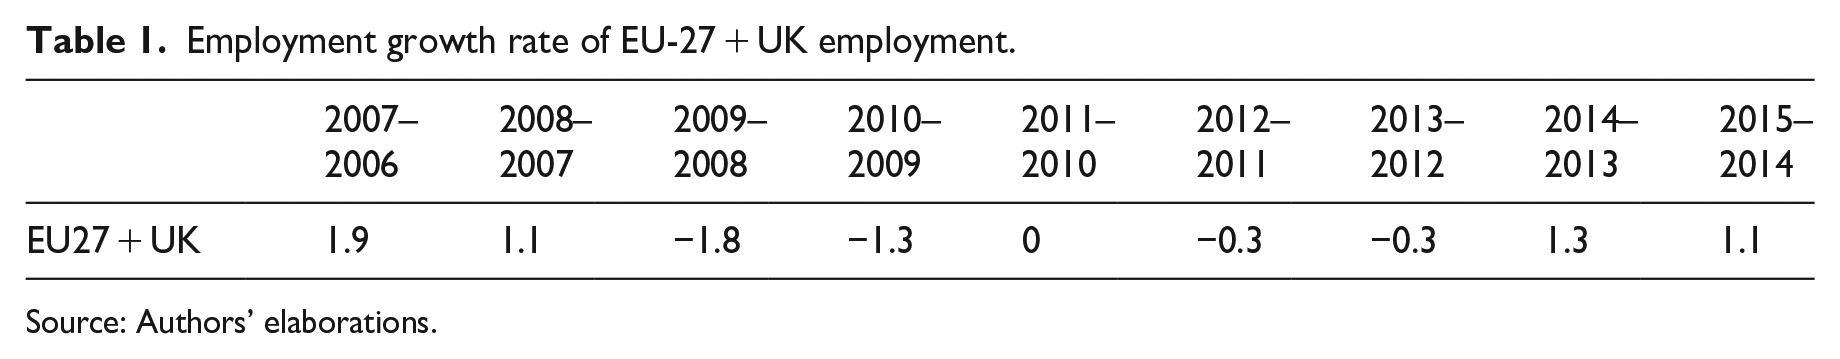
Source: Authors’ elaborations.
Acknowledging the spatially asymmetric nature of shocks (Di Caro and Fratesi, 2022), regions at higher risk of experiencing negative impacts and adverse consequences on regional employment as the result of both the financial crisis (2008) and the European Debt crisis (2011) were identified as vulnerable ones. The focus on employment outcomes is consistent with existing studies in the resilience literature looking at employment variations in response to shocks and crises (Arbolino et al., 2020; Di Caro and Fratesi, 2022; Pontarollo and Serpieri, 2020, 2021). The degree of regional vulnerability reflects the regional specialization in the sectors that in Europe were particularly hit by the crisis in the period 2008–2013, that is, vulnerable sectors. As defined, vulnerable regions are not necessarily the most fragile or less developed; rather, they are those most exposed to the economic crises that have afflicted Europe. Vulnerability in this context reflects the sectoral exposure to exogenous shocks (Grabner and Modica, 2022). Importantly, by construction, the vulnerability index balances the EU-wide and the region-specific (and not just country-specific) dimensions of the financial and debt crises. The former element is captured through the identification of vulnerable sectors at the EU level, while the latter through the regional exposure to such crises depending on each region intensity of specialization in vulnerable sectors.
The operationalization of this concept involved the following steps. First, vulnerable sectors were identified as those with a negative employment compound growth rate (CGR) in the 2008–2013 period at the European level (EU27 + UK), excluding those experiencing a contraction of employment in 2003–2008 greater than the one in 2008–2011 (Table 2). 4 The identification of vulnerable sectors was conducted at the European level to mitigate potential impacts from national labour policies. 5 At the regional level, vulnerability is identified as specialization in vulnerable sectors. Specifically, the regional specialization in vulnerable sectoral was measured by means of location quotients with respect to the EU27 + UK average, using pre-crisis (2008) employment data from Eurostat’s Regional Economic Accounts. Data on employment was obtained from the Eurostat Regional Account database and integrated with information coming from the Structural Business Statistics to disaggregate the G-H-I aggregation into 1-digit codes. 6 Finally, the degree of regional vulnerability was calculated as the share of regional employment in vulnerable sectors of specialization in 2008 (Figure 1).
Vulnerable sectors at the European level (EU-27 + UK).
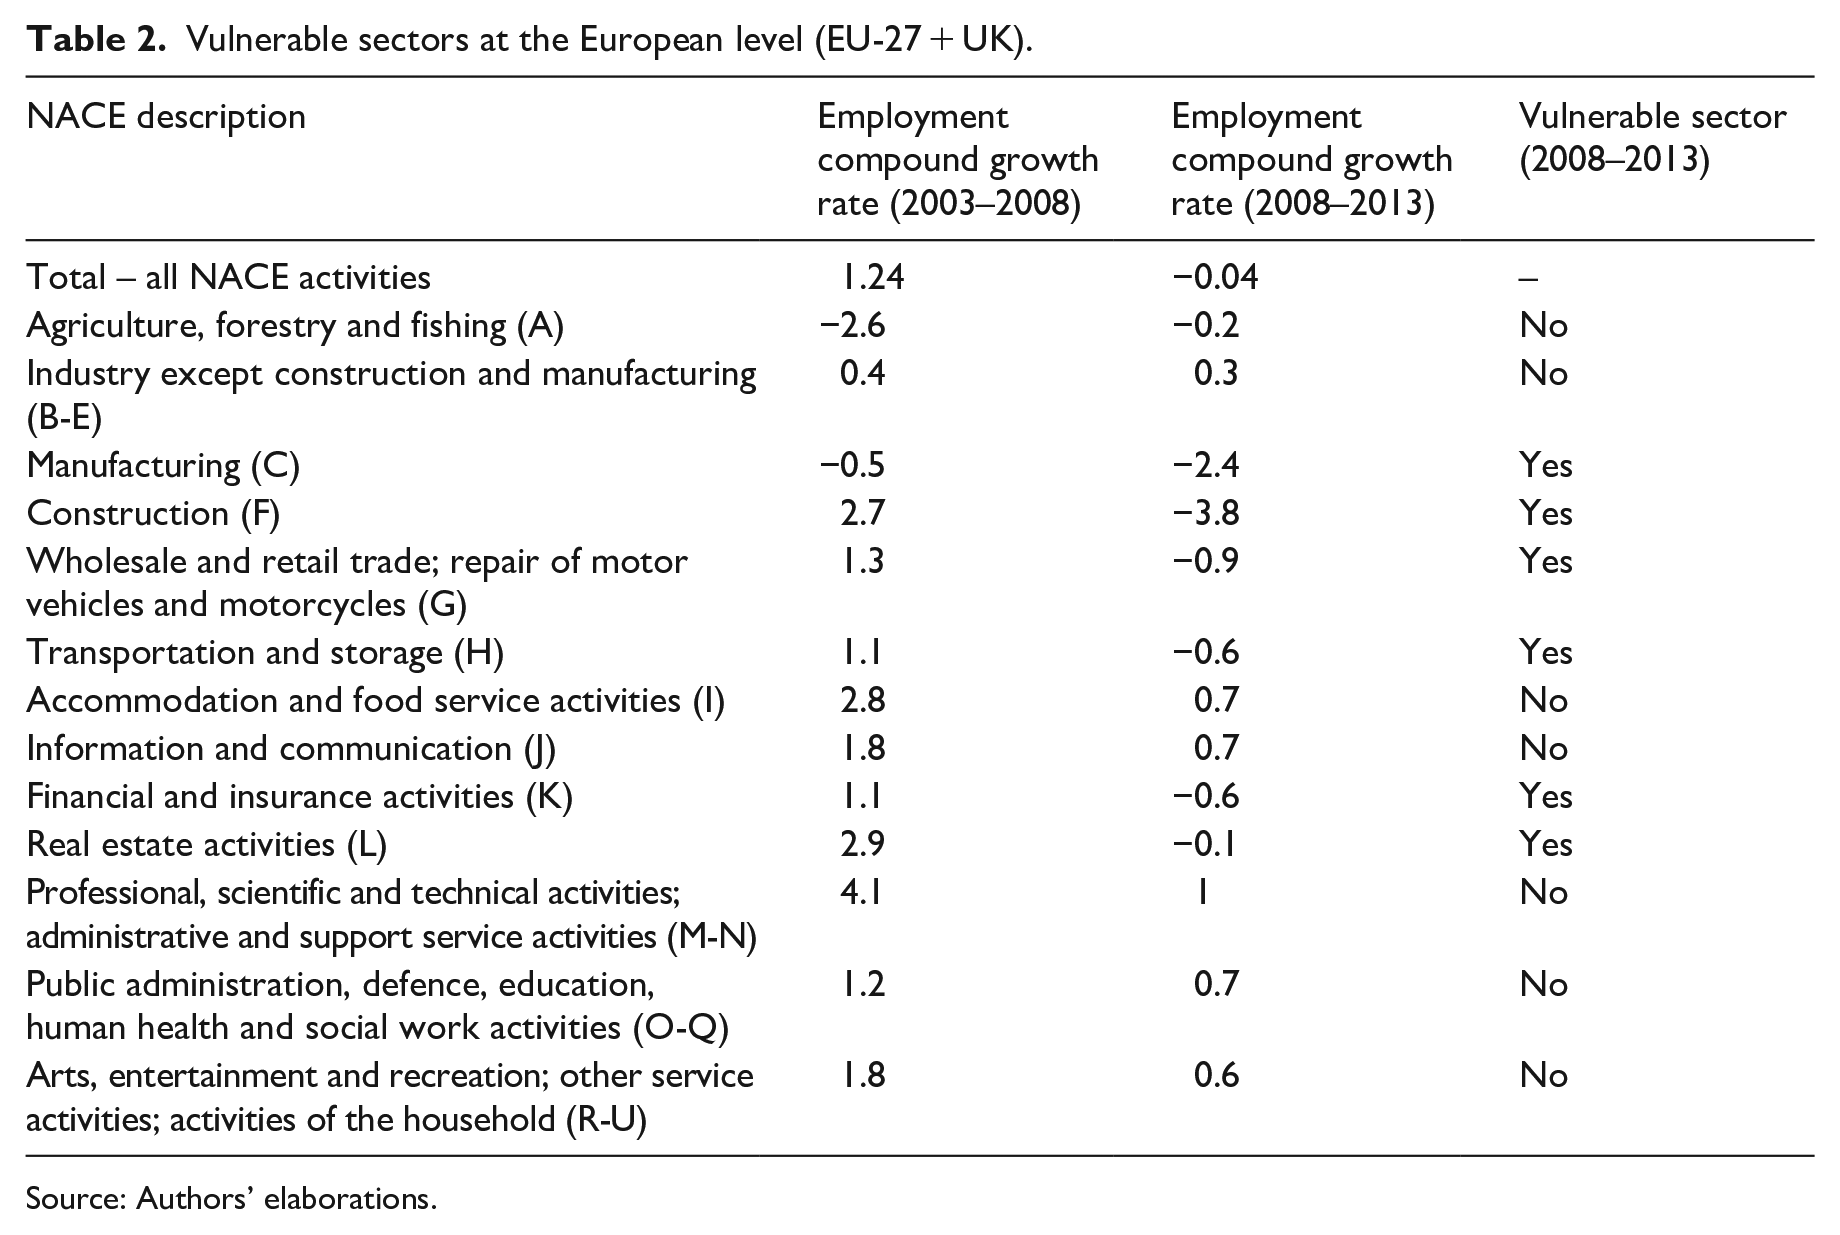
Source: Authors’ elaborations.
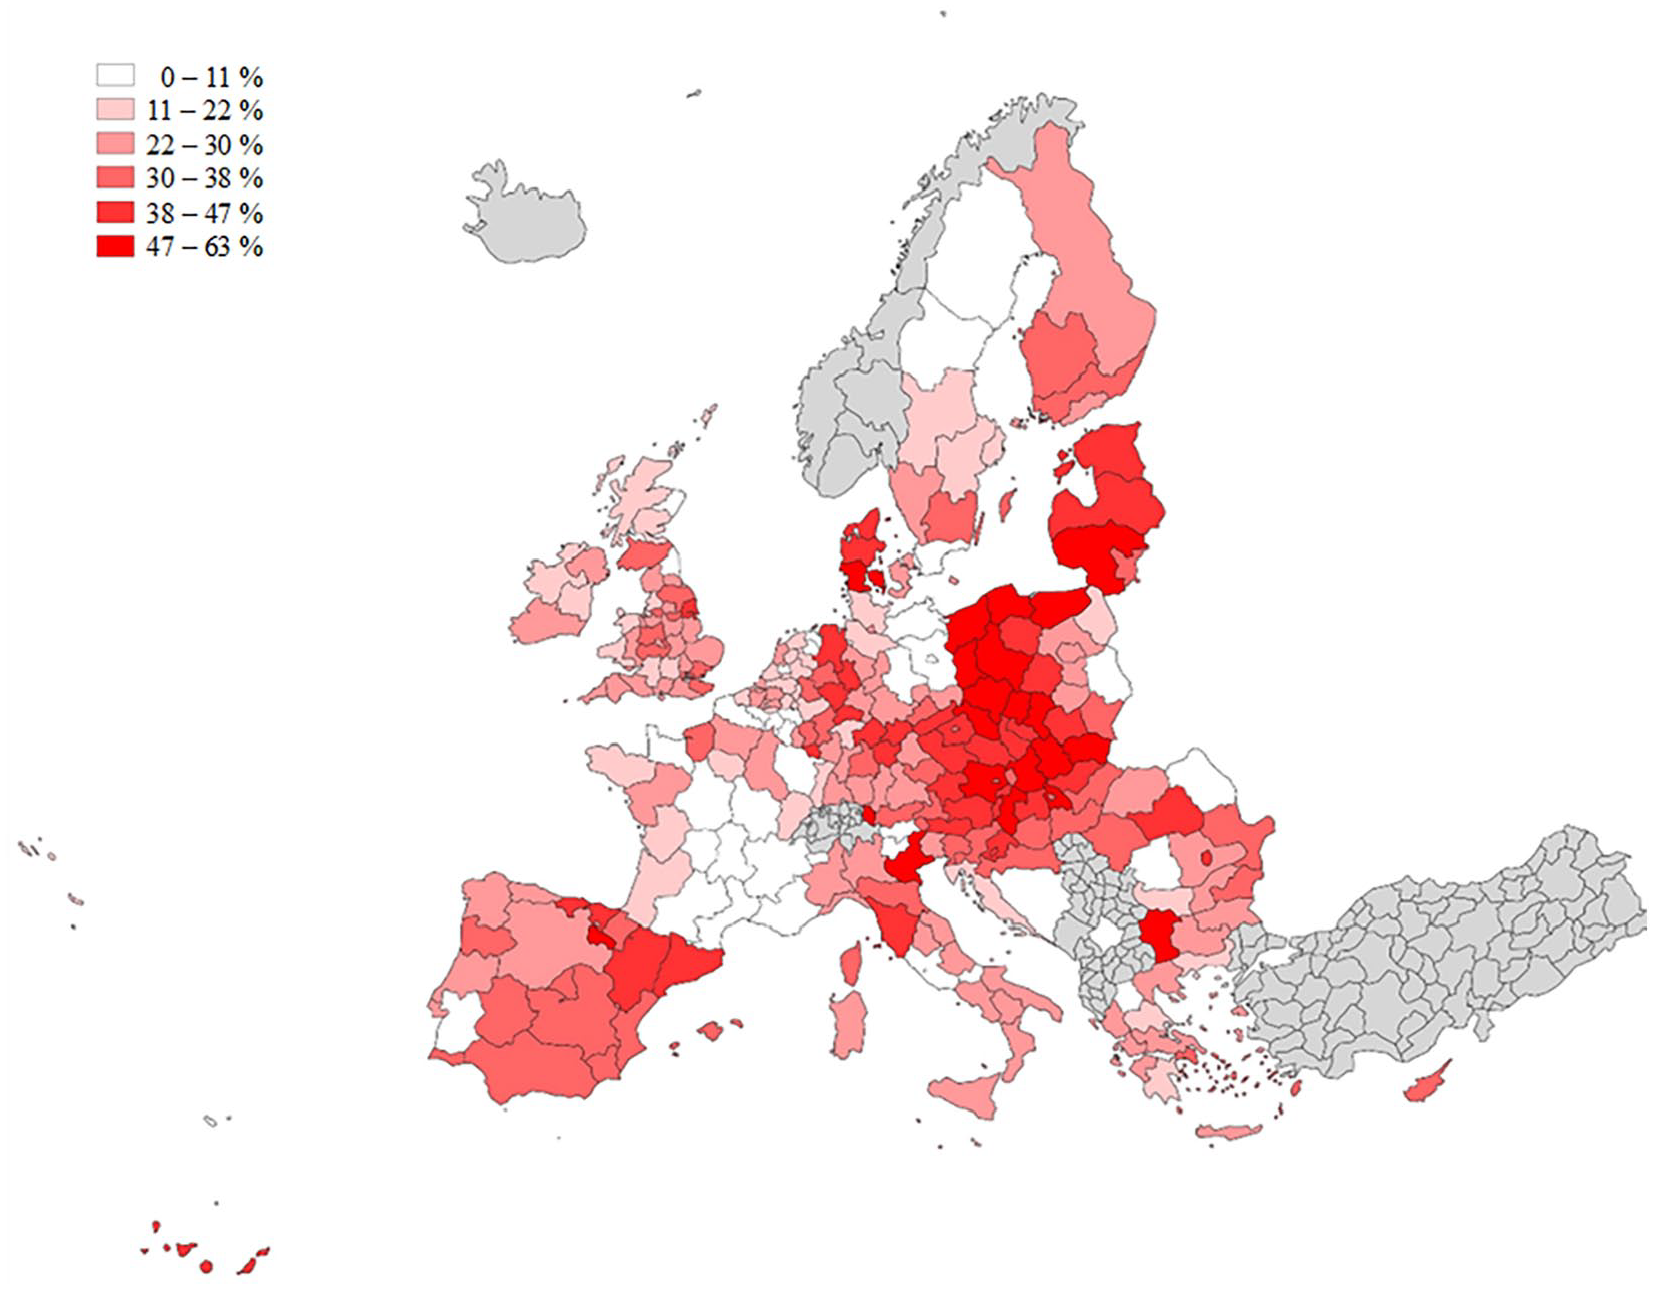
Vulnerable regions – share of regional employment in vulnerable sectors of specialization (2008).
The econometric setting
To explore the nexus among Cohesion Policy, Gross Regional Product (GRP) growth and regional inequalities, a linear regression model was applied in the spirit of convergence studies. As noted in the previous sections, while a recent strand of studies has adopted quasi-experimental approaches to evaluate the effectiveness of Cohesion Policy, both at the regional (Becker et al., 2018; Crescenzi and Giua, 2020; Gagliardi and Percoco, 2017; Pellegrini et al., 2013) and beneficiaries’ level (Bachtrögler et al., 2020), the convergence framework remains widely applied in the literature (Bourdin, 2019; Calegari et al., 2023; Delgado et al., 2024; Fiaschi et al., 2018; Fidrmuc et al., 2024) also to identify specific groups or clubs of regional convergence (Cutrini, 2023; Cutrini and Mendez, 2023). 7
Specifically, the econometric analysis has been divided into two parts. The first part compares the link between Cohesion Policy and regional growth during two distinct periods, a crisis period (2008–2011) and a recovery period (2014–2019), as summarized in equation (1) below:
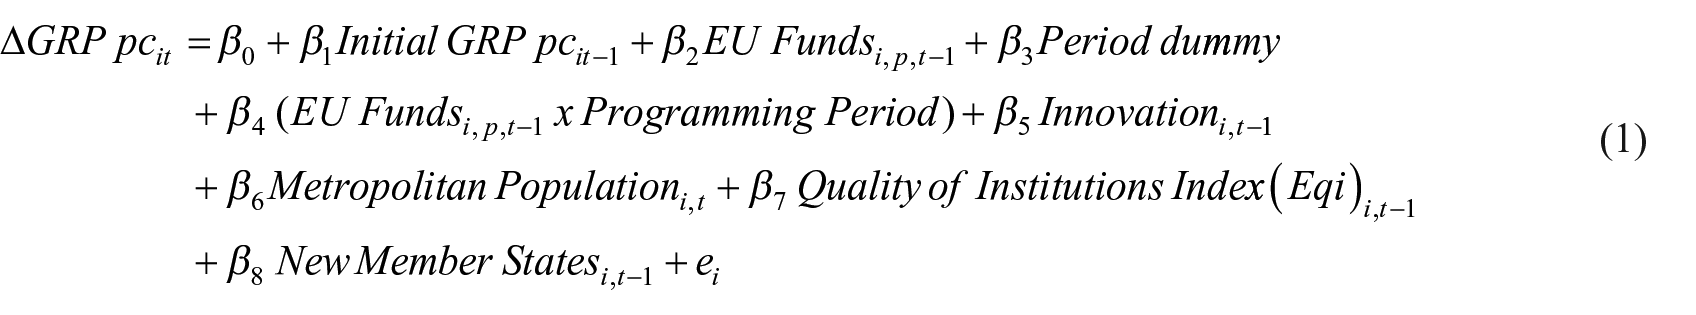
The dependent variable (ΔGRP pcit) is the compound growth rate of gross regional product per capita of region i in period t, intended, respectively, as either the crisis period (2008–2011) or the recovery one (2014–2019). Data on GRP for all EU27 NUTS regions was extracted from the ARDECO database developed by Cambridge Econometrics and currently maintained by the European Commission’s Joint Research Centre (DG JCR) (https://urban.jrc.ec.europa.eu/ardeco/manager). GRP per capita for the UK, measured in real prices was sourced from the Office for National Statistics (https://www.ons.gov.uk/). To ensure data consistency within the database, GRP chained volume measures were used as deflator for the conversion of raw data into GRP per capita at constant prices, keeping the index set to 2015, as in the ARDECO database. On the right-hand side, the main variables of interest are the dummy accounting for the time period, taking value 1 in the recovery period 2014–2019 and 0 in the 2008–2011 crisis one, and the one related to Cohesion Policy funds. In particular, the subscript t-1 refers to the programming period 2000–2006 for the crisis period and to the 2007–2013 for the recovery one. In addition, the subscript p for the EU funds variable refers to the use of the total Cohesion Policy and total RTDI funds allocated to regions in each of two programming period considered. In particular, estimations have been conducted by using the location quotients (LQs), computed with respect to the European average, of both Cohesion Policy and RTDI, introduced alternatively to mitigate multicollinearity issues. 8
Data on Cohesion Policy funds at the NUTS2 level was drawn from two main sources. 9 For the programming period 2000–2006, data was retrieved from the DG Regional Policy website (https://ec.europa.eu/regional_policy/policy/evaluations/data-for-research) and elaborated to convert NUTS3 data into NUTS2 data. For the programming period 2007–2013, data was retrieved from the Open Data Platform managed by the European Commission (https://cohesiondata.ec.europa.eu/). 10 Importantly, expanding eq.1 by introducing the interactions between each of the two Cohesion Policy and RTDI funds variables and the period dummy allows highlighting whether the link between Cohesion Policy and RTDI funds and regional growth varies between crisis and recovery periods.
Additional control variables frequently associated with regional growth were considered in the estimation, namely the quality of institutions (Arbolino et al., 2020), the level of urbanization (Capello et al., 2015) a variable for the New Member Countries, which captures the timing of accession to the EU and the accessibility to Cohesion Policy funds as much as the country level of development. Innovation is measured using the number of trademarks for thousand inhabitants. Trademarks have been found to be positive correlated with innovations, especially in the field of product development (Flikkema et al., 2019; Mendonça et al., 2004). Compared to patents, trademarks capture a broader set of innovations. They are extensively utilized across various industries and types of firms and encompass both technological and non-technological innovations. More important, they capture dynamics of innovation closer to the commercialization phase, and for this reason, they are more likely to deliver economic changes in a relatively short period. Further description of the variables and sources included in the model are reported in Appendix 1 (Table 7).
Importantly, estimates have been obtained by using a two-period fixed-effect panel regression. Using fixed effects enabled accounting for systematic variations among regions, including the unobserved ones that might affect the relationship between the variables of interest. The appropriateness of this choice is corroborated by the results of the Hausmann test which rejected the random effects hypothesis. Moreover, the clustering of errors at the country level allows considering the within-country correlation of regional units. Finally, to lessen endogeneity issues, explanatory variables were lagged when data was available.
Next, the analysis unpacks further the link between Cohesion Policy and RTDI funds and regional recovery by zooming on the case of vulnerable regions, those at highest risk of being hit by the crisis because of their specialization in vulnerable sectors. Specifically, regional vulnerability is computed as the employment share in specialization sectors that were in crisis at the European level over the regional total employment and transformed into a categorical value ranging from 1 to 4 based on its quartile distribution. Accordingly, equation 1 has been adapted by introducing the regional vulnerability variable, in place of the crisis dummy, and its interaction with the LQ accounting for Cohesion Policy and RTDI funds, respectively, as summarized in equation (2) below:
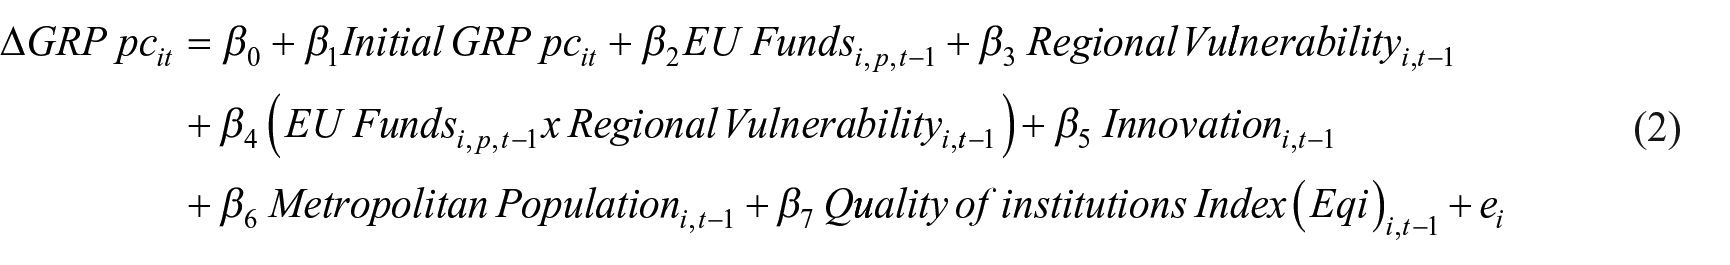
By construction of the regional vulnerability variable, which is measured in 2008 as described in Section 3.1, equation 2 has been estimated in a cross-sectional linear regression framework, with the compound growth rate of gross regional product (ΔGRP) per capita in the period 2014–2019 as the dependent variable. For the same reason, the dummy variable for New Member States has been removed as all countries have already joined the EU by that time.
In addition, previous research has underscored the critical role of spatial dependencies in understanding regional growth dynamics and to evaluate the impact of Cohesion Policy (Bourdin, 2019; Dall’erba and Le Gallo, 2008; Ertur and Koch, 2007; Rey and Montouri, 1999). Therefore, the test procedure proposed by Elhorst (2010) and Vega and Elhorst (2015), elaborating on LeSage and Pace (2009) was applied, starting with the computation of the Lagrange Multiplier (LM) tests. LM tests were based on a row-standardized inverse distance matrix whose elements, the spatial weights wij, represent the geographic distance between the centroids of the i and j regions. 11 Both LM tests and the Moran’I, speak against the presence of substantial spatial dependence in the dependent variables and in the disturbances. Following Elhorst (2010) and Vega and Elhorst (2015) recommendations, OLS have been re-estimated by including the spatially lagged independent variables (i.e. estimating the SLX model, Vega and Elhorst [2015]), and testing for their significance. The output of the test did not enable rejecting the null hypothesis of no significance of the spatially lagged independent variables suggesting that OLS is the model best describing the data.
The estimates reported in Section 4 are therefore based on a traditional specification with OLS estimates.
Importantly, the final aim of the article is to identify the role of Cohesion Policy for the recovery of vulnerable regions, and for narrowing interregional inequalities due to the enlarged gaps in terms of GRP pc growth between vulnerable and non-vulnerable regions produced by the crisis. Empirically, this is implemented by the computation of the Theil index and its within and between components for different groupings of regions, thus enabling to highlight the implications of Cohesion Policy and RTDI funds for interregional inequalities. Specifically, the Theil index 12 was computed at the final year of the recovery period (2014–2019), based on the real GRP per capita in 2019, by applying the following formula:
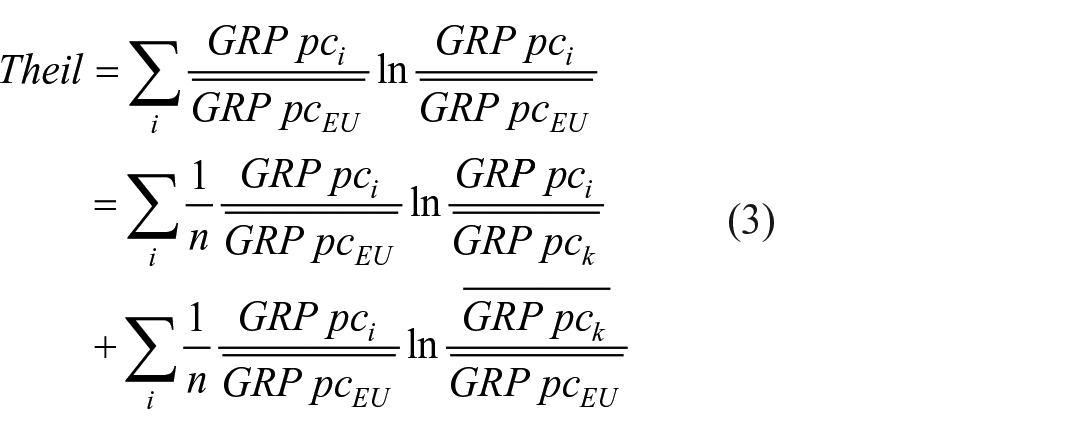
where EU and i stand, respectively, for European Union and region (NUTS2), n is the number of regions, while k denotes the subgroup used to decompose the Theil index in its within and between components (second terms of equation [3]). Specifically, regions were grouped based on their vulnerability, so to calculate inequalities within vulnerable regions (i.e. the top 25% vulnerable regions) and between vulnerable and non-vulnerable ones. Following Capello and Cerisola (2021), the 2019 value of the Theil index and its components were next compared to those obtained from the re-estimation of Eq. 2 on the basis of the predicted GRP per capita growth and levels calculated by setting the coefficient of the Cohesion Policy and RTDI funds at zero for the recovery period (Capello and Cerisola 2021; Duan et al., 2023; Fourrey, 2023; Shapley, 1953; Shorrocks, 2013). In detail, equation 2 was re-estimated by alternatively setting at 0 the coefficient of Cohesion Policy and RTDI funds, thus obtaining the predicted GDP per capita growth in 2019. Next, the GDP per capita level in 2019 was calculated by applying the predicted growth rate for 2019 at the actual 2014 GDP per capita level (including the estimated residuals). Finally, the Theil indices were computed on the estimated values of GDP per capita for 2019 and compared to the real 2019 ones, grouping regions as vulnerable or non-vulnerable ones, for both Cohesion Policy and RTDI funds alternatively. Moreover, regions were grouped depending on their eligibility status for the Convergence Objective (i.e. GRP per capita level below 75% of the EU average), so to calculate inequalities based on regional development objectives, an approach aligned with the convergence club literature clustering regions on the basis of income per capita level (Cutrini, 2023).
The following section presents the results of the empirical analysis.
The nexus between Cohesion Policy, regional growth and inequalities: empirical evidence
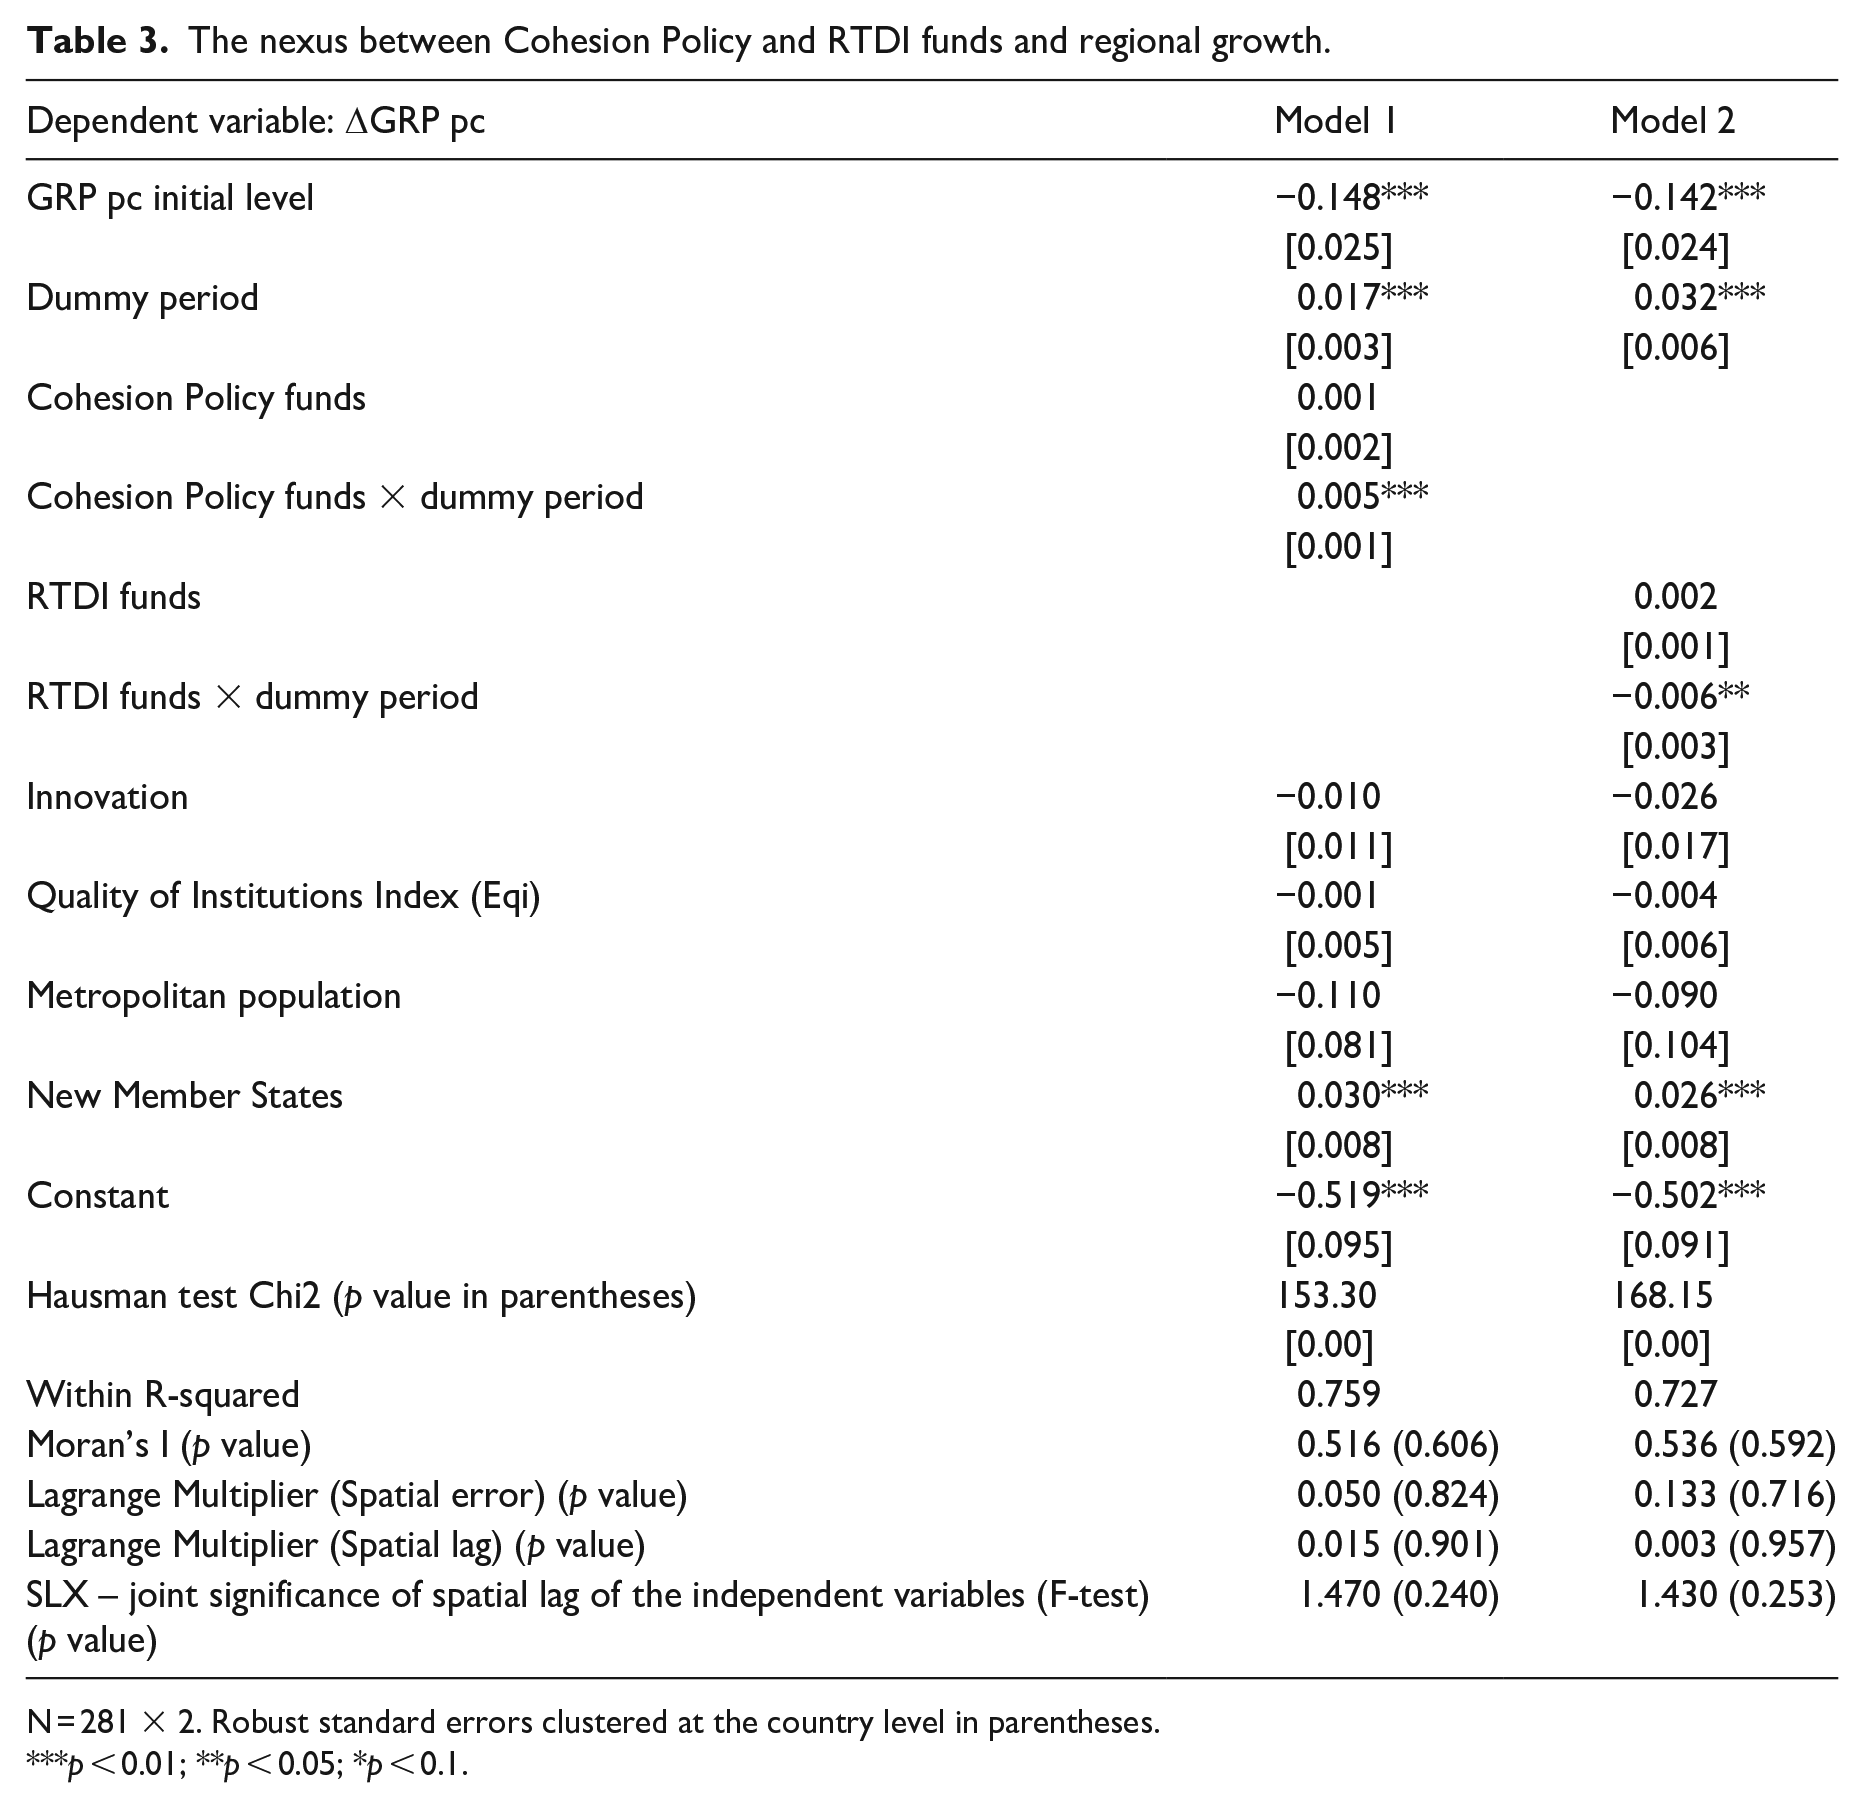
Table 3 reports the results of the two-period fixed-effect panel regression when including the total amount of Cohesion Policy (model 1) or RTDI funds (model 2) allocated at the NUTS2 level, both expressed as LQs and their interaction with the crisis dummy variable, whose marginal effects are displayed in Table 4. Taken together, Tables 3 and 4 highlight two main messages.
The nexus between Cohesion Policy and RTDI funds and regional growth.
N = 281 × 2. Robust standard errors clustered at the country level in parentheses.
p < 0.01; **p < 0.05; *p < 0.1.
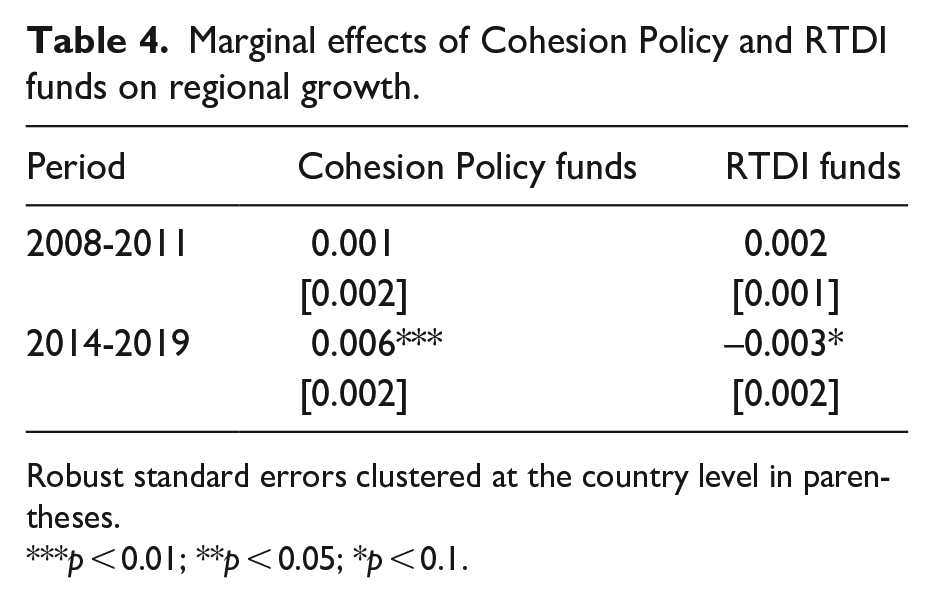
Marginal effects of Cohesion Policy and RTDI funds on regional growth.
Robust standard errors clustered at the country level in parentheses.
p < 0.01; **p < 0.05; *p < 0.1.
First, estimates in Table 3 as much as the marginal effects reported in Table 4 highlight a significant association between Cohesion Policy and RTDI funds and regional growth only during a time of recovery but not during a time of crisis, differently from the findings of the resilience literature (e.g. Crescenzi and Giua, 2020). 13 There can be two possible explanations for this mismatch. First, differently from other contributions (e.g. Arbolino et al., 2020; Di Caro and Fratesi, 2022), the present empirical analysis considers the delayed implications of Cohesion Policy and RTDI funds of each programming period on regional economic growth in the subsequent period of time. Second, Cohesion Policy funds underwent some changes and adaptation in the two periods considered (2000–2006 and 2007–2013). In the earlier period, the primary objective was centred around long-term growth and reducing inequalities among regions. During the 2007–2013 programming period, following the outbreak of the crisis, the European Commission recognized the urgent need to address its negative impacts. Cohesion Policy funds were not only aimed at sustaining long-term growth but also at mitigating the short-term effects of the economic downturn. This involved re-programming the utilization of Cohesion Policy funds from a counter-cyclical perspective and redirecting them to support measures aimed at stabilizing economies, preserving jobs, and promoting recovery (Berkowitz et al., 2015; European Commission, 2008). This re-orientation may have been further reinforced by the different spatial allocation of funds in the programming period 2007–2013 which favoured the new member states from Eastern Europe. These countries indeed received substantial financial support for economic recovery and convergence.
Second, the comparison of the results of models 1 and 2 highlights opposite patterns for Cohesion Policy and RTDI funds. In fact, the positive and significant coefficient of the interaction between the period dummy variable and the Cohesion Policy variable underscores the pro-cyclical nature of Cohesion Policy during a phase of economic recovery. In other words, in the period of rebound, those regions where Cohesion Policy funds are allocated at levels above the European average tend to experience higher economic growth. These results are aligned with previous studies on the effectiveness of Cohesion Policy (e.g. Pellegrini et al., 2013). On the contrary, the negative and significant sign for RTDI funds suggests that RTDI funds might not have effectively contributed to the economic resurgence of European regions, a finding consistent with the results by Celli et al. (2021). However, the positive and significant sign of the dummy variable flagging New Member States as much as of the initial level of GRP per capita seems to indicate an ongoing catch-up process in less developed regions, where RTDI funds did not represented a top-priority investment field in the frame of the two programming periods considered. Moreover, consistent with the spatially selective nature of research and innovation activities (Celli et al., 2021), RTDI funds tend to concentrate in advanced but not necessarily fast-growing European regions (Figure 6 in Appendix 1).
Vulnerable regions, those that at the beginning of the crisis period had the highest risk of being hit, look the ones benefitting the most from Cohesion Policy funds. The estimation of equation 2, whose results are reported in Table 5, suggests a positive and significant link between Cohesion Policy funds and regional growth in vulnerable regions (i.e. specialized in sectors in crisis at the European level). Importantly, this positive association is particularly evident in regions that exhibit the highest degree of vulnerability, as demonstrated by the marginal effects shown in Table 6. 14
The nexus between Cohesion Policy and RTDI funds and regional growth for vulnerable regions.
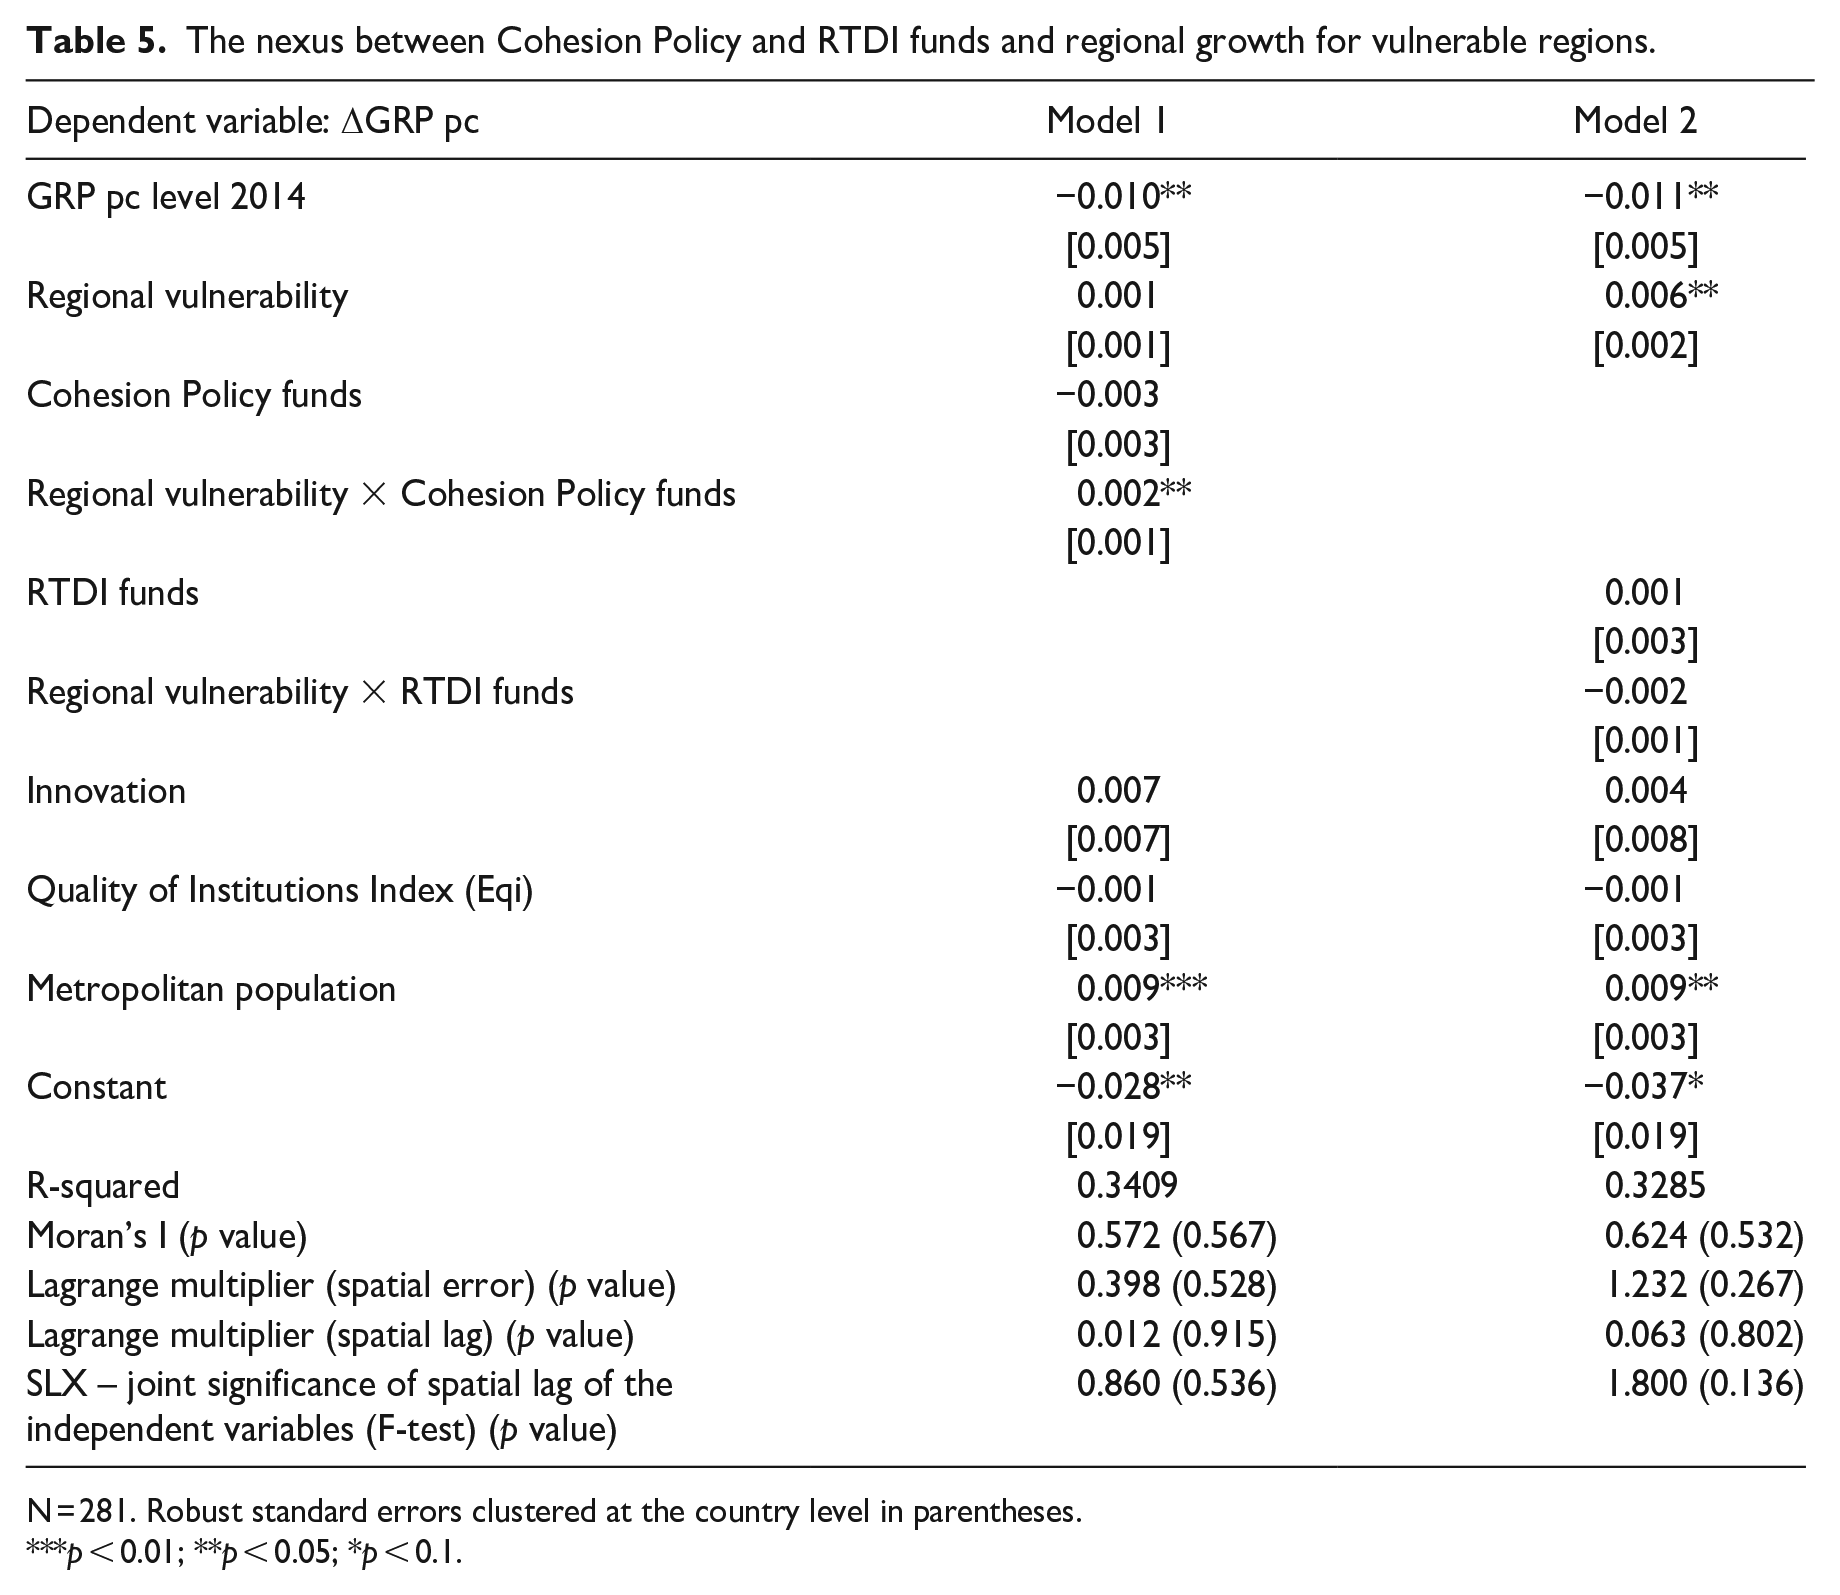
N = 281. Robust standard errors clustered at the country level in parentheses.
p < 0.01; **p < 0.05; *p < 0.1.
Marginal effects of Cohesion Policy and RTDI funds on regional growth by regional vulnerability intensity.
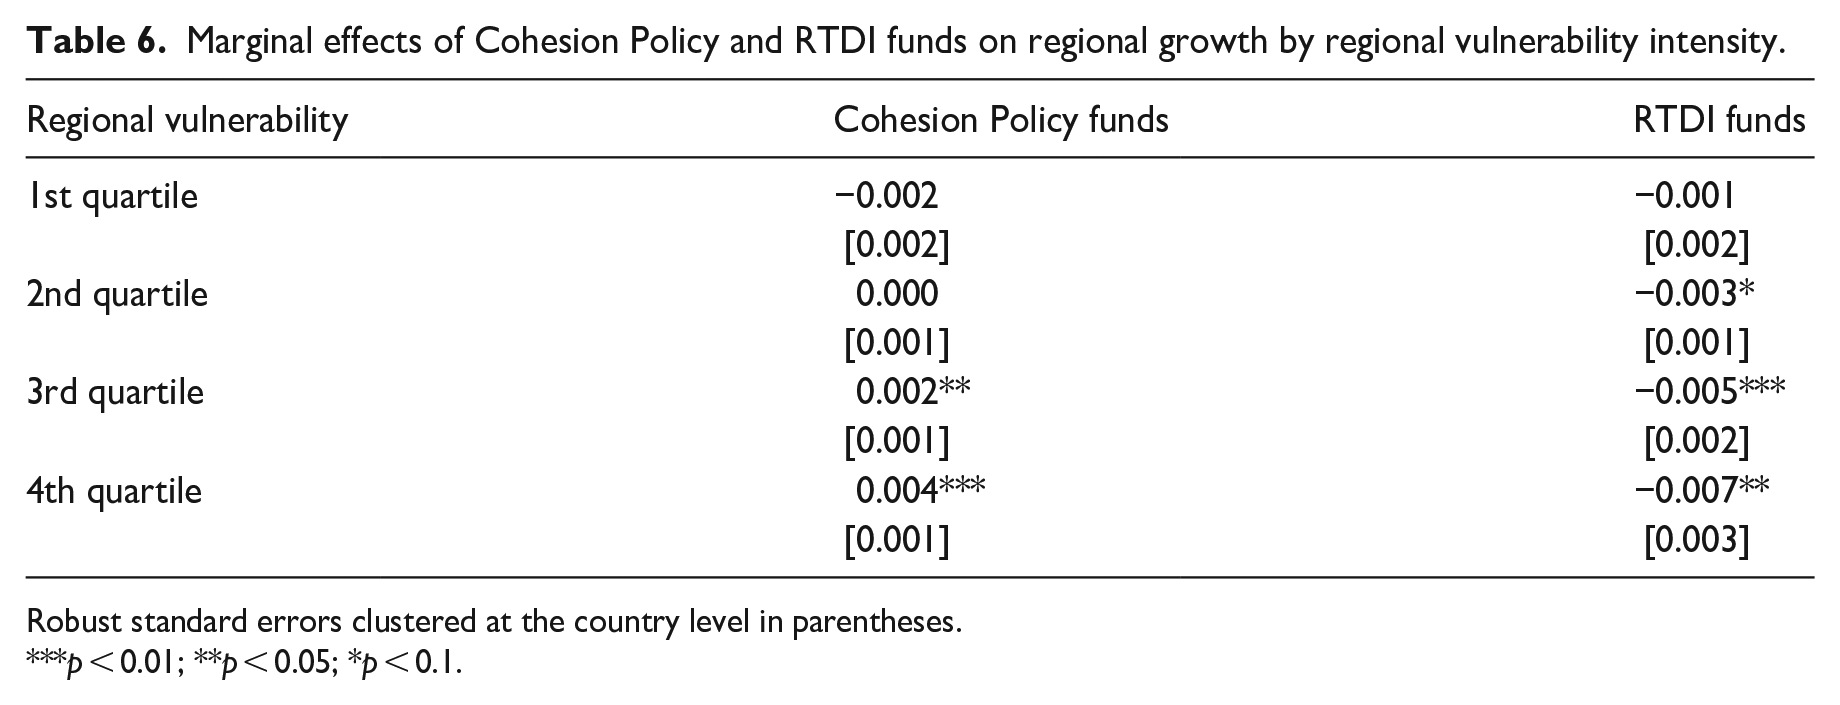
Robust standard errors clustered at the country level in parentheses.
p < 0.01; **p < 0.05; *p < 0.1.
On the other hand, and consistent with results of Tables 3 and 4, the negative coefficient of the interaction term between the regional vulnerability and the RTDI funds variables suggests that investments in RTDI are negatively associated with the recovery efforts of regions characterized by the greatest vulnerability. This negative association intensifies with increasing levels of vulnerability, as illustrated in Table 6. In other words, regions heavily specialized in sectors severely affected by the crisis were, at least in the short term, unable to benefit from innovation funds for future economic growth. Possibly, in highly vulnerable regions, investments in RTDI do not represent the most compelling areas of interventions.
To understand the implications of the nexus between Cohesion Policy, RTDI funds and regional growth for inequalities across European regions, Figures 2 and 3 present the percentage difference between the real Theil indices computed on the real value of GRP per capita in 2019 and the estimated Theil indices obtained once put at zero the coefficients of Cohesion Policy and RTDI funds in equation 2. Figure 2 refers to the Theil decomposition by vulnerable and non-vulnerable regions, while Figure 3 refers to the Theil decomposition by eligibility status to the Convergence Objective. Both comparisons can shed light on the narrowing of interregional inequalities and thus a process of convergence within groups, that is, clubs, of regions (Cutrini, 2023; Cutrini and Mendez, 2023).
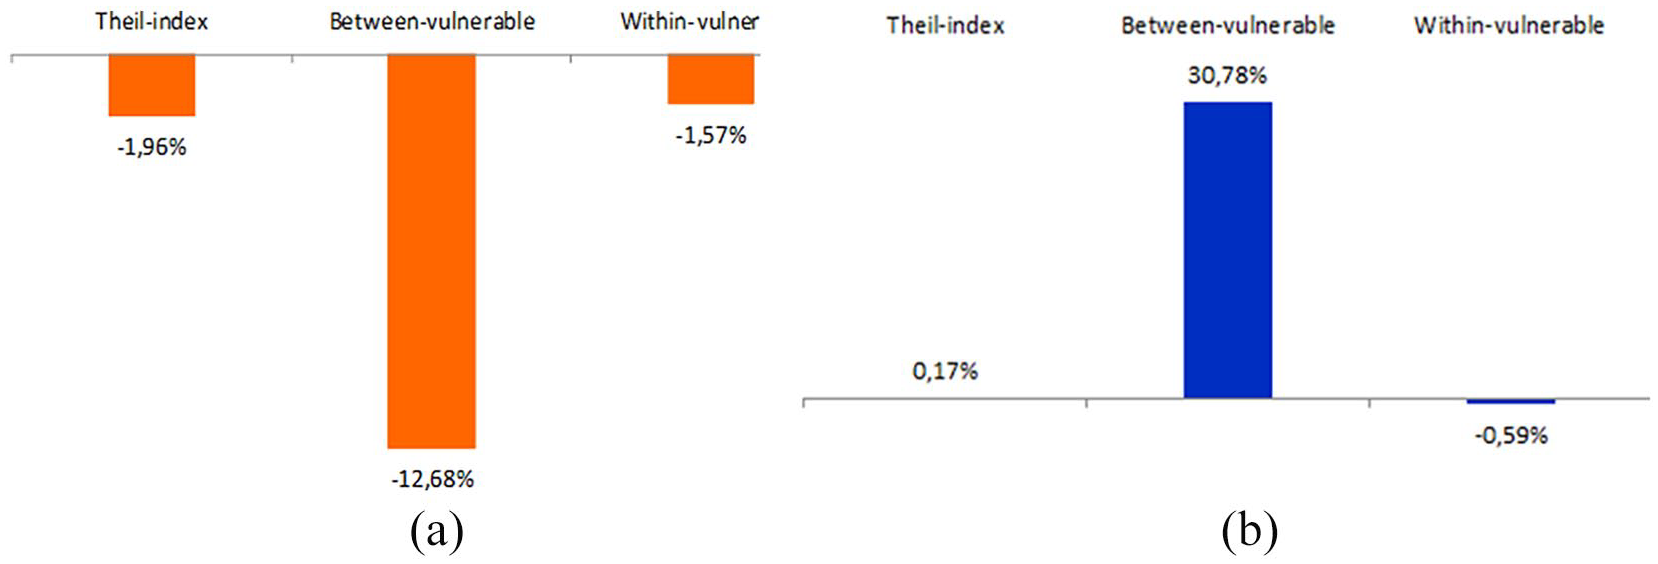
(a) Change of interregional inequalities with Cohesion Policy funds: Theil decomposition by vulnerable regions. (b) Change of interregional inequalities with RTDI funds: Theil decomposition by vulnerable regions.
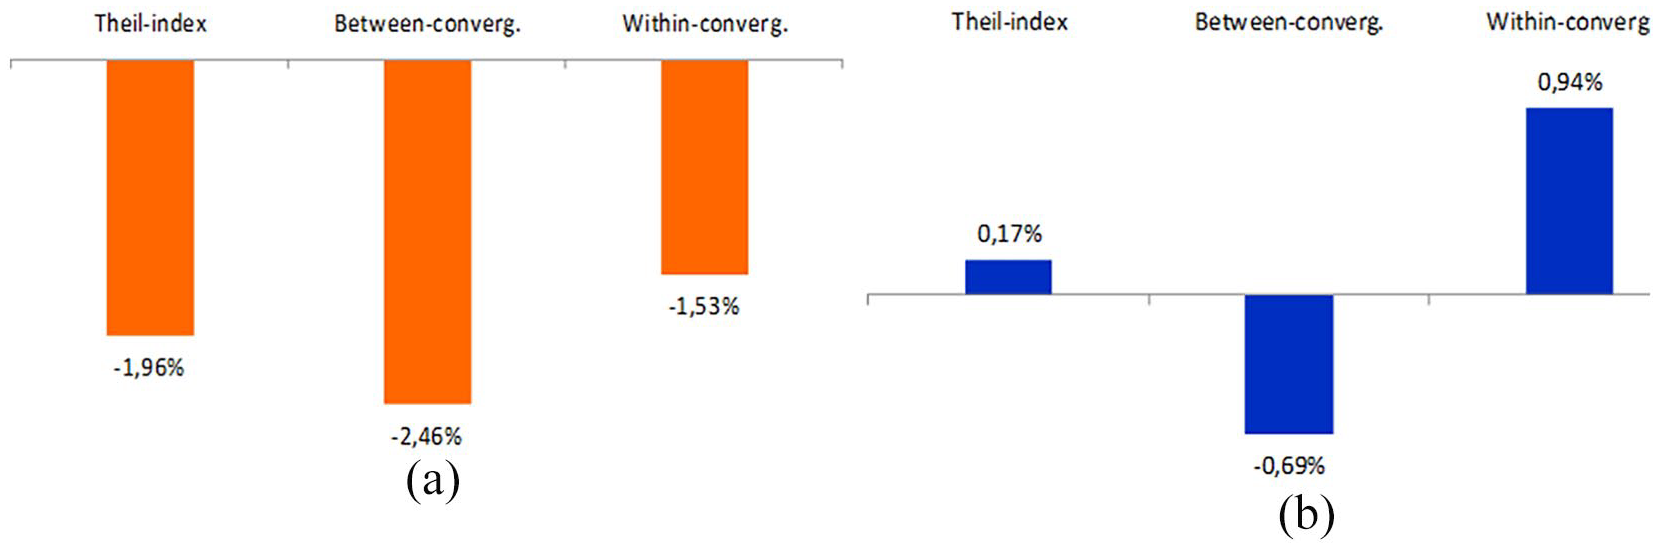
(a) Change of interregional inequalities with Cohesion Policy funds: Theil decomposition by Convergence Objective regions. (b) Change of interregional inequalities with RTDI funds: Theil decomposition by Convergence Objective regions.
Figure 2(a) shows that in presence of Cohesion Policy funds, inequalities have become less pronounced. This result is driven by lower inequalities between vulnerable vs non-vulnerable regions, but it is also confirmed by reduced within-vulnerable inequalities. The same cannot be said for what concerns RTDI funds (Figure 2[b]). In this case, total inequalities increase, suggesting once more that innovation and its returns are spatially concentrated in more advantaged regions. This result is driven by the increase of inequalities between vulnerable and non-vulnerable regions, only partially compensated by a decrease of inequalities in the vulnerable regions group. This result suggests that vulnerable regions are not able to obtain economic returns from innovation as non-vulnerable ones. In other terms, this result stresses the fact that in a rebound period structural policies seem not to be useful to relaunch economic recovery in regions disadvantaged by the crisis.
The Theil indices calculated by grouping regions according to their eligibility status for the Convergence Objective show that there is a decreasing inequalities trend between the convergence groups of regions, confirming the contribution of Cohesion Policy to the reduction of gaps between more and less developed regions (Figure 3(a)). Moreover, this is obtained with a reduction of within group inequalities, a result confirming the existence of regional convergence clubs (Cutrini, 2023; Cutrini and Mendez, 2023; Fischer and Stirböck, 2006).
The same, again, cannot be said for the RTDI funds (Figure 3(b)). As in the case of Cohesion Policy funds, the convergence between more and less developed regions is obtained at the expenses of the most fragile regions within the convergence group, launching once again the debate on how to cope with innovation policies in laggard and marginal areas of Europe.
Conclusions
The assessment of the efficiency and effectiveness of Cohesion Policy has received extensive attention in the literature highlighting the complexity of this task, given the multiple territorial scales and multiple rationales it pursues (Dąbrowski et al., 2014; Iacobucci, 2021).
This article has contributed to this lively scientific debate by analyzing the nexus between Cohesion Policy and RTDI funds and regional growth in opposite macroeconomic contexts (crisis and recovery) and for regions suffering from different vulnerability levels to macroeconomic shocks, as much as their implications for interregional inequalities. Specifically, the empirical analysis referred to the prolonged economic downturn that affected Europe during the 2007–2008 financial crisis and the 2011 European sovereign debt crisis, and the subsequent recovery from 2014 to 2019.
The results highlight that Cohesion Policy and RTDI funds display complex and heterogenous patterns under alternative macroeconomic scenarios.
Cohesion Policy funds allocated during the economic crisis (2007–2013 programming period) offered some contributions to the recovery of European Regions, thus operating in a pro-cyclical manner. In addition, they have favoured the revitalization of vulnerable regions. These results are aligned with previous findings in the vast literature aimed at assessing the effectiveness of Cohesion Policy expenditures and its (territorial) enabling conditions. The implications for regional inequalities are also worth to be noticed. Cohesion Policy funds, in general, are associated with a reduction of interregional inequalities during the recovery period. This aggregate reduction, in particular, is largely driven by the reduction of inequalities between vulnerable and non-vulnerable regions and between the regions eligible for the Convergence Objective fund and those that are not (Crescenzi and Giua, 2020; Mazzola and Pizzuto, 2020).
When examining RTDI funds, their relationship with regional growth and inequalities follows a different pattern. In particular, the association between RTDI funds and economic growth is not straightforward, especially in time of recovery, when a negative link emerges and intensifies with the degree of regional vulnerability to macroeconomic shocks. Differently from Cohesion Policy, inequalities increase, and they do so, primarily, through a process of divergence between vulnerable and non-vulnerable regions in the recovery period. Possibly, the spatially selective nature of research and innovation activities (Celli et al., 2021) and the different degree to which vulnerable and non-vulnerable regions take advantages from returns to innovation can contribute explaining the results. In other words, regions less exposed to the crisis were able to leverage their innovation investment and to convert them into tangible economic growth, while in the most vulnerable regions, innovation funds did not contribute to build regional resilience (Bristow and Healy, 2018; Filippetti et al., 2020).
The outcomes of the study warn against the existence of possible conflicts between the broader cohesion objective and the additional EU objectives and underscore the importance of unpacking Cohesion Policy funds to deepen understanding of its mechanisms of action and the channels through which its benefits unfold. Especially for what concerns RTDI expenditures, the findings confirm the existence of a tension between sustaining regional growth and nurturing innovation. The lack, at least in the short run, of a direct link between funding research and innovation activities and increased growth calls for a careful re-assessment of innovation policy to better align with regional needs and with the logic of such interventions (e.g. sustaining long-term growth versus short-term competitiveness).
Addressing this trade-off is crucial, especially given the increasing earmarking of Cohesion Policy towards achieving competitiveness goals, as requested by the policy philosophy underpinning the Smart Specialization Strategy and its role in the upcoming programming period 2021–2027.
Footnotes
Appendix 1
Declaration of conflicting interests
The author(s) declared no potential conflicts of interest with respect to the research, authorship and/or publication of this article.
Funding
The author(s) disclosed receipt of the following financial support for the research, authorship, and/or publication of this article: This research was funded by the European Union - NextGenerationEU, Mission 4, Component 2, in the framework of the GRINS -Growing Resilient, INclusive and Sustainable project (GRINS PE00000018 – CUP D43C22003110001) and by the European Union’s Horizon 2020 Research and Innovation Programme (project “ESSPIN”) under Grant Agreement No. 101061104.