
Abstract
There are significant inequalities in the publicly funded arts sector in England, including significant spatial inequalities. If anything, the critique of spatial inequalities in this ecology do not go far enough. This article uses a unique dataset of the boards of directors of Arts Council England’s national portfolio, derived from Companies House. While a majority of national portfolio organisations do not share board members with any other organisation, the analysis demonstrates that London-based organisations are significantly more likely to share board members with other companies than organisations outside London – and that, where an organisation outside of London does share a board member with a company in another region, it is more likely to be with a company in London than all other regions put together. It further demonstrates that this effect is most pronounced where these organisations are part of the same artform. Crucially, the organisations connected to London have more than double the portfolio income of other organisations, whether they share board members or not. This illustration of the concentration of power in London in the publicly funded arts sector, over and above the distribution of organisations in general, demonstrates the conceptual value of a cultural economy that emerges from interconnections within a local or national ecosystem. At the same time, the analysis and findings push the cultural ecology literature to centre inequality as a core issue as the concept is developed. Even the local cultural ecosystem is not exempt from the impact of the nation’s uneven (cultural) geography.
Introduction
New data sources and new modes of analysis are crucial to understanding the creative economy. These new approaches reveal the persistence of long-standing inequalities. This article examines the geographic distribution of power and influence within one section of one nation’s creative economy, arguing that inequalities are systemic within the uneven geographical development of the creative sector. Combining a unique dataset of Arts Council England (ACE) National Portfolio Organisations (NPOs) with public records in England’s Companies House, this article uses a geolocated social network analysis to show how the power and control of cultural organisations, along with the influence over the cultural sector, is highly unevenly distributed within England.
This article is structured in three parts. To situate our analysis we draw from three main bodies of literature. The first comprises interdisciplinary work on inequality in the creative economy; the second, geographical and urban studies perspectives, particularly those focussing on urban regeneration through and with culture; and the third addresses the governance of the cultural sector.
These three strands of research situate the significance of our analysis. Using Companies House data, drawn from the public API, we construct a network of arts organisations in regular receipt of Arts Council England funding. In this network, organisations are connected where they share a director.
Having first summarised key measures of the network, we then address the locations of the institutions. This allows us to compare the geographic distribution of institutions that share board members with others, and those that do not, and then to identify the spatial distributions of shared directorships.
We then interrogate the structure of this network. When we compare ties within and between different regions of England, we find a dominance of London over and above what might be expected from its already large number of institutions. The overrepresentation of London manifests both through the number of ties between different London-based institutions, and through ties between London-based institutions and institutions in other parts of the country.
Finally, we extend this analysis by focussing on differences between institutions beyond their locations, identifying whether rates of shared directorships across regions differs by the art form and organisational scale. This allows us to interrogate whether regional inequalities are more pronounced for particular artforms and if they are a result of organisations’ size.
The results demonstrate that London-based institutions are more likely to share board members with other organisations, compared with organisations outside of London. This is not explained by the large proportion of Arts Council-funded organisations being based in London. Rather, London-based organisations share board members both with other London-based organisations and organisations based elsewhere. The role of London is even more pronounced for regions that are more distant from London. Connections based on artform also flow through London. Most importantly, the organisations outside of London which share board members with London-based organisations have significantly larger portfolio income than those that do not.
Overall, our analysis shows three things: the centrality of London to the governance of culture in England; the influence and interconnectedness of London to organisations within regional cultural economies; and the geographic inequalities in funding and power within England’s cultural economy. This latter point is especially important given the social, economic, and political inequalities associated with London’s dominance of English state and society. These three points extend the literature on inequality, offering a new, spatial, mode of analysis to reinforce the findings present in the existing literature, and they add a spatial perspective to the literature on arts boards and cultural governance. The analysis has important implications for policy and public discourses about fairness and equity within and between the regions and localities of England.
Arts organisations and the cultural economy of cities and regions
There is now an extensive and detailed literature on the geography of creative industries. Key early debates over the cultural economy focussed heavily on urban areas (Bianchini and Parkinson, 1992; Evans, 2005) and subsequent claims both for and against the importance of creative industries were driven by perspectives from economic geography and planning (Florida, 2002; Markusen, 2006; Peck, 2005).
The contours of the debates, much like the discussions over the definitional boundaries between creative industries and the host of associated terms including ‘creative class’ and ‘cultural economy’, are too extensive to summarise in this article. However, two areas of research are crucial to our analysis of the uneven geography of power in England’s cultural sector. First is the broad literature on inequalities, particularly regional inequalities; second, the literature on the role of arts organisations within urban and regional economies.
Inequalities in the workforce and in the audiences of cultural organisations and institutions are well-known and well-established parts of the scholarship on creative industries (Brook, O’Brien & Taylor 2020). Perspectives focussed on the interaction between place and inequality have been particularly influential, both in terms of the literature supporting the ability of cultural organisations to have positive impacts in addressing place-based inequalities, and the contrasting literature noting the potential for culture-led place-based policies to accelerate and exacerbate social and economic problems (Campbell & O’Brien, 2017; Moldavanova et al., 2021).
Regional inequalities, as one element of place-based inequality, are extensively discussed in the literature on both the creative economy and cultural policy. We can see strong evidence of regional inequalities in England (Boix et al., 2014; Jayne, 2005; Oakley, 2004), in a context where London dominates the cultural and creative economy of the country. There are long-standing reasons for this imbalance, not least of which is the historical dominance of London in cultural spending, which we discuss in the following section. The particular imbalance in cultural policies reflects much the broader uneven geography of the nation, but it is especially important to give the role culture has been expected to play in urban regeneration. Moreover, cross-European research suggests London’s dominance is oversized compared to other similar nations with strong bases for cultural production, such as France and Italy (Boix et al., 2014), although a measure of centralisation of public funding of culture is hard to generate due to differences in how these data are collected and recorded cross-nationally. For example, funding data from the Compendium of Cultural Policies and Trends (2021) addresses the levels of government at which funding is awarded, rather than the geographical locations to which the funding flows.
There is no one, precise, form of urban regeneration intervention associated with culture, and Campbell, Cox, and O’Brien (2017) chart an extensive range of different modes and models, ranging from festivals for city branding, through to more extensive (and expensive) infrastructure development, many of which have dubious evidence of successful impact. Here, we highlight one approach, which is the use of an arts or cultural organisation as a centrepiece or anchor for social and economic development. This has a long history, with high-profile examples such as the Guggenheim in Bilbao (Plaza, 2000) as perhaps the best known, alongside examples of clusters of organisations being at the centre of the transformation, for better or worse, of places including Newcastle and Gateshead (O’Brien and Miles, 2010) and Liverpool (Cox and O’Brien, 2013), both in the North of England.
While cultural organisations have not been theorised as ‘anchor institutions’ for urban and regional development in the same way as universities (Comunian and Gilmore, 2016), Comunian and Mould (2014) suggest they can be seen as flagship developments with a variety of culture-led regeneration aims attached to them. As with the rest of the literature, the exact links between a cultural organisation, cultural production and place-based regeneration are unclear, at best (e.g. Campbell, 2011). At worst, institution-led cultural regeneration might negatively impact local creative and cultural economies that are marginalised by or in opposition to formal cultural organisations. Part of the limit to the impact of flagship cultural developments is a failure to create the right sort of surrounding infrastructure (Comunian et al., 2010), as well as limited policy attention beyond supporting the flagship organisation. At the same time, Comunian et al. (2010) identify the importance of governance arrangements for places to develop and support cultural and creative industries.
This is one element of Lees and Melhuish’s (2015) summary of the failure of 20 years of culture-led regeneration in England. There has been little to no rebalancing of cultural production away from London, and culture-led development did not generate the sorts of impacts desired by policymakers. At the same time, Lees and Melhuish (2015) also point towards a more locally focussed and participative approach to culture that can have positive effects on localities. In that context, and as with Comunian et al. (2010)’s understanding the conditions of success for place-based creative and cultural economies, questions of power and control over agendas, projects and resources, are crucial. Who is in control is thus a vital question for this set of literature, a question that provides the first starting point for our analysis.
While spatial imbalances in production and consumption in the creative economy have been the object of a long line of research, it has become much more prominent following the publication of ‘Rebalancing our cultural capital’, otherwise known as the ‘Rocc’ report (Stark et al., 2013). This report drew attention to the large fraction of Arts Council England’s revenue that was allocated to London-based organisations. It was followed up by a report by the same authors (Stark et al., 2014), which focussed on the National Lottery, the UK’s state-franchised lottery. 25% of the revenue from the Lottery is distributed to ‘good causes’, and ACE receives some of its funding through this route: this follow-up report illustrated that Lottery revenues were far more likely to be spent in London than in the areas where people were buying tickets. Further analysis illustrating the spatial distribution of ACE spending can be seen in Dorling and Hennig (2016). The trend shows a clear concentration of spending in London.
Since this analysis, ACE has responded with a greater focus on its spending outside London. Its major long-term spending commitment, the National Portfolio, is updated over roughly 4- to 5-year periods; in the press release accompanying the announcement of the 2018–2022 portfolio, the first element highlighted was a ‘shifting focus to outside London’, with an increase in spending of £42.5 million per year outside London.
The concentration of ACE spending in London is not without consequence. Brook (2016) demonstrates that households with better access to museums and galleries, measured through both distance and ease of access, are significantly more likely to attend, over and above the strong relationships with attendance associated with other demographic factors such as education, gender and ethnic group. However, the concentration is also not random or simply a historic inheritance, with the uneven distribution of the creative economy being a second-order consequence of industrial strategy and cultural policy (Kemeny, Nathan, and O’Brien, 2020).
Arts governance and the need for spatial perspectives
Just as urban and regional perspectives have been crucial to understanding cultural economy (and its inequalities), organisational governance, studied by the analysis of social networks, has a long-standing research tradition (Cadbury, 1914; Lynch, 1914). In the private, or for-profit, context, the focus of boards is to be responsible to shareholders by safeguarding longer-term financial stability and setting, by appointing and approving senior staffing decisions, and by setting the strategic direction of an organisation. Who is on the board is thus a crucial element of understanding any organisation.
Who is on the board also tends to reflect social inequalities. Those who are on boards tend to have a range of social and cultural connections (Mace, 1971), as well as corporate experience. Ultimately, boards are often drawn from the narrow pool of those who are already on other boards, excluding a range of demographic groups (Westphal and Milton, 2000).
However, cultural organisations are distinctive from the corporate, for-profit, organisations that are the subject of much of the literature on boards and (social) networks. In the context of the mixed economy of state grants, philanthropic donations, and audience payments, art boards have a different set of challenges when focussing on financial sustainability (Radbourne, 2003). In addition to financial stability, in the context of organisational direction, art boards have a role in shaping the aesthetic and cultural programming by confirming senior artistic directors or curatorial appointments.
As a result, there is considerable literature which draws attention to differences between the boards of nonprofit and for-profit organisations, such as the effects of relationships with government, the importance of the reputations of nonprofit organisations and success in grant acquisition (e.g. Guo, 2007; Handy, 1995 and Faulk et al., 2016). There are also important ways in which the boards of arts and culture organisations are distinct from those of other nonprofit organisations, which have been extensively researched (e.g. Azmat and Rentschler, 2017; Banks, 2017; Carty et al., 2017; Dubini and Monti, 2018; Glow et al., 2019; Ostrower, 2002; Radbourne, 2003; Rentschler, 2014; Turbide et al., 2008). The key text is Ostrower (2002), who draws attention to the relationships between different cultural organisations, and their relationships with finance, banking, professional services and other high-status industries. Boards are both core donors and organisational custodians, ensuring the sustainability and success of the organisation. More recent work (Shaked, 2022) shows that the patterns that Ostrower identified in 2022 continue to persist.
In the English context, where our analysis is focussed, the most recent and specific research comes from Carty et al (2017). They demonstrate that the core focus of art boards in England is the financial sustainability of their organisation. This echoes Azmat and Rentschler’s (2017) work on Australia and Ostrower’s (2002) work on the USA. In the USA, boards play a key role in fundraising and donations, as well as financial oversight.
What is clear from Ostrower’s work, albeit in a more muted way in the English context, is the connection to inequalities, both in cultural and creative industries and in society more generally. To put it bluntly, the need for wealthy donors and those with connections to likely sources of funding create art boards that are highly unrepresentative of the populations they claim to serve and represent (Shaked, 2022).
Carty et al (2017) find similar issues in England, where boards are not diverse, with few disabled members and a monoculture in terms of social class backgrounds. As Carty et al (2017) note: ‘It is apparent that the professional networks appear to consist of a limited pool of individuals perceived to have the “right” skills and experience for board roles. These individuals then rotate from board to board as they increase and extend their confidence and networks. These pools of people result in what can become closed clubs of like-minded individuals that are not porous or “open” to others from different social or cultural backgrounds. This recycling of individuals obscures the potential contribution of others and perpetually validates the usual suspects’. (p. 28)
The consensus then, irrespective of national context, is of art boards as reflections of the art world: exclusive and unequal. At the same time, the inequalities are of a different nature, given the skew towards those with financial expertise (Ostrower, 2002), and the differences in wealth between even highly successful art workers and art board members. On the former point, Rees, O’Brien and Taylor (2022) have shown the dominance of specific occupations and industries in shaping the makeup of English art boards, with finance and property development as the core sectors dominating the network constituting England’s art boards.
The perspectives on inequalities and exclusions offered by the existing literature have shown the logic, along with the consequences, of particular social groups’ dominance of arts governance. However, spatial perspectives have largely been absent from the general work on arts governance and the specific study of art boards. For sure, as we have noted, there are national comparisons. But the urban and regional scale has not seen similar levels of attention.
Thus, a geographical perspective is especially important here. If the general literature suggests important inequalities are displayed in the makeup of cultural boards, what is the impact of the uneven geography of England’s cultural sector? Do shared board memberships between organisations mitigate this unevenness, or amplify it?
In the English context, we expect the inequalities discussed in the previous section to result in a disproportionate concentration of board members in London. Given the shift in public spending towards institutions outside London, there is also the question of whether this has been accompanied by a change in governance networks, or whether London-based board members are now also governing organisations across the country.
These points bring the discussion back to the initial review of the uneven geography, and its consequences, on England’s cultural sector. The two areas of literature that have been reviewed thus grant two insights to influence the starting point for our analysis. First, there are the long-standing inequalities in England’s cultural economy; second, there is the under-researched importance of governance both accounting for inequalities (Banks, 2017) and in giving a complete picture of arts and culture at both local and national levels.
Data
Our starting point is the boards of directors of Arts Council England’s (ACE) National Portfolio Organisations (NPOs). ACE funds a large number of organisations over fixed periods, awarding stable income to these organisations. The current portfolio, running from 2018 to 2022, comprises 834 NPOs across the different artforms that ACE funds: dance, music, theatre, literature, and combined arts. NPOs receive a minimum of £40,000 per year – currently, 23 NPOs receive less than £50,000 per year, and a further 141 receive less than £100,00 per year – while the Royal Opera House’s annual grant of £24 million is the largest.
This is by no means an exhaustive measure of English cultural governance. There is obviously more to culture in England, and to cultural governance, than the national portfolio: commercial theatre (such as the West End) and most popular music are outside the national portfolio, as are numerous smaller art organisations. However, it provides us with a well-defined, bounded set of organisations. Of the 834 NPOs in the 2018–2022 portfolio, we exclude 65 which are administratively parts of larger organisations, such as museums that are parts of universities and arts programmes that are part of local authorities, leaving us with a total of 768 arts organisations. While most NPOs are formally registered as both companies (at Companies House) and as charities (at the Charity Commission), some of these organisations are registered exclusively as charities, and others are registered exclusively as companies. Here, we focus on the 735 arts organisations whose boards of directors can be accessed via Companies House.
Companies House is the register of companies in the UK, and is an arm of the Department for Business, Energy, and Industrial Strategy. All forms of companies – including public limited companies, private companies listed by shares and community interest companies – are obliged to submit a number of documents to Companies House, including annual financial statements, and information about board composition such as when directors are appointed or resign. These data are publicly available, including some historical data such as previous annual returns, director resignations and so on, and currently are accessible via API.
We develop a Python library (currently under development with an early version available at Rees, 2021) to extract data from the Companies House public API. With an initial list of company IDs corresponding to each NPO, we use this library to query information about each institution and for data on all their board members. This then allows us to construct a two-mode (bimodal) board interlock network, where board members are one type of node and companies are the other. In bimodal networks, nodes of one type can only have connections to nodes of the other type. In this case, board members can only be connected to companies. To illustrate: if person A is a director on the boards of the National Theatre and Tate, then person A will have links in the network to each of the National Theatre and Tate. This demonstrates which institutions share board members, and by extension which groups of institutions are connected by board interlock. We then project both the network to a unimodal network of companies, in which two companies are connected when they share a director.
We extend this network by illustrating indirect ties: that is, when two organisations do not share a board member, but where there is a third (non-NPO) company on which board members from these organisations sit. For example, if the National Theatre and Tate did in fact not share a board member, but separate directors of each organisation both sat on the board of BAFTA, then they would have an indirect tie. This provides us with an alternative measure of the density of the network of NPOs. These non-NPO companies can therefore be any kind of company; in some cases, they are other arts organisations, whereas in others they are financial institutions, management consultancies or property developers.
We use three key additional pieces of information about each NPO. First, we query for the geographical locations of companies and charities using the postcodes included in the Companies House dataset and the postcodes.io service, which provides geospatial coordinates. This allows us to identify both a precise location and broader geographic region for each NPO. We then add information from ACE’s dataset on NPOs about the art form that each NPO is classified as – for example, theatre, dance and combined arts – and about the amount of portfolio funding each NPO receives over the 2018–2022 period. Adding this information allows us to distinguish between organisations in different parts of the country, working in different artforms, and with smaller and larger budgets.
Method
We begin by summarising the network of NPO companies: the number of NPOs connected to any other NPO, either directly or indirectly, and the distribution of components. Having done so, we visualise the network in arbitrary space using the ggraph package (Pedersen, 2020) first with the Fruchterman-Reingold algorithm, and then incorporating geographic information, visualising NPOs on a map and denoting shared board memberships as ties connecting these organisations in their respective parts of the country. This demonstrates both the overall density of the network, and the spatial patterning of shared board membership. In the case of the visualisation on a map, we weigh the ties according to the number of shared board members between locations. For example, if an individual is a board member of the Royal Opera House and Opera North, we would draw a single narrow line between London and Leeds; if four individuals were on both boards, the line would be thicker. By contrast, if an individual is a board member of the Royal Opera House and English National Opera, the edge would be shorter, connecting two ends of a 7-minute walk within Covent Garden, in the West End of London.
In the next stage, we group NPOs – and, by association, shared board memberships – into the geographic regions of England. This allows us to identify how many shared board memberships are within different regions, and how many are between them. We also group NPOs by their major art form, similarly allowing us to identify how many shared board memberships are between organisations of the same art form and those of different artforms – and, indeed, the interaction of these two characteristics.
Finally, using data on the total grant each NPO receives from ACE over the 2018–2022 funding period, we draw two comparisons. We first compare the distribution of grant income for companies that share board members with other NPOs with those that do not (isolates) for each of the different regions of England. Next, limiting our analysis to the NPOs outside London, we distinguish between those companies that share a board member with an NPO in London and those companies that share a board member with an NPO outside London, and compare the grant income of these groups.
Results
Figures 1 and 2 illustrate the organisations in Arts Council England’s national portfolio that are registered as companies as a network. In Figure 1, only direct ties are shown: NPOs that share board members are connected with each other. Figure 2 extends this by incorporating indirect ties. In this case, NPOs that share a board member are connected with a tie in black, while NPOs that are indirectly connected, where there is another (non-NPO) company on which board members from both NPOs sit, are connected with a tie in grey.

Network of NPO companies (direct ties).

Network of NPO companies (direct and indirect ties).
Figure 1 shows that there are relatively few NPOs that share board members with other NPOs. With a total of 735 NPOs in the network, and a total of 225 edges – cases where a board member is on the boards of two NPOs – this gives an overall density of 0.09% for the network. When we incorporate both indirect and direct ties, shown in Figure 2, the number of edges increases by 504 to a total of 729, with an overall density of 0.3%.
While these number may seem small, we should not expect a significantly higher density measure: an overall density of 100% would require every single NPO to share at least one board member with every other. What is more illuminating is the number of isolates, or institutions that do not share a board member with any other NPO, either directly or indirectly. Fifty-nine percent of companies are isolates when we only consider direct ties, while 41% of companies are isolates even incorporating indirect ties. Even beyond the isolates, 26% of NPOs only share a board member with a single other NPO, rather than being connected to several; incorporating indirect ties, this figure remains high at 17%. The largest component in the network of companies that are directly connected to one another is 29, visible towards the bottom-left of Figure 1.
This context is important for the remainder of the analysis. The analysis of shared board membership, how it differs across the areas and regions of England, across different artforms, and across organisations of different scales, is analysis of a relatively small set of shared board memberships – just 225, representing 41% of the NPOs registered as companies (themselves most, but not all, of the overall national portfolio). This highlights the importance of the shared board memberships that do exist, as they are within a fraction of the overall set of NPOs.
However, the fact that there are around twice as many indirect ties as direct ties reminds us that shared board membership between two NPOs is not the only way through which information can flow nor is it the only means through which geographic and financial imbalances can be reinforced or mitigated. For this reason, for each of the analytical steps that follows using the network of NPOs where edges are shared board memberships, we undertake the same analysis on the network that also incorporates indirect ties as a robustness check.
Figure 3 illustrates the network of NPOs where the projection is geographical: each NPO is denoted by a node in its geographical location, and where two NPOs share a board member, the edge connects the two locations. The nodes are illustrated in white at 95% transparency; locations with single NPOs are therefore barely perceptible, while areas with 20 or more NPOs appear solid white. Edges are also illustrated in white, but at 80% transparency, so where there are two locations with five pairs of organisations that share board members, the lines are solid white, while lines connecting pairs of locations with a single shared board member across all the institutions in each are fainter. We include a base map of England for reference, with boundaries between different regions.
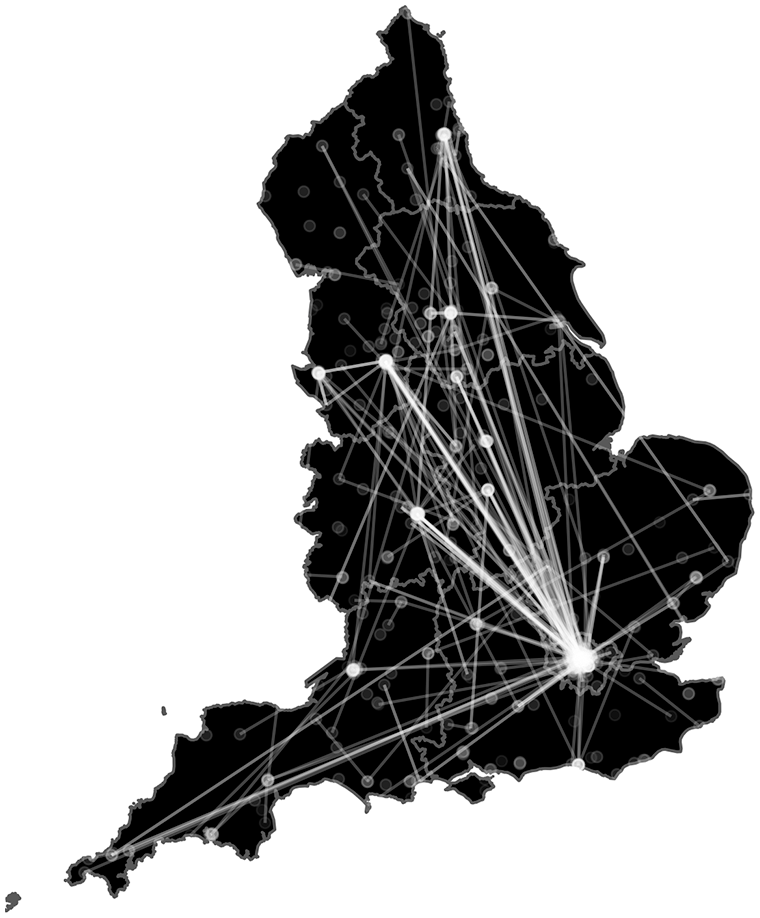
Network of NPOs (projected in geographic space).
Figure 3 illustrates a hub-and-spoke model (as in Messamore, 2021). There is a large number of edges between London and other cities, while there are fewer edges between locations outside of London. Institutions in Birmingham, Manchester, Leeds and Newcastle all share a large number of board members with London institutions. What is more significant is the relatively small number of edges between non-London cities. This is most vividly illustrated by the fact that there is not a single trustee or director who sits on the boards of institutions in both Leeds and Manchester – the two largest cities in the North of England, just 36 miles apart – but there are significant numbers of shared directors across NPOs in both Leeds and London, and in both Manchester and London.
One limitation of this presentation is that it only illustrates bridges between institutions in different areas, rather than within them: we can see a bridge between Hull Truck and Leeds Theatre Trust, but not Liverpool Biennial of Contemporary Art and the Royal Court Theatre in Liverpool. We therefore summarise the information in Figures 3–5. Here, we group NPOs according to their region of England. This allows us to demonstrate the number of edges between different regions of the country more clearly – for example, the overall number of shared directorships between NPOs in Yorkshire and the North West – as well as illustrating the number of edges within regions, such as the number of shared directorships between different London institutions. In the left-hand pane of Figure 4, the width of edges corresponds to the number of ties between the regions in question, while the right-hand pane reports the number of within-region ties in each region; Figure 5 reports the same information as a table.
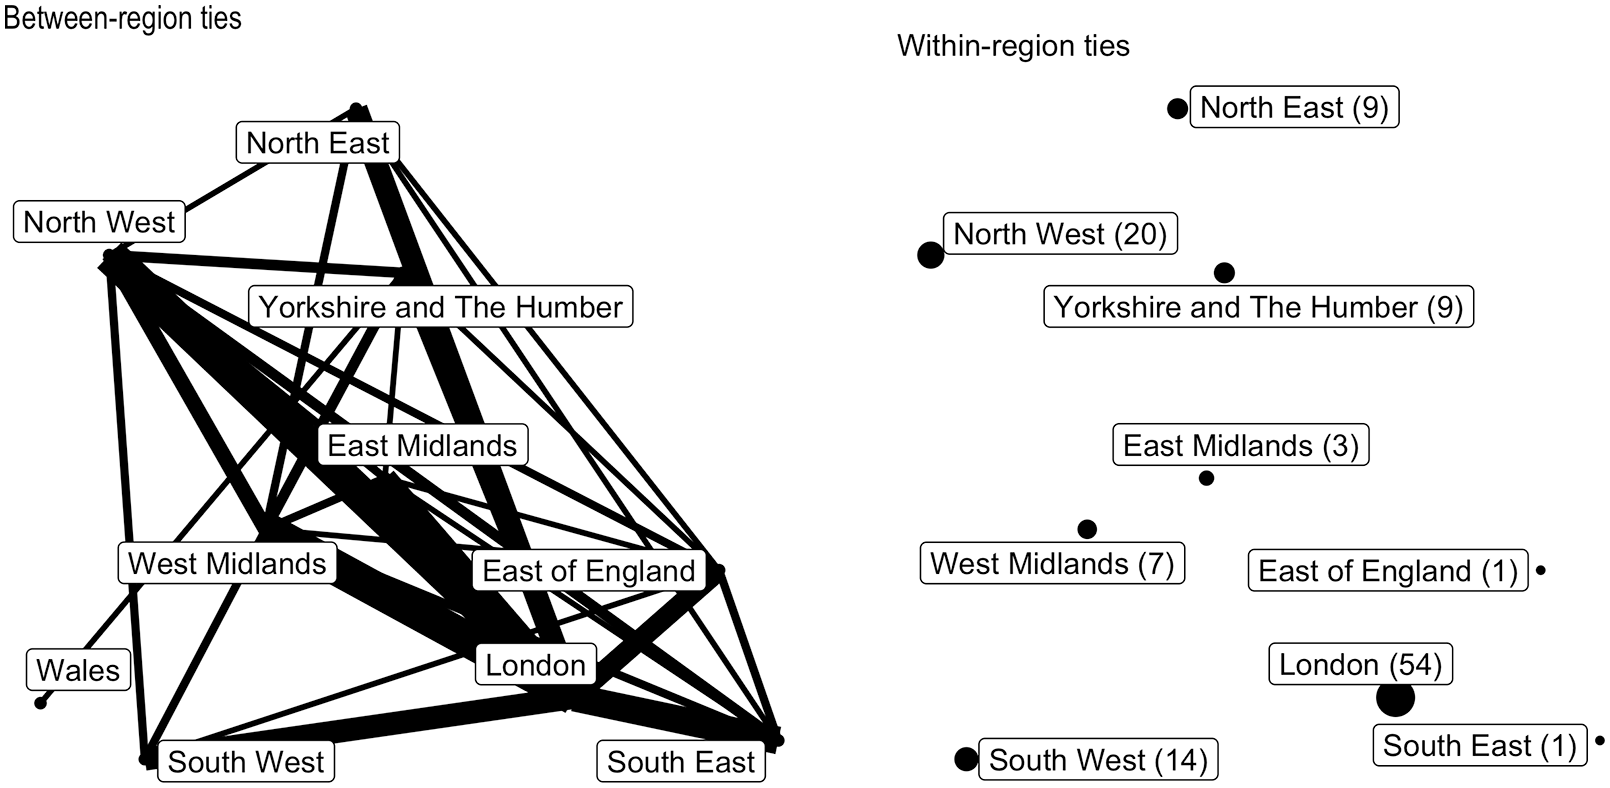
Within- and between-region ties (spatial).
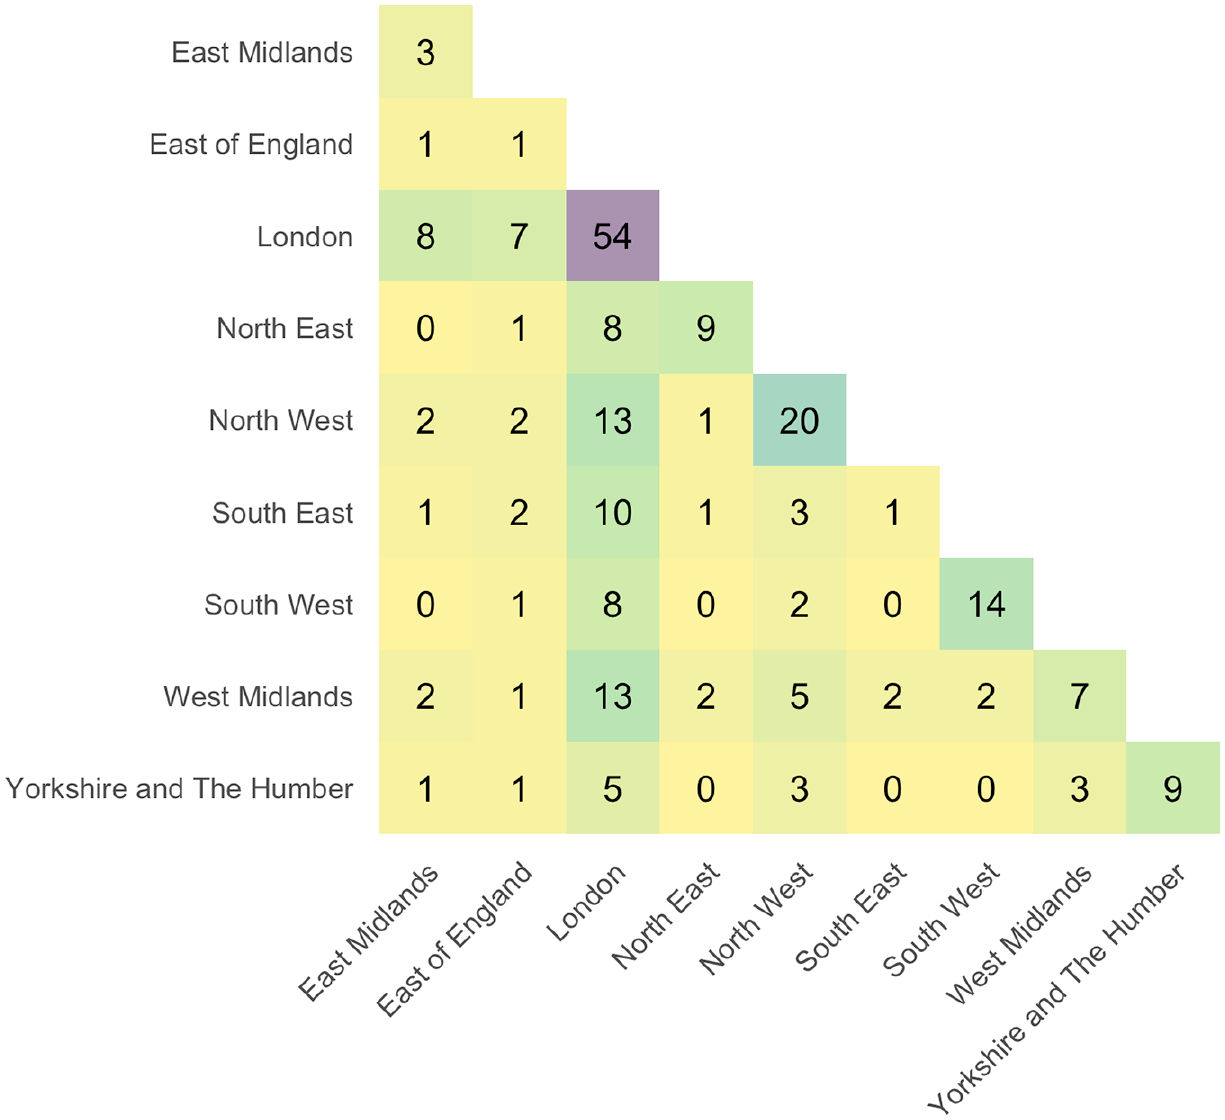
Within- and between-region ties (table).
Figures 4 and 5 provide further evidence for the hub-and-spoke model introduced in Figure 3. The left-hand pane of Figure 4 illustrates the large number of shared directorships between institutions in London and other parts of the country; Figure 5 demonstrates that, of the 111 total number of shared board memberships between institutions in different regions of England, 72 of them – almost two thirds – include London-based institutions. (Wales appears because ACE jointly supports a very small number of companies along with Arts Council Wales: in this case, the Welsh National Opera shares a board member with a company in Yorkshire & the Humber).
The dominance of London, where between-region ties are significantly more likely than not to include a London-based institution, cannot be explained by areas’ proximity to London. The two regions that border London – the South East, and the East of England – each host 9 NPOs that share directors with London NPOs, out of 19 and 16 total between-region ties respectively. By contrast, for 8 of the 13 institutions in the North East that share board members with other NPOs, those other NPOs are in London. This dominance therefore extends beyond a large number of NPOs being in London, and board members of those NPOs also being likely to be on boards of nearby institutions; the dominance is no more pronounced in nearby regions.
The right-hand pane in Figure 4 and the diagonal in Figure 5 add to the information already presented by demonstrating the number of within-region ties, as well as between-region ties. The dominance of London in shared board memberships demonstrated by between-region ties is only extended by within-region ties, with 54 of 118 within-region ties occurring where two London NPOs share a board member. This figure, corresponding to 46% of within-region shared board memberships, can be compared with the 34% of NPOs registered as companies in the dataset that are based in London.
These results therefore demonstrate the dominance of London in shared board memberships in Arts Council England’s national portfolio, over and above the well-established dominance of London in that same national portfolio.
This centralisation can be compared with the numbers of NPOs in different regions, and the funding that different regions receive. Among the dataset of NPOs in Companies House, 250 (or 34%) are in London, receiving a total of 45% of portfolio funding. The share of shared directorships including London-based organisations is even more concentrated than those already-unequal measures, at 46% of within-region ties and 65% of between-region ties.
Supplemental Appendices A4 and A5 show that the pattern is almost identical when indirect ties are incorporated. 46% of within-region direct ties are between London-based institutions; the equivalent figure is 48% incorporating indirect ties. Among between-region ties, the fraction incorporating London is 65% whether indirect ties are included or excluded.
However, not all NPOs are equivalent. We might not expect similar patterns across different artforms, and it may be that there are some artforms where NPOs are particularly likely to share board members. For example, if theatres are more likely than other NPOs to share board members with other NPOs (and, particularly, other theatres), and London’s share of NPOs skews more towards theatres than other types of organisations, this could go some way to explaining a large number of ties including London. Beyond this, in most discourses, the dominance of London is not measured through the number of NPOs situated there, but through the amount of money awarded to (often high-profile) London-based institutions.
Figure 6 shows the number of shared board memberships within and between NPOs of different artforms, with the classifications derived from ACE’s data on its own NPOs.
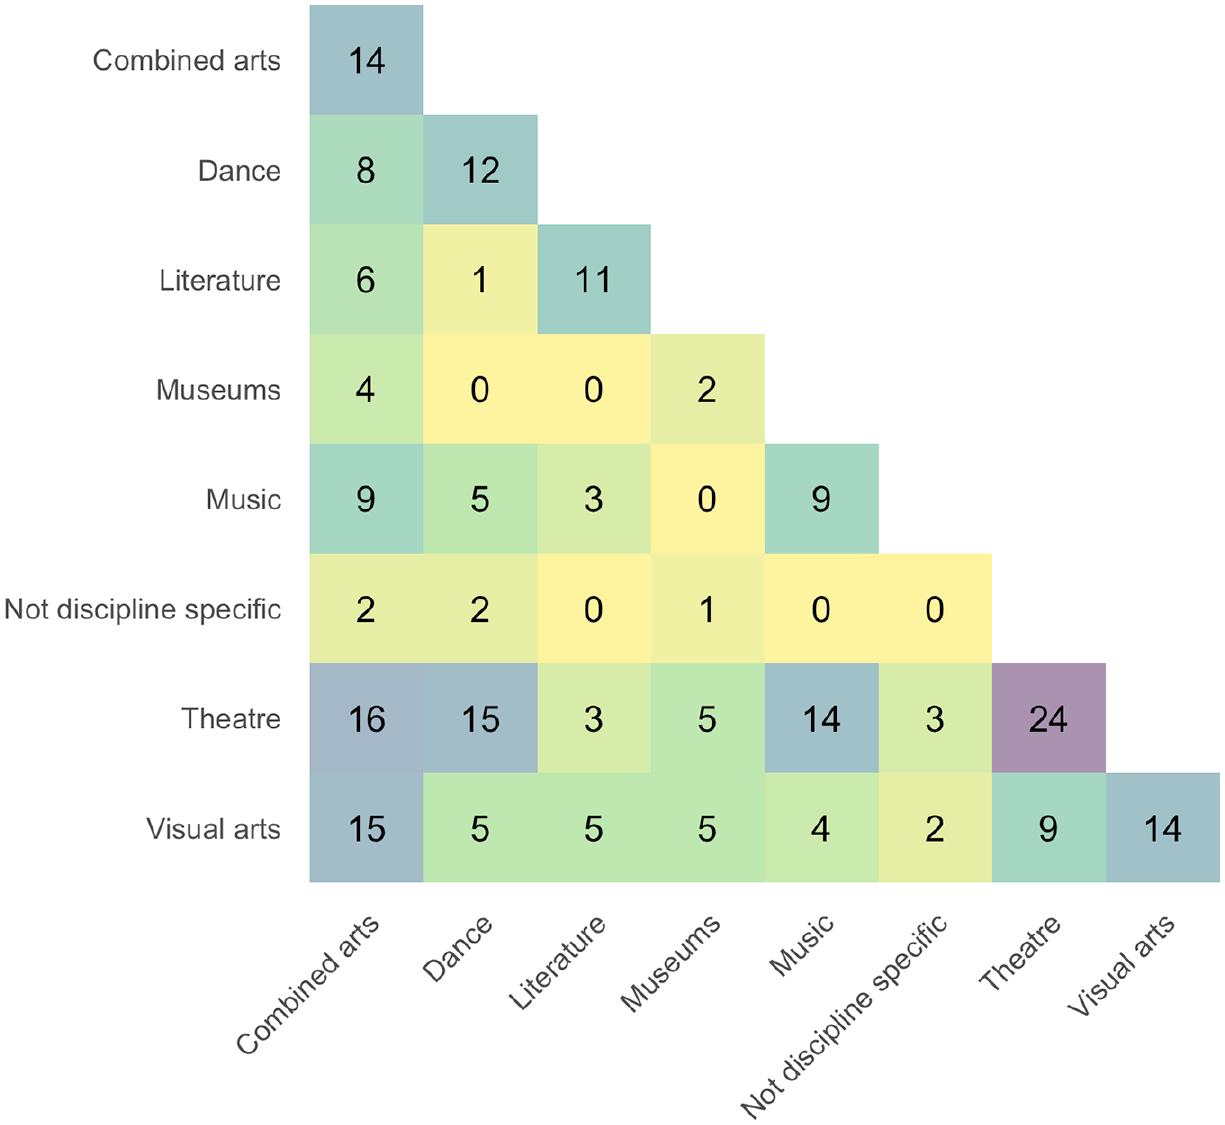
Within- and between-art form ties.
Where two NPOs share a board member, it is more common for those NPOs to be in different artforms than the same one, with 38% of edges within the same artform. Indeed, a slightly larger number of edges include theatre – whether theatres are connected to NPOs of other artforms, or to other theatres – than pairs of NPOs from the same artform (89, compared with 86). Once again, this pattern is echoed when indirect ties are incorporated (per Supplemental Appendix A6), where the equivalent figures are 31% and 55%.
Other than theatres, the artform with the most NPOs with shared board membership with other NPOs is ‘combined arts’, with 74 ties. This is a broad category, including organisations that present work from a number of the other artforms on the list, such as Barbican and Greater Manchester Arts Centre. Because of this, it is unsurprising that there is this amount of overlap. However, theatre is by far the artform with the most shared ties: more than 10% of shared ties across all NPOs are between theatre NPOs, and, for all artforms other than the literature and visual arts, NPOs are more likely to share a board member with a theatre NPO than an NPO of their own artform.
These different shared board memberships, where a given individual sits on the board of different NPOs, do not necessarily have similar characteristics, with different motivations and behaviours for those people bridging organisations. One model may consist of key figures in a given geographical community potentially sitting on the boards of several organisations locally with different focuses: for example, someone sitting on the board of an art gallery and a theatre within the same city. Another may be key figures in given artistic, as opposed to geographic communities sitting on the boards of different organisations in different parts of the country, but with similar artistic focuses: for example, someone sitting on the boards of art galleries in different cities. Figure 7 shows the number of within- and between-artform ties that are also within- and between-region.
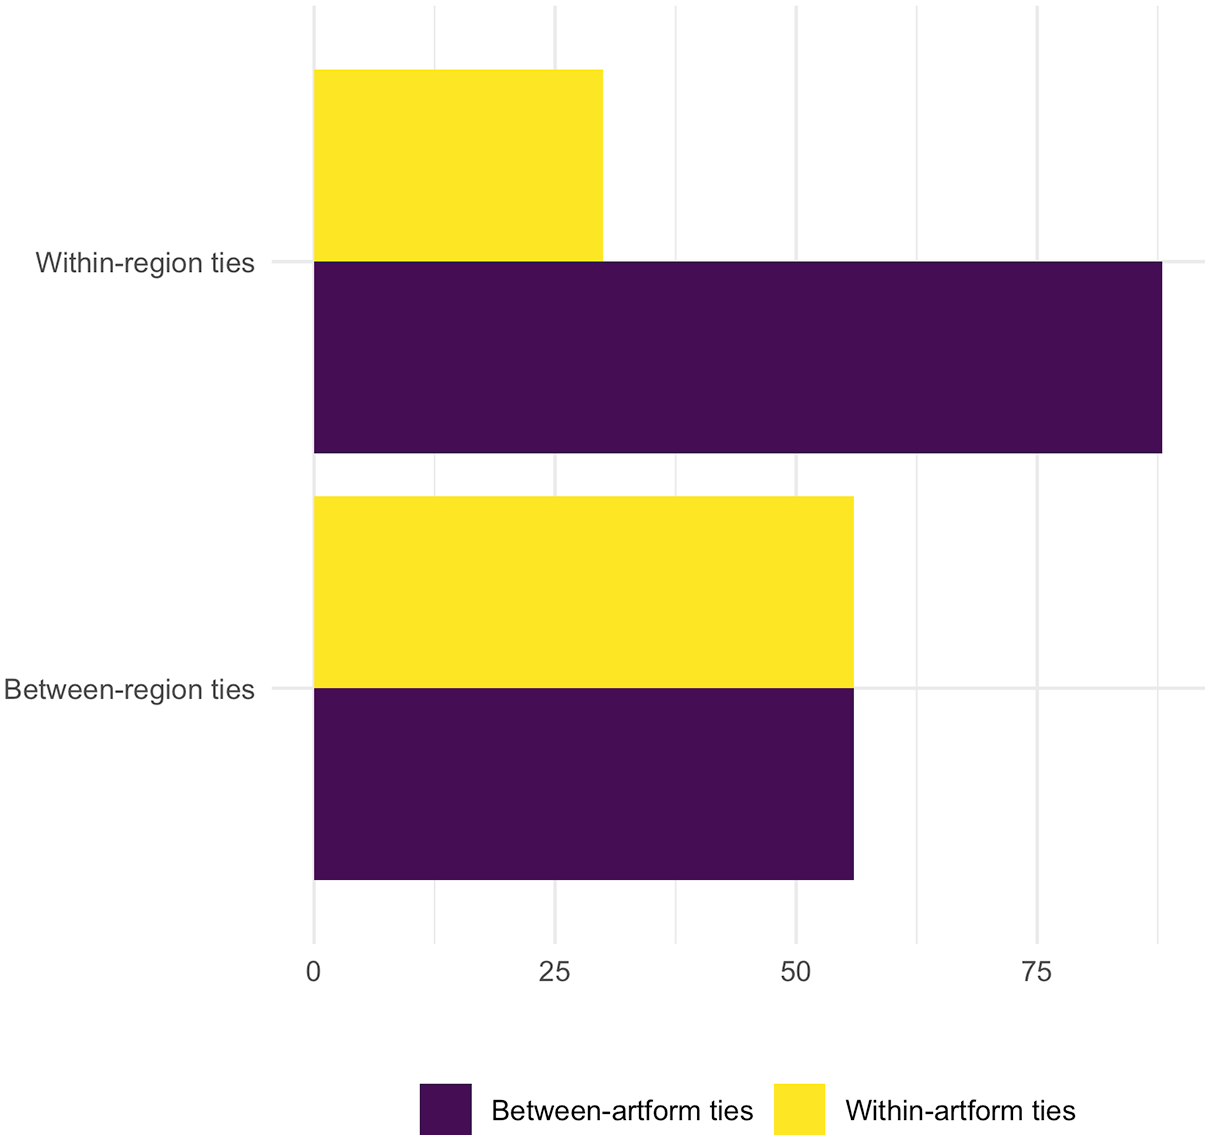
Relationship between region and artform ties.
Figure 7 shows that a large majority of within-region ties are between-artform ties, while there are equal numbers of between-region ties and between- and within-artform ties. While not all between-artform ties are created equal – it is unsurprising to see a specialist in governing theatre bridging theatre and combined arts, while there is only one case of a director bridging dance and literature NPOs – this provides support for the account wherein within-region ties are more likely to consist of key figures of a given location who are on the boards of organisations with different artistic missions, while between-region ties tend to consist of key figures within a given artistic community. These patterns differ when indirect ties are incorporated (Supplemental Appendix A7): in that case, 26% of within-region ties are within-artform ties, while 35% of between-region ties are within-artform ties. However, while the differences are smaller, the direction is the same as when only direct ties are incorporated.
Our final sets of results in this section incorporate information about NPOs’ portfolio grants. The national portfolio is a broad church, with organisations receiving from £40,000 a year to £24 million a year. This variation among NPOs is likely to correspond to variation among shared board memberships, with directors who are experienced at governing organisations within a given art form, or who are well-connected into a local area with corresponding access to civic infrastructure, being more common among larger, better-funded organisations.
Figure 8 presents the distributions of total portfolio grant income over the entire 2018–2022 period for each of the regions of England. The orange curve denotes the distribution for NPOs that do not share a board member with any other NPO, while the green curve denotes the distribution for NPOs with a shared board member with at least one other NPO. The x-axes in each case are on log scales, and the dashed lines denote the mean for the relevant groups.
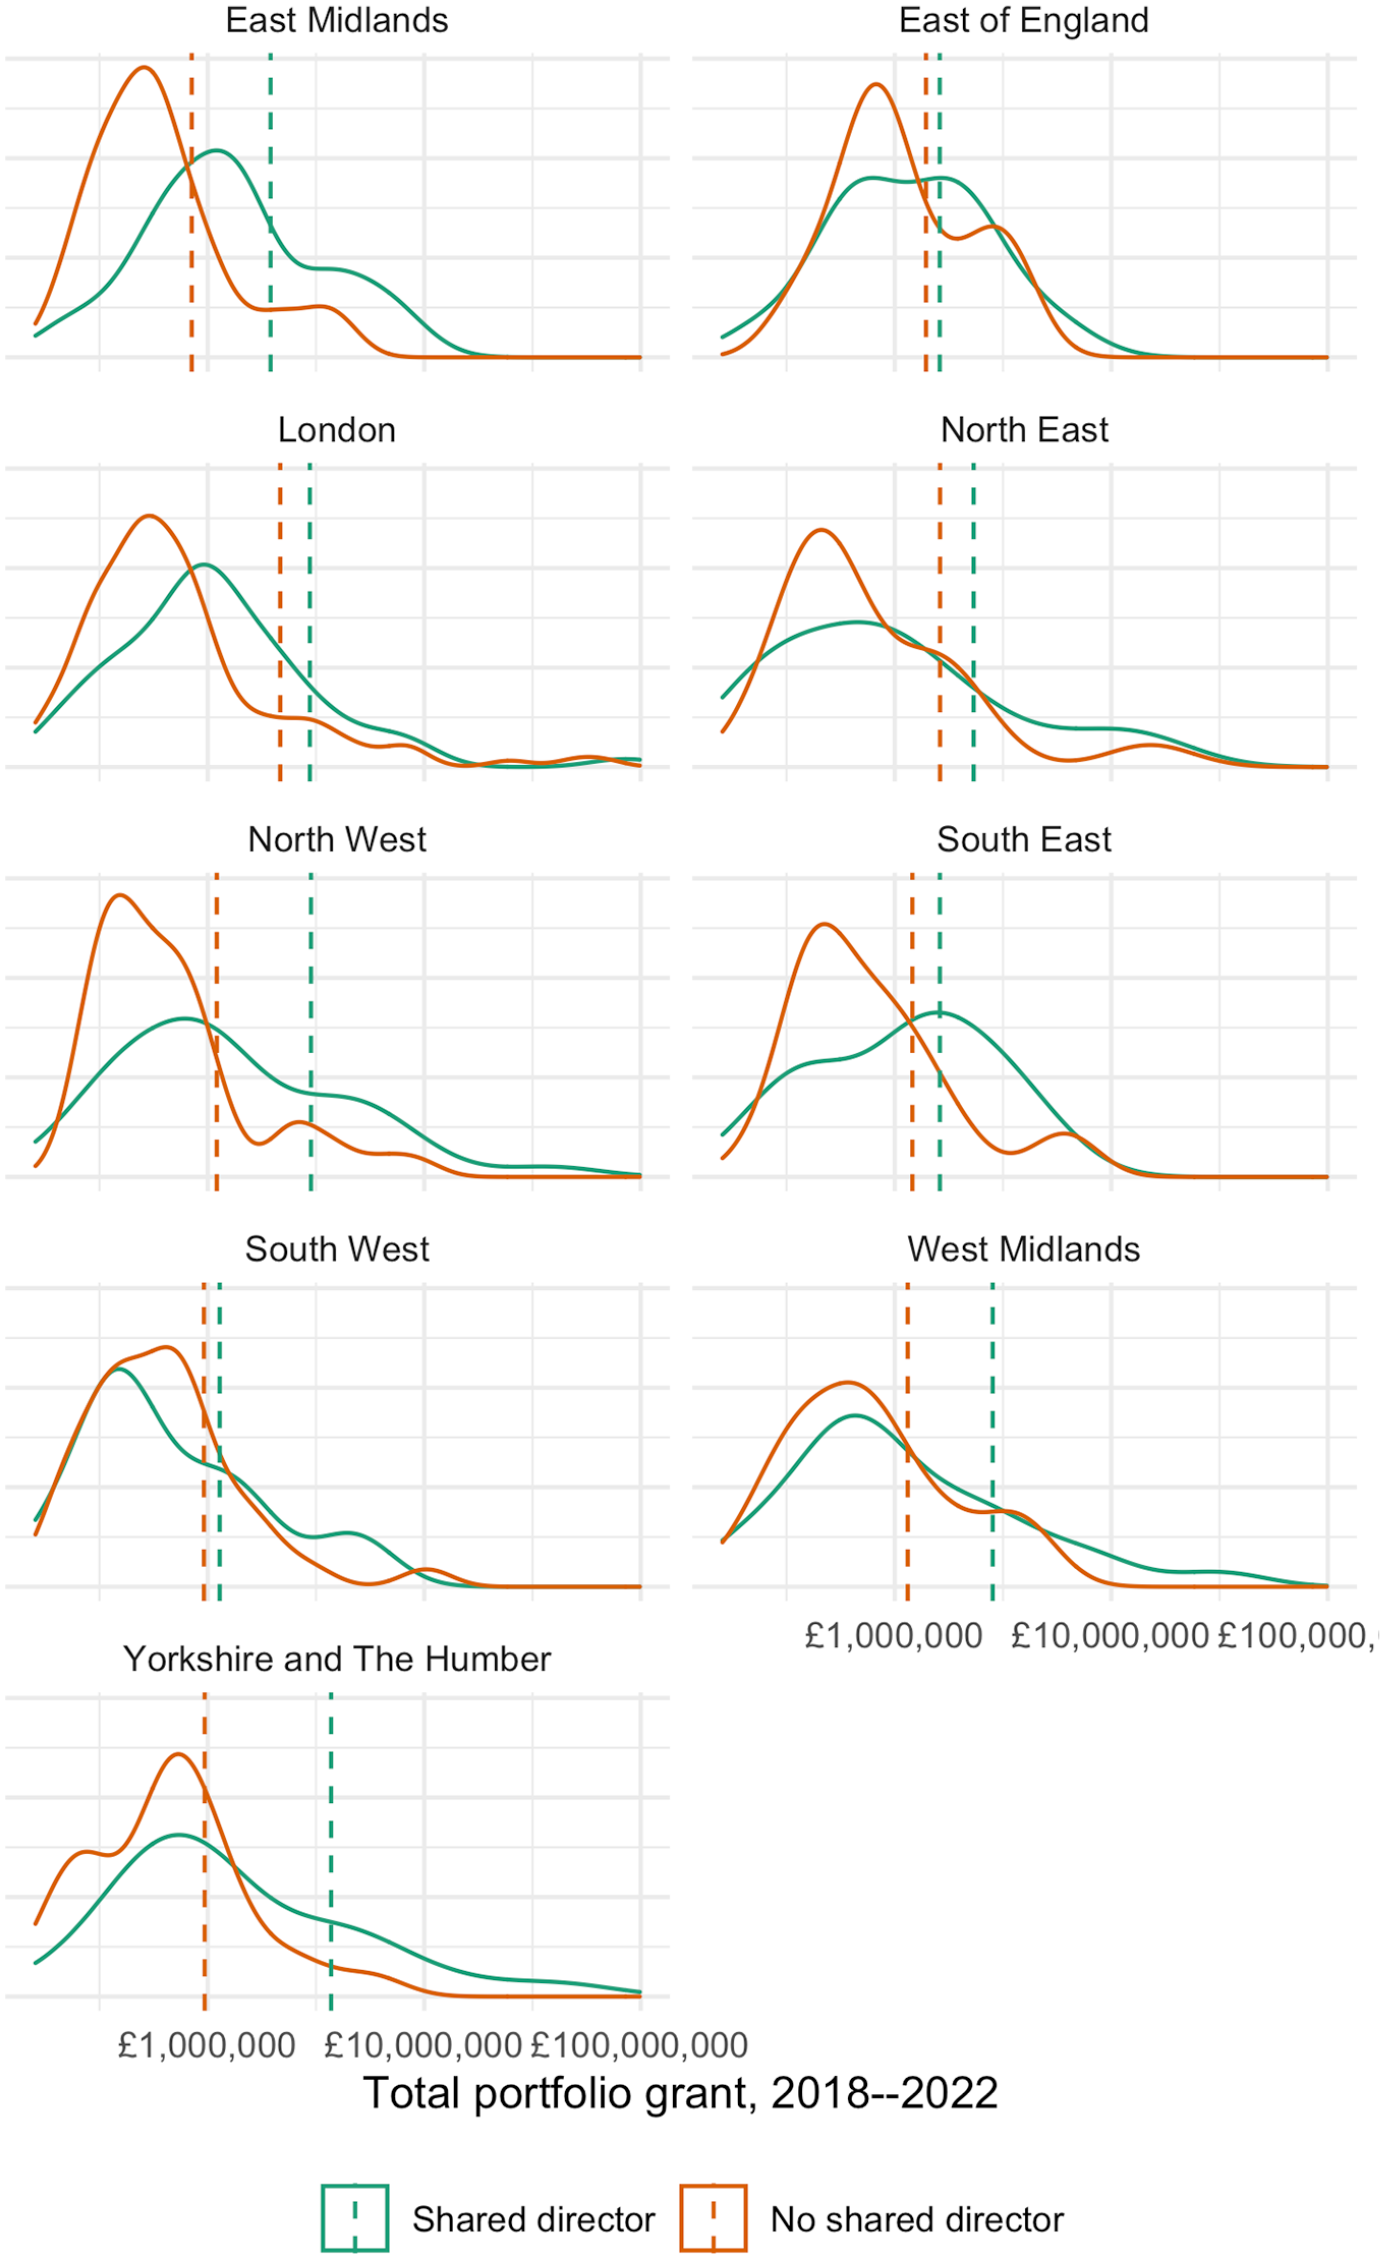
Distribution of total portfolio grants (2018–2022) in each region of England.
Figure 8 shows that, for all regions of England, NPOs that share a board member with any other NPO have, on average, greater income than NPOs that do not share board members with any other. However, there are significant differences between regions. The differences are smallest in the East of England and the South West, moderate in London, the South East and the North East, and most pronounced in the Midlands, North West and Yorkshire. Two of the three regions in the North of England, and both regions of the Midlands, are therefore the groups where these differences are most pronounced; in the South (including London), these differences are smaller. While the North East is an outlier, this raises questions once again about the importance of London: it may be that the differences in the Midlands and the North of England are so large because the crucial differences are in fact between institutions that share a board member with a London institution, and those institutions that do not. We should note that this outlier does not persist when we take indirect ties into account: in that case, the differences among North East-based institutions are as large as among Midlands, North West and Yorkshire and the Humber-based institutions (Supplemental Appendix A8).
For this reason, we also present Figure 9. Figure 9 shows distribution of the total portfolio grants from 2018 to 2022 for all NPOs outside of London, broken into three groups. The first distribution, in purple, is for NPOs that do not share a board member with any other NPO; the second distribution, in orange, is for NPOs that share a board member with an NPO outside of London, while the third distribution, in green, is for NPOs that share a board member with a London-based NPO.
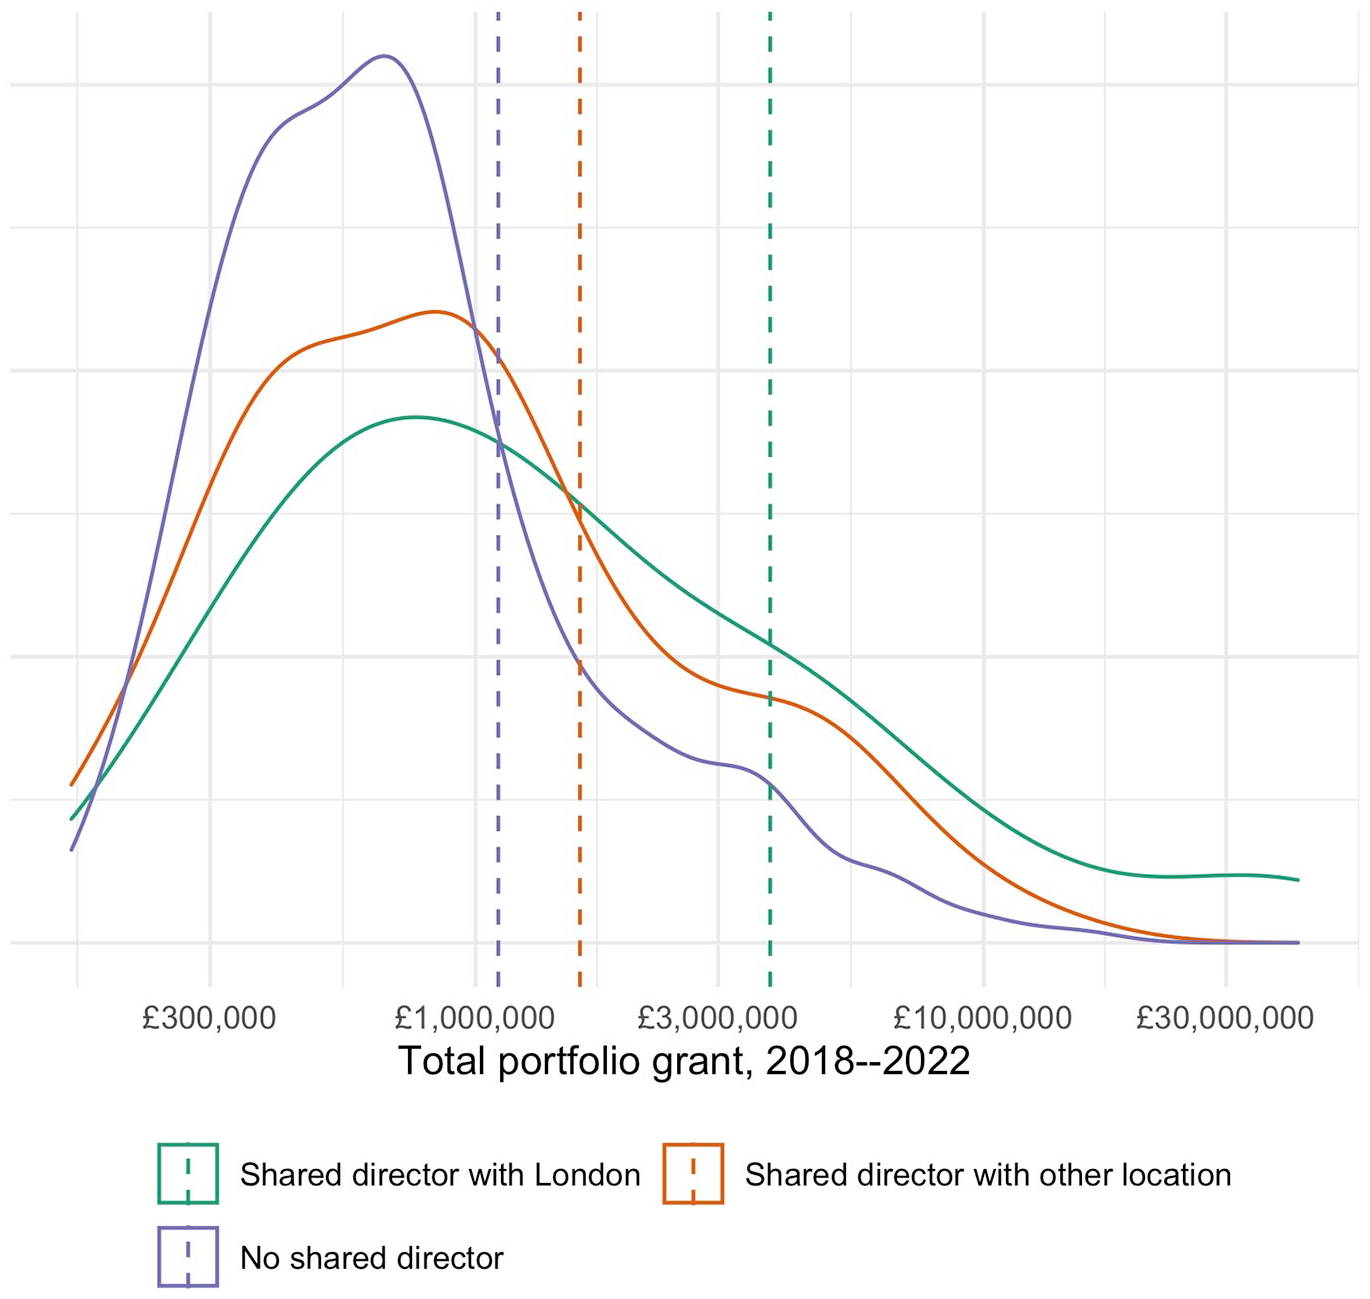
Distribution of total portfolio grant (2018–2022), London-based institutions excluded.
Figure 9 reinforces the finding, demonstrated in Figure 8, that NPOs with no shared board members with any other NPO receive, on average, a smaller portfolio grant from ACE than NPOs that do share board members with other NPOs. However, Figure 8 also shows that there is a larger difference between organisations who share board members with institutions inside and outside of London than between institutions that share board members at all and those that do not. Among isolates, the average portfolio grant over the period is £1.1 million, compared with £1.6 million for NPOs sharing board members with non-London NPOs, and £3.8 million for NPOs sharing board members with London-based NPOs. As Supplemental Appendix A9 shows, these patterns are almost identical when indirect ties are incorporated.
There are several potential interpretations of this finding. One is that board members that bridge institutions inside and outside of London are more effective board members. This may lead to stronger organisations which produce more compelling grant applications, whether due to board members’ skill in writing or their more general strengthening of these institutions. Another is that institutions that are in receipt of larger grants are more able to recruit board members from London-based institutions. Research in American non-profits suggests that organisations with better network connectedness receive significantly more income from foundations, net of organisational size and track record (Faulk et al., 2016), and that the mechanism may be that larger organisations have more well-connected boards, providing advantages in the grant marketplace (Paarlberg et al., 2020). Given this, it is important to reinforce that this is not a causal claim: adding a director from a London-based institution is unlikely to lead to an increase in Arts Council funding. What is more striking in this case is the difference between shared directors inside and outside of London; this may be reflective of the trend for greater grant success for organisations based closer to funders (Ashley and Faulk, 2010), or, in this case, for board members closer to funders.
Discussion and conclusion: why geography matters for understanding arts governance in England
Taken together, this set of results tells a clear story pointing towards London. London-based institutions are more likely to share board members with other organisations than organisations outside of London, with an effect over and above the large proportion of NPOs that are based in London in the first place; London-based NPOs are more likely to share board members with other London-based NPOs and with NPOs based elsewhere, and this is even more pronounced for regions more distant from London; the imbalance towards London-based NPOs is greater than the imbalance towards NPOs of any given artform, with connections between NPOs of the same artform being largely driven by London-based organisations; and the NPOs outside of London which are most likely to share board members with London-based organisations have significantly larger portfolio income than those that do not, whether they share board members with non-London NPOs, or with no NPOs at all. While the national portfolio may not be as focussed on London as in previous cycles in terms of overall spending, when we address governance as a measure of power, London remains clearly at the heart of the arts sector in England. These imbalances are consistent across a range of measures, and robust to whether we only consider shared board memberships between NPOs, or whether we also incorporate indirect ties, where board members from two NPOs are on the board of a third non-NPO company.
Institutions outside of London are less likely to share board members with any other NPOs, and so are less likely to have the same access to information about the governance of arts organisations at the board level. Existing research (such as Mizruchi, 1996) which shows that institutions which share board members with similar institutions tend to perform better on a range of metrics is particularly important here. We have further demonstrated that, where institutions outside of London do share board members with other NPOs, they are more likely to share board members with institutions in London.
While money may have moved outside London, power has not. The new structure of arts governance in the English publicly-funded sector is one where the most important connections are either between London-based institutions, or between London and other cities. The redistribution of institutions outside the capital has not accompanied a redistribution of governance, rather the other key cities remain connected to the capital rather than each other. This reinforces the dominant role of London and raises questions about whether the reallocation of funding alone is sufficient to address the inequalities within publicly supported culture. Moreover, the cultural dominance of London demonstrated by our analysis is matched by London’s social, economic and political dominance of the British state. Broader social inequalities within the English state thus account for the lack of relationships between local cultural and local political, social, and economic elites on arts boards; the unequal geography of the British state is also another aspect of the need to go beyond just changes in funding, towards a more general transformation of government and society as the basis for a more equal arts sector.
There are several limitations to the analysis. Our analysis focuses on the 41% of NPOs which share a board member with other NPOs; the modal Arts Council-funded organisation does not share a board member with another one, although our analysis shows that this is not evenly distributed across the organisational scale. In focussing on shared directorships and quantitative measures of organisation size, our analysis is outside the boardroom: we have not adopted the qualitative perspectives used by a number of researchers in this area, such as Azmat and Rentschler (2017). In addition, as Cornforth (2012) argues, there is more to governance than boards; our focus here on arts boards excludes discussion of wider governance processes. Taken together, along with the question of the direction of the relationship between shared board memberships with London-based institutions and the size of Arts Council England’s grants, this means that our analysis should be taken as descriptive, rather than implying causality.
At the same time, the descriptive results we have presented extend our understanding of the social and spatial distribution of arts funding. Existing research which demonstrates the extent to which cultural funding is disproportionately London-focussed, if anything, may not go far enough. The dominance of London is, as we have shown, hardwired into how the cultural sector is governed in England.
Understanding this point is only possible by understanding the two literature – on urban and regional understandings of the cultural economy and on governance and boards in the cultural sector – that have framed our analysis. It is here where this article makes its substantive contribution.
The spatial concentration of power in London has important implications for the literature on culture-led regeneration, specific that which has been critical of artistic and cultural organisations as anchor institutions for (cultural) economic development. As we noted above, while money may be flowing out to the ‘regions’ in England, the anchor institutions in those places are still shaped by the centralised, and London-centric, nature of the state. For a genuinely transformative role for the arts at the urban and regional level to be realised, we need a much more substantive social and economic transformation in England.
Alongside the importance of understanding boards and governance to the regional cultural economy literature, the analysis also shows how geography can be an important lens through which to understand boards and governance. In particular, our analysis adds a new, spatial- lens through which to see inequalities on arts boards. Just as the exclusions by demographic and occupational groups are a cause for concern in the literature on arts boards, our work suggests where board members are drawn from, and if there is a dominance of a single city or region, should be a new question for future work on arts and cultural governance.
Finally, beyond the substantive findings, this article also provides a significant methodological development in the shape of the Python package for extracting geocoded network data from Companies House and the Charity Commission. This package provides major opportunities for the research community interested in network structure in governance, whether in the creative economy, in another sector or sectors or across companies and charities in general. While this article applies these techniques to the creative economy specifically, the contribution to scholarship that this package provides is much broader.
Supplemental Material
sj-docx-1-eur-10.1177_09697764221113750 – Supplemental material for Cultural governance within and across cities and regions: Evidence from the English publicly funded arts sector
Supplemental material, sj-docx-1-eur-10.1177_09697764221113750 for Cultural governance within and across cities and regions: Evidence from the English publicly funded arts sector by Dave O’Brien, Griffith Rees and Mark Taylor in European Urban and Regional Studies
Footnotes
Author contributions
Rees has led on data curation and software, and Taylor has led on conceptualisation, methodology, analysis and visualisation. O’Brien and Taylor are responsible for the write-up of the research.
Declaration of conflicting interests
The author(s) declared no potential conflicts of interest with respect to the research, authorship and/or publication of this article.
Funding
The author(s) disclosed receipt of the following financial support for the research, authorship and/or publication of this article: This work was supported by the UK Arts and Humanities Research Council (grant reference AH/S004483/1).
Supplemental material
Supplemental material for this article is available online.
References
Supplementary Material
Please find the following supplemental material available below.
For Open Access articles published under a Creative Commons License, all supplemental material carries the same license as the article it is associated with.
For non-Open Access articles published, all supplemental material carries a non-exclusive license, and permission requests for re-use of supplemental material or any part of supplemental material shall be sent directly to the copyright owner as specified in the copyright notice associated with the article.