
Abstract
Objectives
To compare abdominal aortic aneurysm screening outcomes of men with non-visualized aorta at original scan with subsequent scans and to determine predictors of non-visualized aorta.
Methods
In the Northern Ireland Abdominal Aortic Aneurysm screening programme, outcomes (discharge, annual surveillance, three-monthly surveillance, or vascular referral) and patient and programme characteristics (age, deprivation quintile, family history, technician experience, and screening location) for men with non-visualized aorta were investigated at original scan, and first and second rescans.
Results
Non-visualized aorta proportions were 2.9, 11.4, and 4.7% at original, first, and second rescan, respectively. There were no differences in screening outcomes between scanning stages (98.4, 97.6, and 97.4% <3 cm). There were 42 men (0.13%) with aortas ≥5.5 cm at original scan, but none at first and second rescan. A significantly greater proportion with non-visualized aorta were from more deprived (5.0%) than less deprived areas (1.7%). Deprivation quintile and staff role were significant independent non-visualized aorta predictors at original scan, and staff role at first rescan. Men from less deprived areas were three times as likely to have aortas visualized than those from more deprived areas (OR = 3.0, CI = 2.4–3.8) at original scan. A man scanned by screening technician compared with lead sonographer was 51% less likely to have aorta visualized at original scan and 94% less likely at first rescan.
Conclusions
The risk of abdominal aortic aneurysm in men with non-visualized aorta on first or subsequent rescans is no more than for those with visualized aorta on original scanning. Men from deprived areas are much more likely to have non-visualized aorta at original scan.
Introduction
The Northern Ireland (NI) abdominal aortic aneurysm (AAA) population-based screening programme, launched in June 2012, 1 aims to reduce aneurysm-related mortality through early detection, appropriate monitoring, and treatment. 2 Men are invited to attend in their 65th year, and those over age 65 who have not previously been screened can self-refer. The screening procedure aims to determine the maximum anterior–posterior diameter of the aorta, in both longitudinal and transverse planes from inner to inner wall measured by ultrasound scan. Men found to have a small- (3.0–4.4 cm) or medium- (4.5–5.4 cm) sized aneurysm are offered annual or three monthly surveillance, respectively. Men with a large aneurysm (≥5.5 cm) are referred to the vascular service for further diagnosis and treatment. Adequate visualization occurs when the entire infrarenal abdominal aorta is visualized in transverse and longitudinal planes, but occasionally the aorta cannot be adequately visualized: non-visualized aorta (NVA). In NI those with NVA on original scanning are rescanned within the national programme (unless recent relevant imaging is available). Recently published Public Health England pathway standards for the NHS Abdominal Aortic Aneurysm Screening Programme (NAAASP) recommend an acceptable threshold for NVA as 3%, and an achievable threshold as 1%. 2 High NVA rates may be due to training or equipment issues, or may relate to the population screened. 2 However, there are no published figures on the NVA proportions as part of a screening programme, or subject and programme characteristics associated with NVA. We here aim to compare the outcomes (discharge, annual surveillance, three-monthly surveillance, or vascular referral) of men with NVA at first and second rescan with those at original scanning, and to determine if age, deprivation quintile, family history, technician experience, and screening location are independent predictors of NVA at original scan and at first and second rescan.
Methods
Data for subjects screened in the NI AAA screening programme from 18 June 2012 to 5 April 2016 were extracted from the national AAA database (SMaRT, Northgate Public Services). The programme uses a community-based model delivered by a multi-disciplinary team. Seven screening technicians, trained to nationally approved and accredited standards, travel with portable ultrasound scanners to 22 clinic locations, including health and well-being centres and community hospitals. The programme has robust internal quality assurance processes for image assessment, including monthly random sampling of each technician’s images. The programme’s Lead Screening Sonographer (LSS) (DK), a radiographer, is responsible for training, clinical supervision, and quality assurance of technicians. The LSS reviews all NVA images and decides if men are suitable for rescan by technician or LSS. The LSS, together with Imaging Lead (Consultant Radiologist (PE)), operates a monthly hospital-based clinic for men whose aortas were considered difficult to scan. This clinic uses sophisticated equipment (Philips IU22 using C5-1 transducer) and techniques (coronal scanning and scanning with men in decubitus position) that fall beyond the scope of practice of screening technicians. The original scan and first rescan are usually performed at a peripheral clinic by a screening technician with portable ultrasound equipment (GE Logiq e); second and third rescans are generally performed by the LSS at the regional unit using a Philips IU22 scanner. A small number of men, who report significant mobility or health problems, have their original scan performed by the LSS either at the regional unit using a Philips IU22 scanner or the peripheral unit using portable ultrasound. For all NVAs, the LSS reviews comments recorded (e.g. very large body habitus, complex mobility, or medical problems) and special requirements (e.g. men who refuse to travel to the regional unit), and advises on all rescans, which can be performed in a peripheral unit using portable ultrasound by either a screening technician or LSS, or in the regional unit by the LSS and/or Imaging Lead using a Philips IU22 scanner. Rescans are performed within three months of previous scans at peripheral clinics and within two months of previous scans at the regional clinic. Men are advised to fast before all rescans.
Screening outcomes were categorized as discharge (<3.0 cm), annual surveillance (3.0–4.4 cm), three monthly surveillance (4.5–5.4 cm), or vascular referral for assessment for surgery (≥5.5 cm). Age was recorded at the time of original scan. Socio-economic status was quantified using the NI multiple deprivation measure. 3 Subjects were assigned to deprivation quintiles according to postcode, ranging from quintile 1 (most deprived) to quintile 5 (least deprived). Family history was reported as positive, negative, not known, or unrecorded. Screening staff were categorized as screening technician or radiographer. Screening location was categorized as regional imaging centre or peripheral screening unit. Comments recorded on the database were searched for bowel gas and/or body habitus, the most common reasons recorded for NVA. As this study involved audit and service evaluation research ethics committee approval was not required.
Chi-squared tests were used to assess differences in screening outcome and categorical data (deprivation quintile, staff role, and scanning location) at scanning stages. T-tests assessed differences in continuous data (age) between visualized and non-visualized data at screening stages. Multiple logistic regression analysis was used to investigate independent predictors of visualization status for each screening stage, and p < 0.05 was considered significant. Analysis was performed using SPSS version 19.0 (IBM Corp, Armonk, NY).
Multiple Deprivation Measure data were unavailable for 250 men (0.8%). Men with final screening outcome unknown were excluded from regression analysis. Reasons for final screening outcome were unavailable included men who did not attend further screening (i.e. failed to attend having received at least three invitations and/or verbally declined to attend; n = 29), men who, following an NVA, died before further scanning (n = 4) and men awaiting rescanning (n = 3).
Results
The numbers of subjects tested at each scanning stage are shown in Figure 1. Of 32,652 men initially scanned, there were 946 (2.9%) NVA. Following original scan, 18 men declined to attend, six did not attend, and four died before rescanning. Three men were awaiting rescanning. There were 168 men with relevant, recent (within last two years) imaging which included the entire infrarenal abdominal aorta, meaning 747 men attended first rescan. Of these, there were 85 (11.4%) NVA. At second rescan NVA occurred in four of 85 men (4.7%). Following second rescan, four men declined to attend, and one did not attend. The aorta was visualized in all four men attending third rescan. The aorta of one man could not be visualized following original scan and rescanning at the regional centre by the consultant radiologist (PE).
Schematic of flow of men through the screening stages, with screening outcomes at each stage.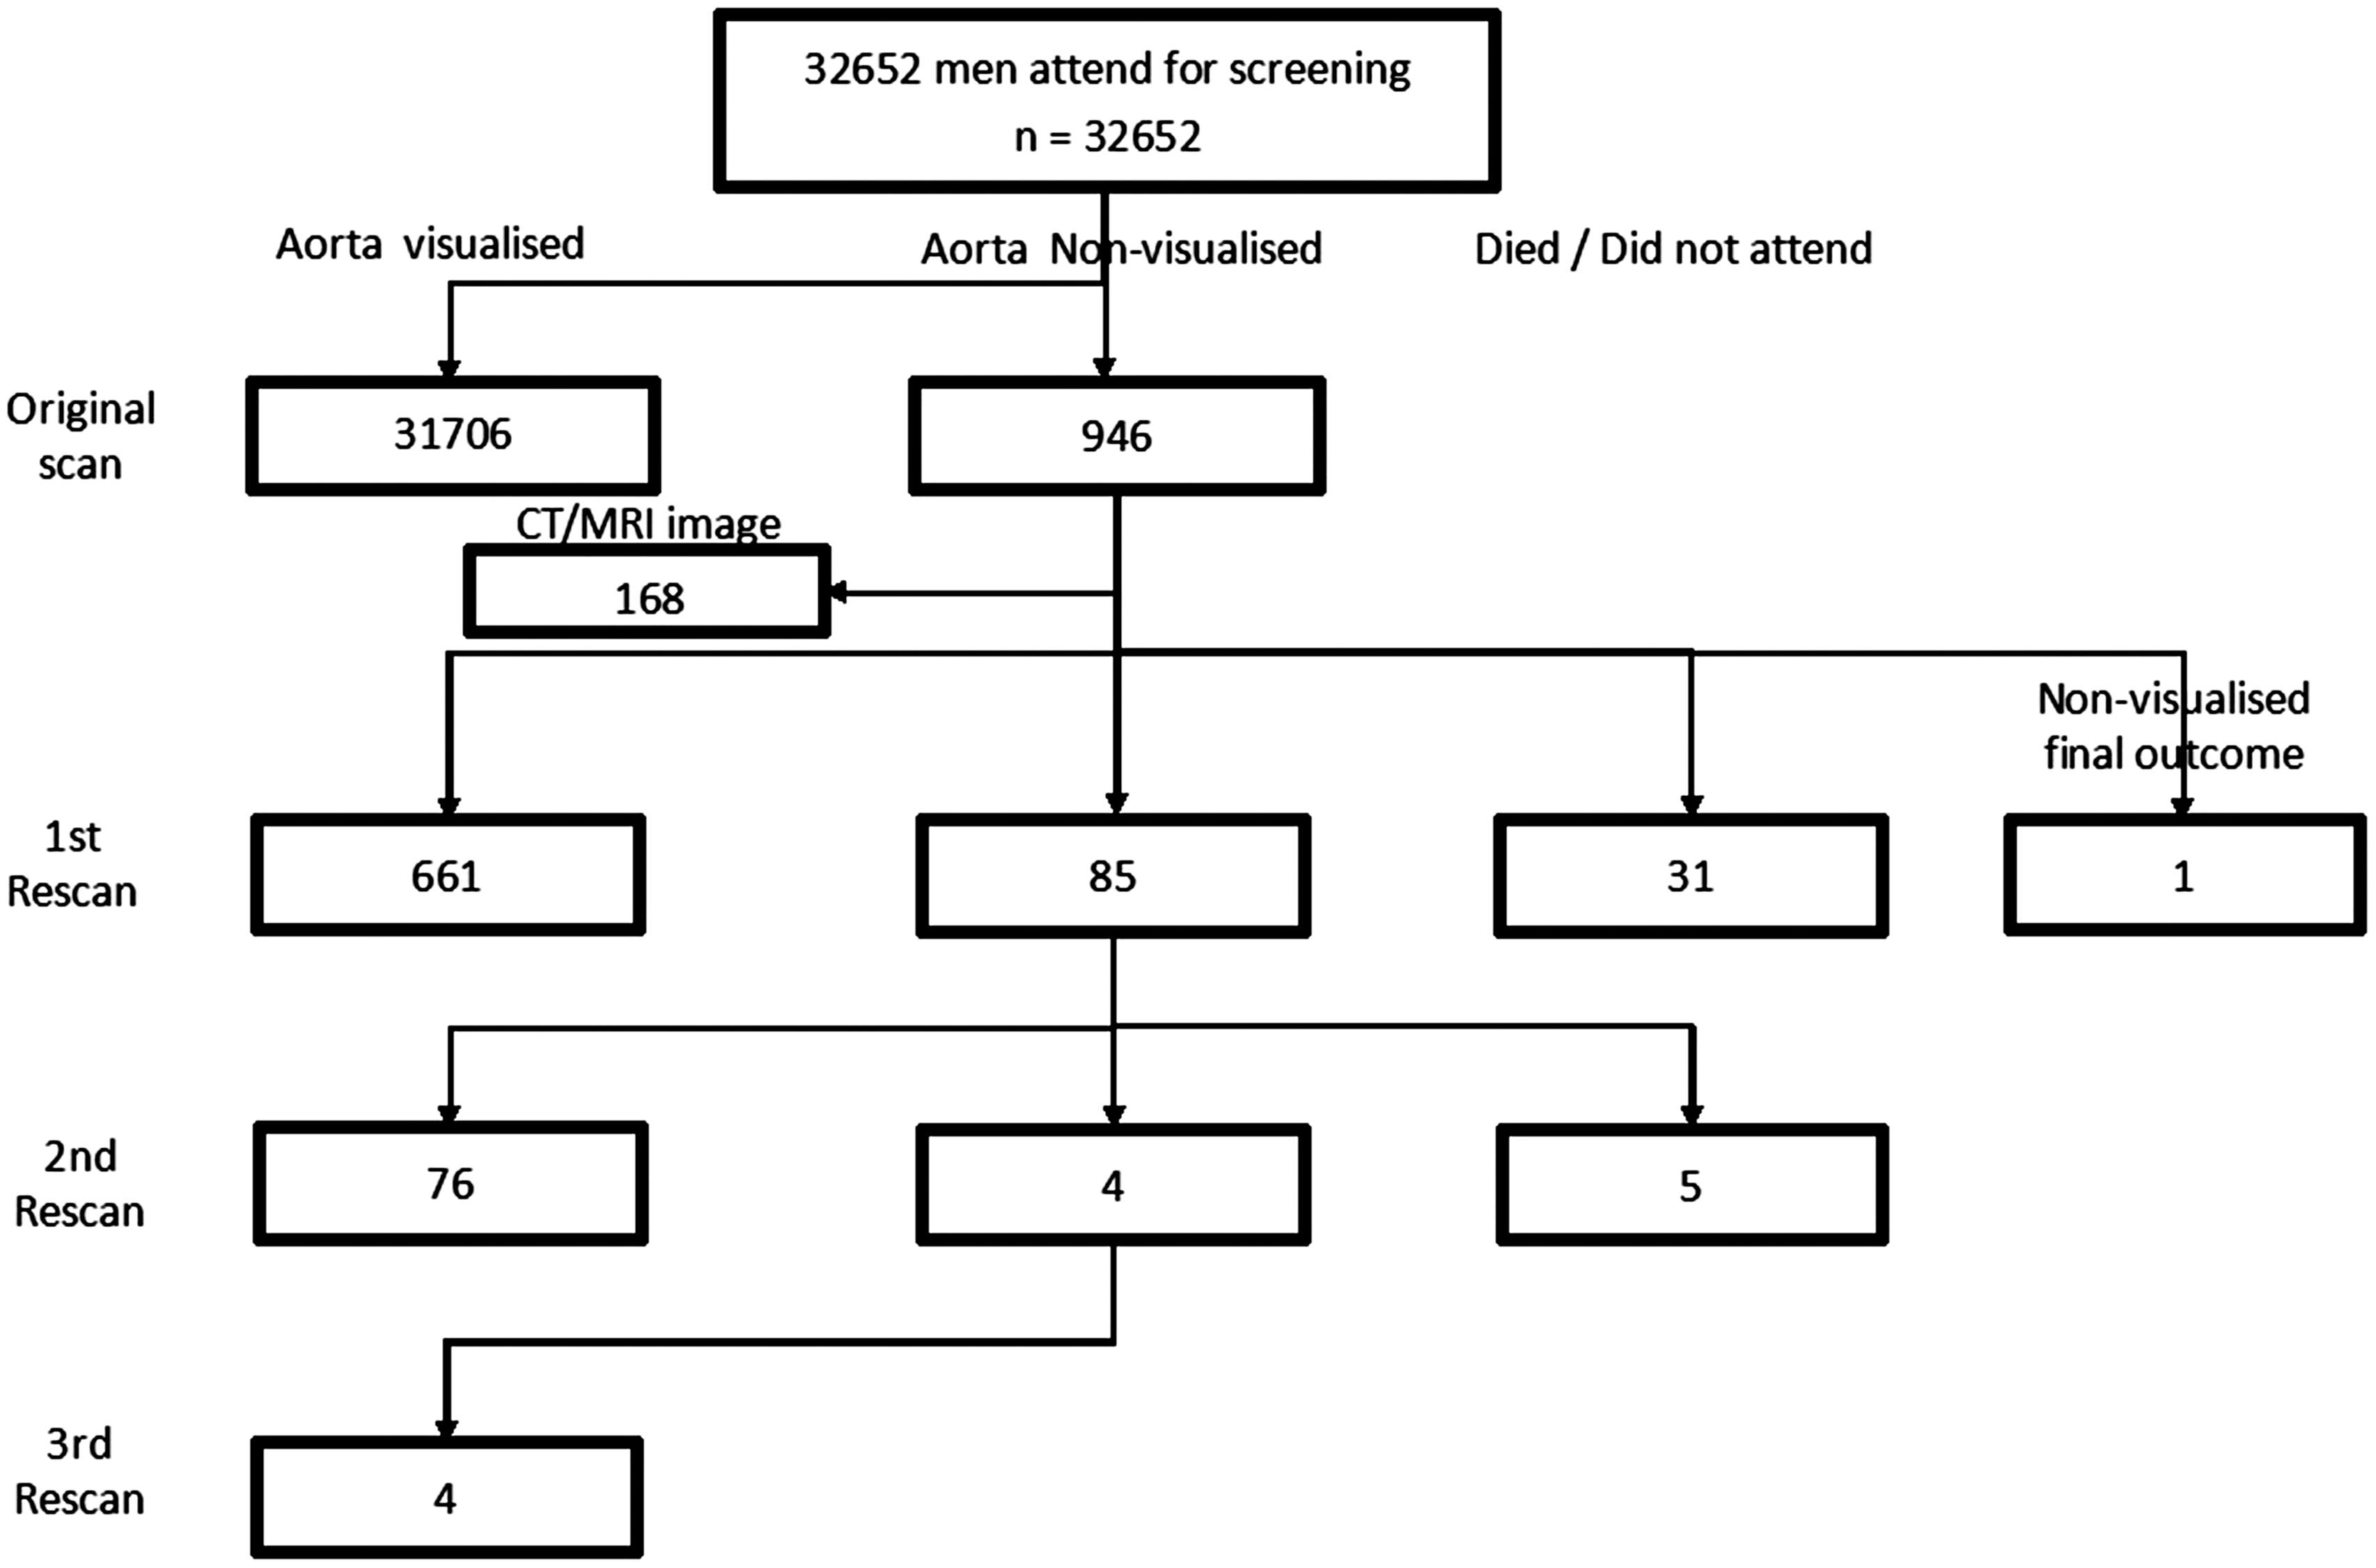
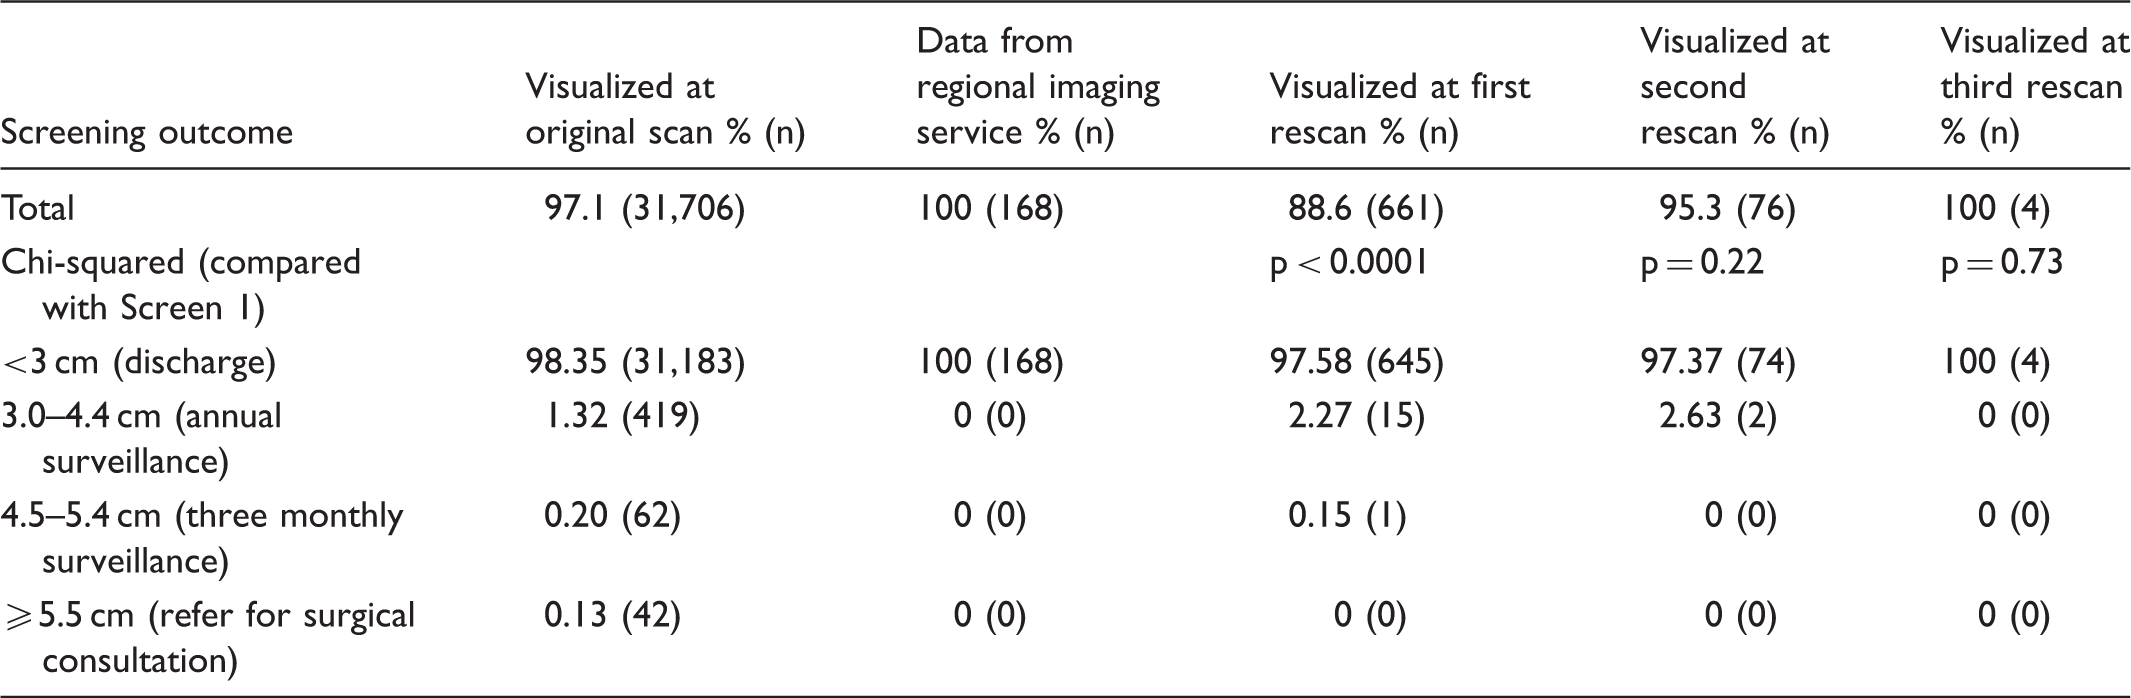
Screening outcomes of men with visualized and non-visualized aortas at each stage of scanning.
A significantly lower proportion of men attended from deprived areas (13.6% in most deprive quintile) compared with less deprived areas (23.9% in least deprived quintile), with a steady gradient between (Supplementary Table S1, available online). However, the proportion of men with NVA on original scanning was significantly greater for those from more deprived areas (5.6%) compared with less deprived areas (1.7%) (Supplementary Table S1). At first rescan there were no differences in proportions of men with NVA between deprivation quintiles. NVA rates ranged from 8.4% in the least deprived group to 12.3% in the second least deprived group, with no obvious gradient at first rescan (Supplementary Table S1). At second rescan no obvious pattern in NVA rates was seen between deprivation quintiles. There was no age difference between those with visible aortas at original scan (mean age 65.6, standard deviation 2.0) compared with those with NVA (mean age 65.6, standard deviation 2.2) (p = 0.96). There was also no difference in age between NVA and visualized cases at first rescan (visualized mean age 65.6, standard deviation 1.7; NVA mean age 65.6, standard deviation 2.1) and second rescan (visualized mean age 65.6, standard deviation 0.8; NVA mean age 65.6, standard deviation 1.7).
At original scanning there was a significantly lower proportion of men with NVA when scanned by radiographer (1.4%) compared with scanning technician (2.9%) (p = 0.03). At first rescan, 81.5% scanned by technician were successfully visualized compared with 98.3% scanned by radiographer (Supplementary Table S2), with the proportion of men with NVA (1.3%) significantly lower when scanned by radiographer compared with technician (18.5%) (p = 1.3 × 10⁻¹²).
There was no significant difference in the proportion with NVA between those scanned at regional centre (0/8 = 0%) and elsewhere (906/31,679 = 2.9%) at original scanning (Supplementary Table S2). However, only eight scans were undertaken at the regional centre at original scanning, with all aortas visualized, so this comparison is not informative. At first rescan there was one NVA at the regional unit (1/250, 0.4%), compared with 16.1% at other units (p = 5.0 × 10⁻¹¹). At second rescan there were no men with NVA at the regional centre (0/63) compared with four of the 13 men scanned at peripheral units.
At original scanning, 813 of 946 men (86%) with NVA were reported as having bowel gas, 358 (38%) reported with problematic body habitus, and 276 (29%) reported as having both. At first rescan of 85 men with NVA, 76 were reported as having bowel gas (89%), 34 with problematic body habitus (40%), and 26 (31%) reported as having both.
At original scanning, deprivation quintile and staff role were the only factors independently associated with NVA. At first rescan only staff role was independently associated with NVA. Age, clinic location, and family history of AAA were not significantly associated with NVA. At original scanning, those from the least deprived quintile were almost three times as likely to have their aorta visualized as those from the most deprived quintile (OR = 3.0, CI = 2.4–3.8) (Supplementary Table S3). A man screened by a technician, compared with radiographer, was 51% less likely to be visualized on original scanning (OR = 0.49, CI = 0.26–0.97) (Supplementary Table S3), and 94% less likely to be visualized on first rescan (OR = 0.06, CI = 0.02–0.16) (Supplementary Table S3).
Discussion
There have been no publications on subjects with NVAs as part of a national screening programme or on the outcomes of men with NVAs. Blaivas and Theodoro 4 note that few investigators have reported the frequency of NVA on ultrasound, regardless of setting. Although the overall NVA rate (excluding surveillance scans) in the NI AAA screening programme is 3.09% (1036/33,488), this masks different rates for each scanning stage, with 2.9% NVA on original scanning, 11.4% NVA on first rescan, and 4.7% NVA second rescan. The NAAASP recommend that after initial NVA one further scan can occur at the peripheral scanning clinic (or at the medical imaging unit). If NVA recurs at the first rescan, the man must be referred to the imaging unit or vascular laboratory, and the screening office notified. 5 The proportion of subjects with NVA was significantly higher on first rescan compared with original scanning. This may be expected as, although men are advised to fast prior to second screening, scanning is generally undertaken in the same location as first screen, and the technical ability of staff is unchanged. The second rescan is generally undertaken at the regional imaging centre, by an experienced radiographer using equipment which offers greater penetration and image resolution (Philips IU22), rather than by a technician in a peripheral clinic using portable ultrasound equipment (GE Logiq e). Although NVA rate on second rescan was less than half that at first rescan, this difference was not significant.
Rates of NVA have been inconsistently reported in some previous studies,4,6–8 but these were not part of a national AAA screening programme. A Japanese multicentre study of elderly patients with hypertension using pocket echo examination found that in 2.3% (39/1731) of patients NVA was due to poor image quality. 8 In a retrospective review of symptomatic patients scanned by emergency physicians in US Emergency Departments, a portion of abdominal aorta was non-visualized in 17% (35/207), and a third of the aorta non-visualized in 8% (17/207) of cases. 4 In a study involving patients with suspected AAA attending Australian Emergency Departments, Kuhn et al. 7 report NVA in 3% (2/68) of those scanned by emergency physicians and emergency medicine trainees. In the two NVAs, the aorta was obscured by overlying gas shadows, and both were found not to have AAA on subsequent computer tomography imaging.
Reasons cited for NVA include obesity, excessive bowel gas, and unusual anatomy or pathology. 5 Although causes of NVA were not categorically recorded in our study, the comments recorded suggest that the main reasons were for bowel gas (over 80% at original scan and first rescan) and obesity (over 37% at original scan and first rescan). Blaivas and Theodoro 4 reported that NVA was ‘typically the result of subcutaneous fat and bowel gas’, and Ernst 9 reported that visualization is ‘highly dependent on the technologist’ and is more difficult in obese subjects and those with excessive bowel gas or periaortic disease. However, there are very few reports on the characteristics of subjects with NVA. Hoffman et al. 6 concluded that obesity increased the likelihood of NVA threefold, while partial (OR = 3.4) or complete (OR = 42) obscuring of the aorta by bowel gas was significantly associated with NVA. However, definitions of NVA are poor in previous studies, and none are in the context of a national screening programme. In our study, NAAASP criteria for visualization were used (i.e. the aorta must be visible in both transverse and longitudinal planes for its entire infra-renal length). 5
Our finding that a man originally scanned by a technician was 51% less likely to have visualized aorta than if he were scanned by a radiographer, while at first rescan he would be 94% less likely to have visualized aorta, may be caused by the NAAASP protocol, which restricts the screening technician to scanning the midline of the aorta with an anterior approach with the subject in the supine position. The NAAASP protocol states that ‘technicians should only scan…using the longitudinal section and transverse section imaging planes with the subject in the supine position’ and that ‘if an aorta is non-visualised in the supine position from an anterior approach, the technicians should refer the subject for a re-scan’. 10 Hoffman et al. 6 also found that a patient scanned by a less experienced provider was 85–90% less likely to have a visualized aorta than if scanned by a more experienced provider, although Hoffman’s study was conducted on a very different patient cohort (men aged over 50 with AAA risk factors), in a different setting (a single US emergency department), and does not report differences in scanning protocols between practitioners.
There were no men with aortas measured at ≥ 5.5 cm in the original scan NVA group. Furthermore, the proportions of men transferred to three monthly or annual surveillance were not significantly higher for men at first or second rescan relative to original scanning. This information will be useful and reassuring to men with NVA on original scanning. Indeed the proportion of men measured at ≥ 5.5 cm at first rescan (0%) was less than those whose aortas were visualized at original scanning (0.13%) (Table 1). Although the proportion of those whose aortas measured <3 cm at first rescan was slightly less (97.6%) than those at original scanning (98.4%), this difference was not significant.
As is common in most screening programmes,11–13 we found much lower attendance rates for those from more deprived areas. Although the numbers and proportion of men from more deprived areas attending for original scanning were lower, the proportion of those with NVA was significantly higher for men from more deprived areas. A socio-economic gradient was observed, ranging from the most deprived (5.0% NVA rate) to the least deprived (1.7% NVA rate). The reasons for this are not known; they may be associated with overall and abdominal obesity, which are more prevalent in more deprived areas, 14 but quantitative measures of obesity or abdominal fat were not available in this study. The lower rates of NVA found at the regional centre compared with peripheral units may be expected, as the radiographer, the technique used, and the superior scanning equipment employed all facilitate easier visualization. There was no difference in age between men with visualized aortas and NVA at any of the three scanning stages. This is expected, as men are offered AAA screening in their 65th year, with men over age 65 able to self-refer.
At original scanning, subject deprivation group was an independent predictor of NVA. At first rescan, screener role was the only independent NVA predictor, which is probably due to the ability of the radiographer to scan across the entire stomach, while screening technicians are limited, by protocol, to scanning the midline of the abdomen. Staff role may have less effect on original scanning as the cohort tested represent a group of men who have had no previous scanning, while all men at first rescan had NVA on original scanning.
Our study has some limitations. Individual-level anthropometric subject characteristics such as BMI were not available for this study. This type of information is available on GP information systems but is not collected as part of the national screening programme. Although possible reasons for NVA were documented, these were not recorded systematically. One of the strengths of our study was that regression analysis of factors related to NVA separated the independent effects of these factors. This helped to isolate the effects of deprivation and the equipment at original scanning, and of screener role at first rescan.
Conclusion
Men from less deprived areas are more likely to have their aortas visualized at original scanning. At first rescan, men scanned by the radiographer were more likely to have their aortas visualized. The risk of AAA in men with NVA on original scanning or subsequent rescanning is no more than in those whose aortas are visualized at original scanning. This information should be communicated to these men to reassure them.
Footnotes
Declaration of conflicting interests
The author(s) declared no potential conflicts of interest with respect to the research, authorship, and/or publication of this article.
Funding
The author(s) received no financial support for the research, authorship, and/or publication of this article.
References
Supplementary Material
Please find the following supplemental material available below.
For Open Access articles published under a Creative Commons License, all supplemental material carries the same license as the article it is associated with.
For non-Open Access articles published, all supplemental material carries a non-exclusive license, and permission requests for re-use of supplemental material or any part of supplemental material shall be sent directly to the copyright owner as specified in the copyright notice associated with the article.