
Abstract
Objective
To estimate over-diagnosis due to population-based mammography screening using a lead time adjustment approach, with lead time measures based on symptomatic cancers only.
Subjects
Women aged 40–84 in 1989–2009 in South Australia eligible for mammography screening.
Methods
Numbers of observed and expected breast cancer cases were compared, after adjustment for lead time. Lead time effects were modelled using age-specific estimates of lead time (derived from interval cancer rates and predicted background incidence, using maximum likelihood methods) and screening sensitivity, projected background breast cancer incidence rates (in the absence of screening), and proportions screened, by age and calendar year.
Results
Lead time estimates were 12, 26, 43 and 53 months, for women aged 40–49, 50–59, 60–69 and 70–79 respectively. Background incidence rates were estimated to have increased by 0.9% and 1.2% per year for invasive and all breast cancer. Over-diagnosis among women aged 40–84 was estimated at 7.9% (0.1–12.0%) for invasive cases and 12.0% (5.7–15.4%) when including ductal carcinoma in-situ (DCIS).
Conclusions
We estimated 8% over-diagnosis for invasive breast cancer and 12% inclusive of DCIS cancers due to mammography screening among women aged 40–84. These estimates may overstate the extent of over-diagnosis if the increasing prevalence of breast cancer risk factors has led to higher background incidence than projected.
Introduction
There is currently no consensus about the level of over-diagnosis (the detection of cancers that would not have presented with clinical symptoms in a person’s life time) due to mammography screening. 1 Reported estimates range from 0 to 54% of expected numbers of breast cancers in the absence of screening.2–4 This variation is probably due to inadequate adjustment for lead time and/or differences in risk between comparison populations, and use of different denominators.
We aimed to determine the level of over-diagnosis due to population-wide mammography screening in South Australia (SA), based on the excess cumulative incidence of breast cancer after adjusting for lead time effects. Lead time is the amount of time that the diagnosis is advanced by screening from the point when the cancer would have become clinically evident had screening not occurred. Screening aims to diagnose disease at an earlier stage, when treatments are more effective in reducing mortality or morbidity. Adequate lead time is essential to ensure such an advantage. Very long lead times (as in the case of indolent tumours) can result in overdiagnosis.
Since the effects of lead time are ongoing, even in a well-established screening programme,5,6 adjustment for lead time is essential in estimating the extent of over-diagnosis. Common methods include 1) compensatory drop, in which any deficit in cancer incidence observed among women who have ceased screening is subtracted from the excess incidence observed among women in the screening age range; 2) rate shift, whereby incidence rates are shifted forward by the estimated lead time (eg. 2–5 years) in the reference population; and 3) modelling approaches which statistically adjust incidence rates to reflect the advancement of breast cancer diagnoses due to screening based on the estimates of lead time and other screening parameters. Each of these methods has limitations. Estimates based on the compensatory drop are highly dependent on how long the screening programme has been in place, the length of follow-up after women finished screening, and differences in screening uptake across time and age groups. 4 This method produces inflated estimates for up to 30 years after a screening programme is implemented. 7 Rate shift methods may not adequately capture the expected elevation in incidence with ongoing recruitment into screening programmes in a dynamic population. 3 Modelling lead time effects requires estimation of the average lead time length and involves assumptions about its distribution, which are both unobservable, 8 but it can provide estimates of overdiagnosis that are applicable at any point after screening is implemented. 2
We estimate the extent of over-diagnosis due to organized mammography screening in SA based on a previously described modelling approach to adjust for lead time effects. 7 Duffy and Parmar applied their method to demonstrate the effect of lead-time in the ‘ideal’ scenario of 100% participation in biennial mammography screening starting at age 50 and stopping at age 69, assuming constant incidence rates and population profiles over a 30 year period and an average lead time of 40 months for all women, irrespective of age. Our study expands on this approach by including the observed proportion of women who underwent screening each year in SA, in addition to changes in background incidence rates and population profiles over time. We applied age-specific lead time estimates based on interval cancer rates and projected background incidence for SA, using no screen-detected cancer data, and hence reflecting lead times for clinically relevant (non-overdiagnosed) breast cancers.
Methods
We estimated over-diagnosis by comparing the actual ‘observed’ incidence with incidence rates derived by modelling the background incidence to reflect the effects of organized mammography screening. Firstly, we projected the background underlying incidence rate without screening from incidence trends in the pre-screening era. We then adjusted this underlying incidence for lead time effects, based on estimates of lead time length (for SA), according to the total number of women participating in the screening programme since it began. As our estimates of lead time length are based on symptomatic cancers, the excess ‘observed’ incidence reflects the level of over-diagnosis (ie. cancers that would not have progressed), assuming no other influences on background incidence trends. Previous modelling approaches have adjusted observed incidence rates and then compared these with the background underlying incidence to arrive at estimates of over-diagnosis.9,10
Observed incidence and screening participation
Incidence data for all breast cancers from 1977–2009, among SA women aged 40–84, were obtained from the South Australian Cancer Registry. Incidence rates were calculated based on the Estimated Residential Population (ERP) for SA at June 30 of each year by individual year of age, sourced from the Australian Bureau of Statistics (ABS). 11 These rates represent the ‘observed’ incidence prior to and following the introduction of mammography screening. The numbers who participated in population-based screening, by year of age and calendar year from 1989 to 2009, were obtained from BreastScreen SA (BSSA). [Population-based mammography screening was piloted in SA in 1989 and rolled out across the state from 1991. It offers free biennial mammographic screening to asymptomatic women aged 40 and over, with written invitations targeting women aged 50–69. Prior to 2010, the programme used two-view, film-based mammography, read by two independent radiologists, with a third reading in discordant cases.]
Projected background incidence
The underlying background incidence had population-based screening not been implemented in SA was determined for each calendar year and year of age through projection of breast cancer incidence rates during the pre-screening period 1977–1988, using age-period Poisson regression with individual year of age and calendar year as continuous variables. There was no evidence of overdispersion in these models. Projections were extended to 2019. For the period 1989–2011, we used the ERP as the denominator for predicting the number of cases; for 2012–2019, we used the projected population estimates provided by the ABS (series C). 12
Screening lead time and sensitivity
We estimated age-specific lead times and screening sensitivity for 10 year age groups (40–49, 50–59, 60–69 and 70–79) by calculating the expected interval cancer rates in the first and second year following screening as described by Day,
13
according to the following formula:
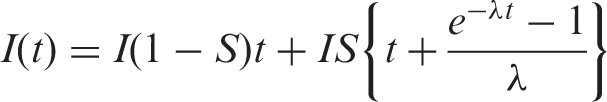

Adjustment for HRT effects was necessary due to the high prevalence of HRT use among SA women over much of the period and the strong association between HRT use and higher interval cancer rates, 16 which would have inflated the number interval cancers and distorted lead time estimates. Adjustment was based on empirical data from BSSA on the prevalence of HRT use at screening, and incidence rate ratios for interval cancers in the first and second years after screening for HRT users compared with non-users. Further details are provided in the online Supplementary Appendix.
Lead time adjustment
For any given year in which screening takes place, modelling the lead time adjusted incidence requires:
projecting the pre-screening incidence trends to estimate the underlying background incidence had screening not occurred (see above); calculating the number of cancers brought forward from future years as a result of screening lead time, and adding these to the underlying background incidence; and calculating the number of cancers detected in previous years due to lead time from screening in those years, and subtracting these from the background incidence in future years.
Based on the exponential distribution of lead time, (2) and (3) can be calculated. Using the method of Duffy and Parmar 9 , we adjusted the background cancer incidence in each calendar year and year of age from 1989 to 2009, to account for lead time effects of screening, according to the number of women participating in the programme, while taking account of screening sensitivity. We only counted cancers where diagnosis was advanced by ten years or less, that is, we assumed no lead times in excess of ten years. To estimate the extent of over-diagnosis we calculated the excess difference between the observed cumulative incidence (from cancer registry data) and the cumulative incidence after lead time adjustment of the projected background incidence (from our model) for all women aged 40–84 during the period 2005–2009. Confidence limits were determined by applying the values for the upper and lower 95% confidence intervals for lead time estimates in modelling lead time effects.
Finally, we conducted several sensitivity analyses to examine the impact of varying the background incidence rates. These analyses included modelling lead time effects assuming that the rate of increase in background incidence trends was 10% and 20% higher or lower than predicted. Direct modelling of HRT effects on background incidence rates was not possible due to the lack of fine grained data on HRT use in the entire population spanning the pre- and post-implementation period. Also, to exclude any ‘artificial’ elevation in incidence rates due to increased opportunistic screening in the later period before the public breast screening programme commenced, we modelled incidence rates for the period 1977–1985, rather than 1977–1988. We also present estimates of excess breast cancer incidence over a period of two decades of screening (1990–2009).
All analyses were undertaken for invasive breast cancer (IBC) and DCIS combined, and for IBC alone.
Results
Average annual observed and projected background IBC incidence rates (per 100000) and BreastScreen SA participation % for SA females.
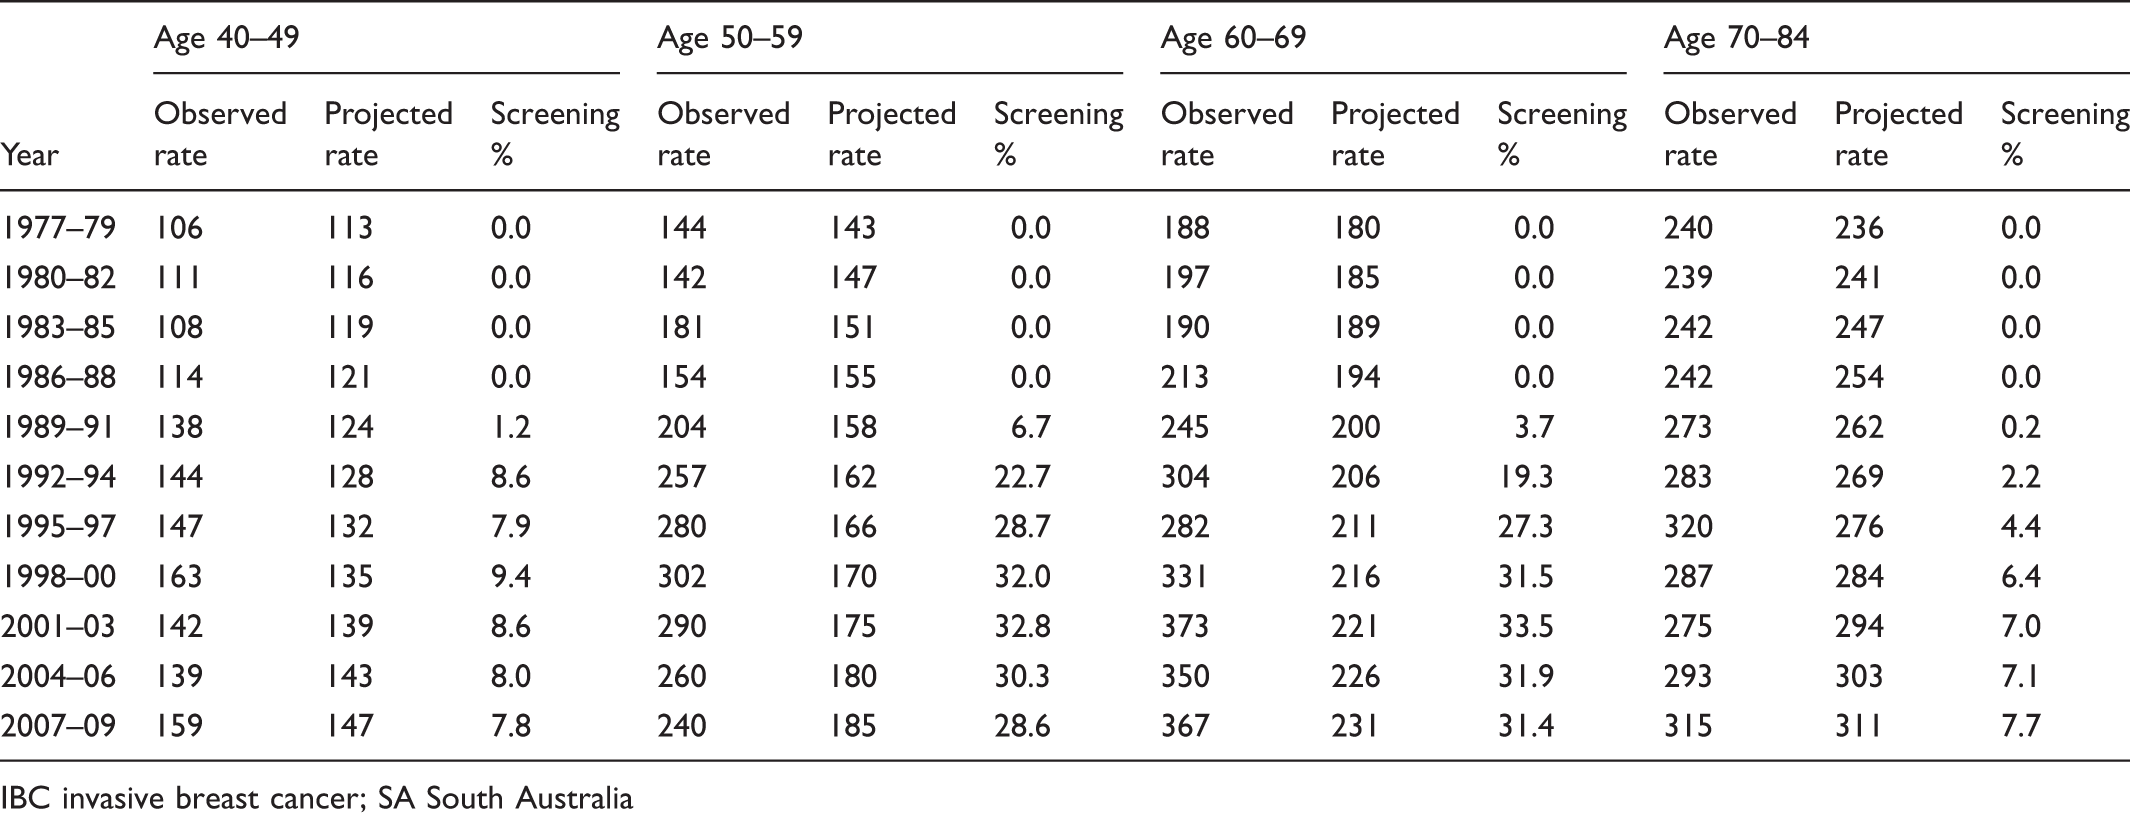
IBC invasive breast cancer; SA South Australia
Estimates of lead time and screening sensitivity derived from person years of screening, number of interval cancers and background (projected) incidence rates in the absence of screening in SA 1990–2009.
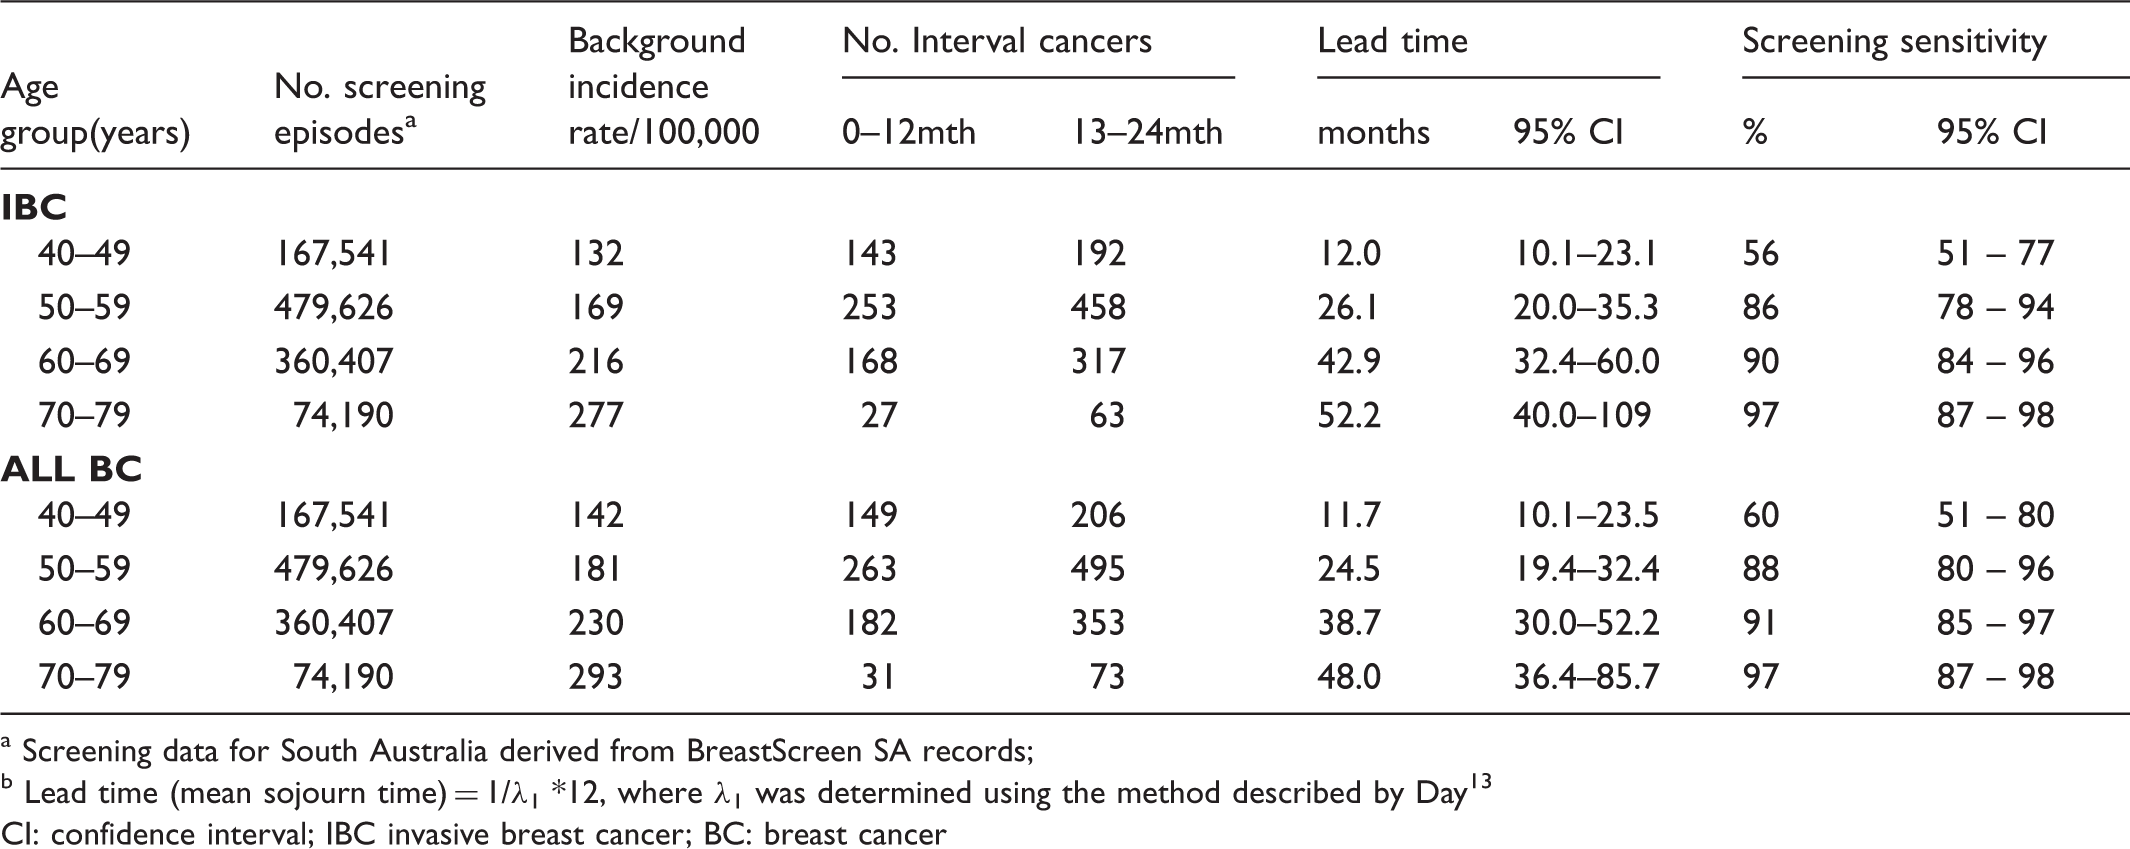
Screening data for South Australia derived from BreastScreen SA records;
Lead time (mean sojourn time) = 1/λ1 *12, where λ1 was determined using the method described by Day 13
CI: confidence interval; IBC invasive breast cancer; BC: breast cancer
Proportion of cancers expected to have diagnosis advanced by screening for each subsequent year after screening, based on lead time estimates and sensitivity of screening (for IBC) derived from BreastScreen SA data.
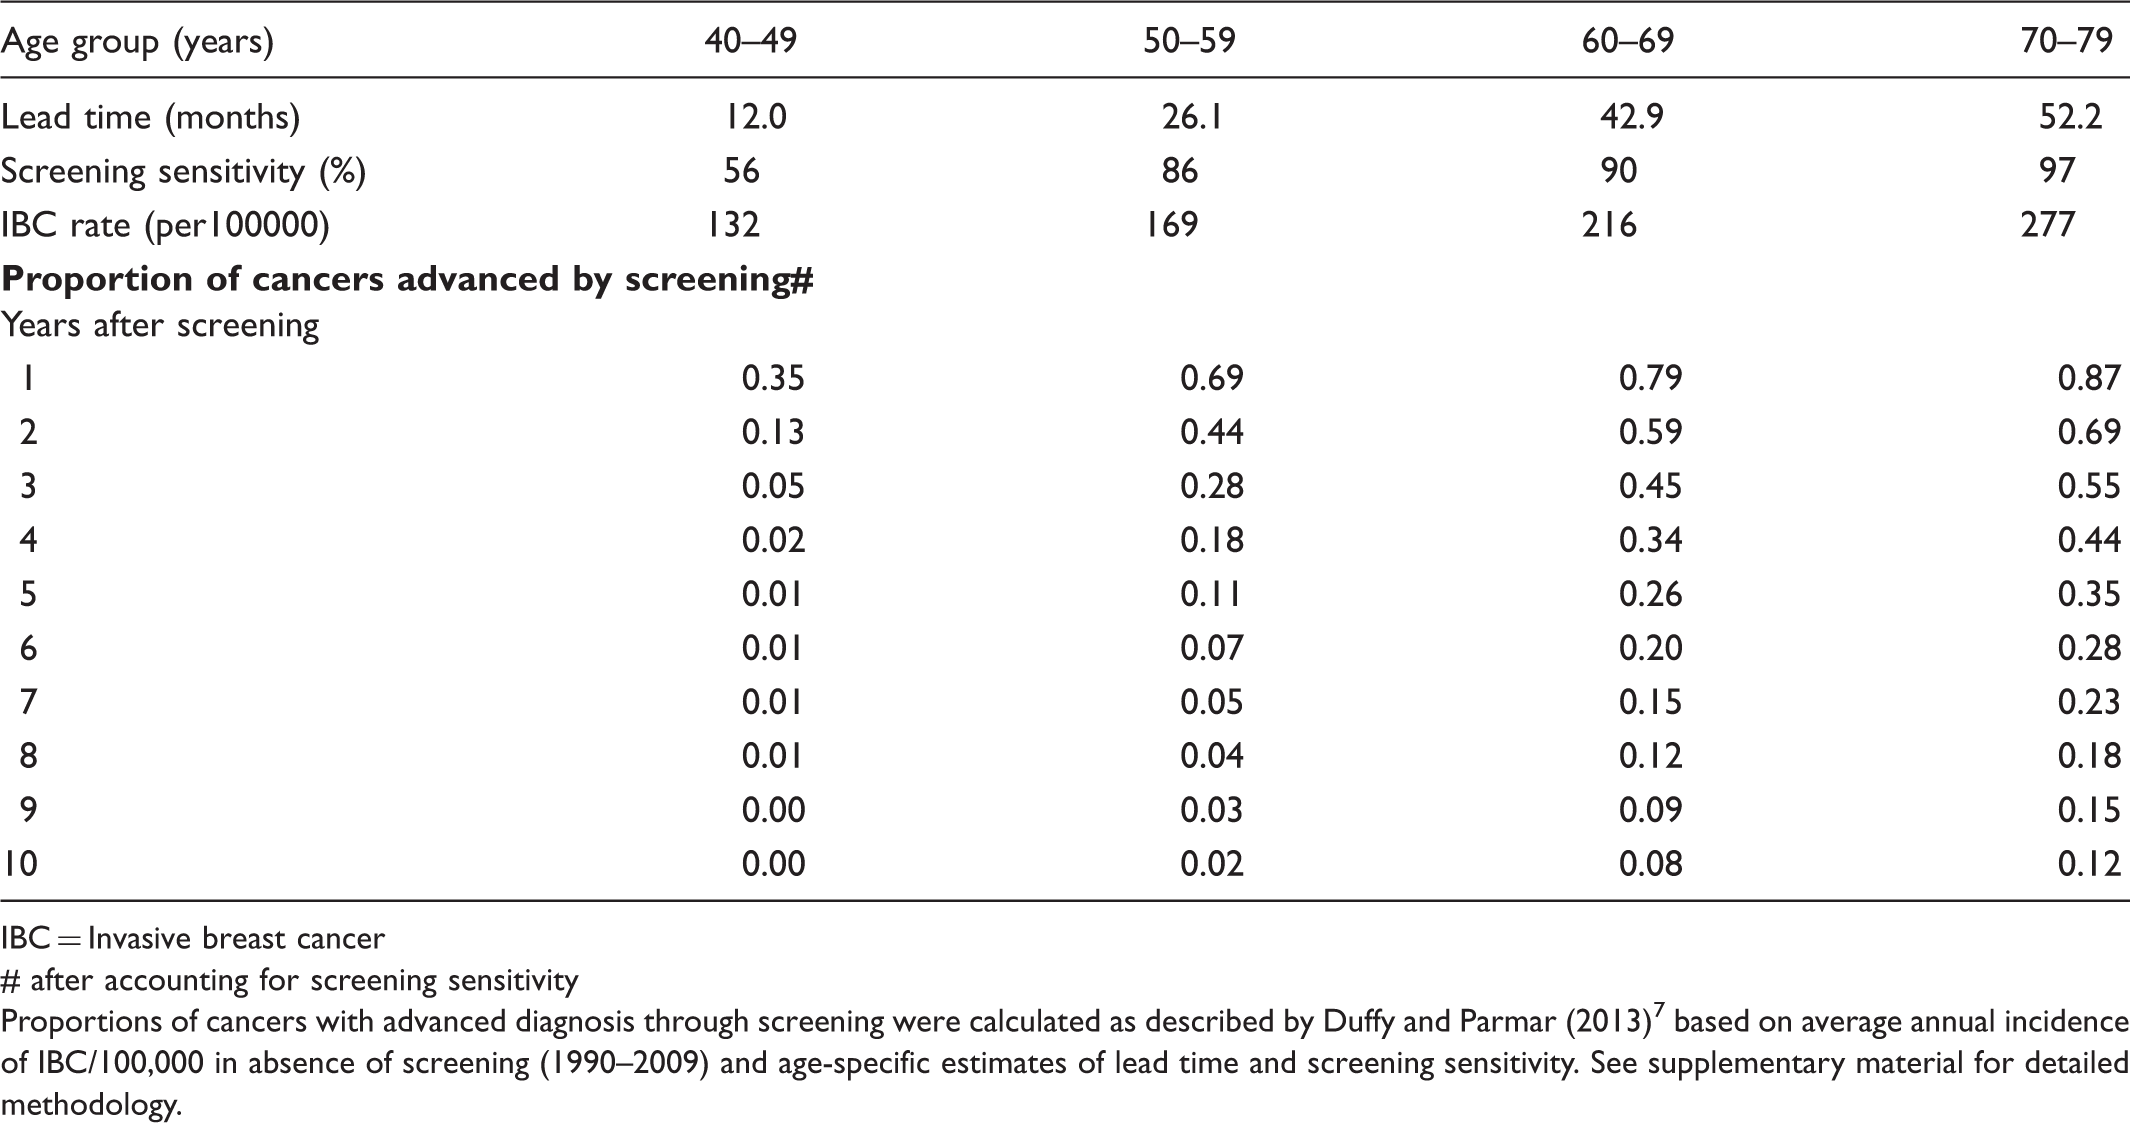
IBC = Invasive breast cancer
# after accounting for screening sensitivity
Proportions of cancers with advanced diagnosis through screening were calculated as described by Duffy and Parmar (2013) 7 based on average annual incidence of IBC/100,000 in absence of screening (1990–2009) and age-specific estimates of lead time and screening sensitivity. See supplementary material for detailed methodology.
Figure 1 presents time trends in lead time adjusted rates compared with actual observed incidence rates and projected (background) incidence rates for IBC in SA from 1977 to 2009. These trends indicate that the incidence rate pattern after adjusting for lead time effects resembles the ‘true’ observed incidence pattern, although the adjusted rate is generally lower than the observed rate. At two time points (1993 and 1997), the observed and lead time adjusted incidence are essentially equivalent, suggesting little or no overdiagnosis in these years. However, random variation in observed incidence, which has occurred across both the pre- and post- screening periods, is likely to explain the coinciding rate at each time point, with the overall pattern indicating some excess incidence that is not explained by lead time effects of screening.
Trends in observed, lead time adjusted and projected (background) invasive breast cancer incidence rates for South Australian women aged 40–84 y, 1977–2009.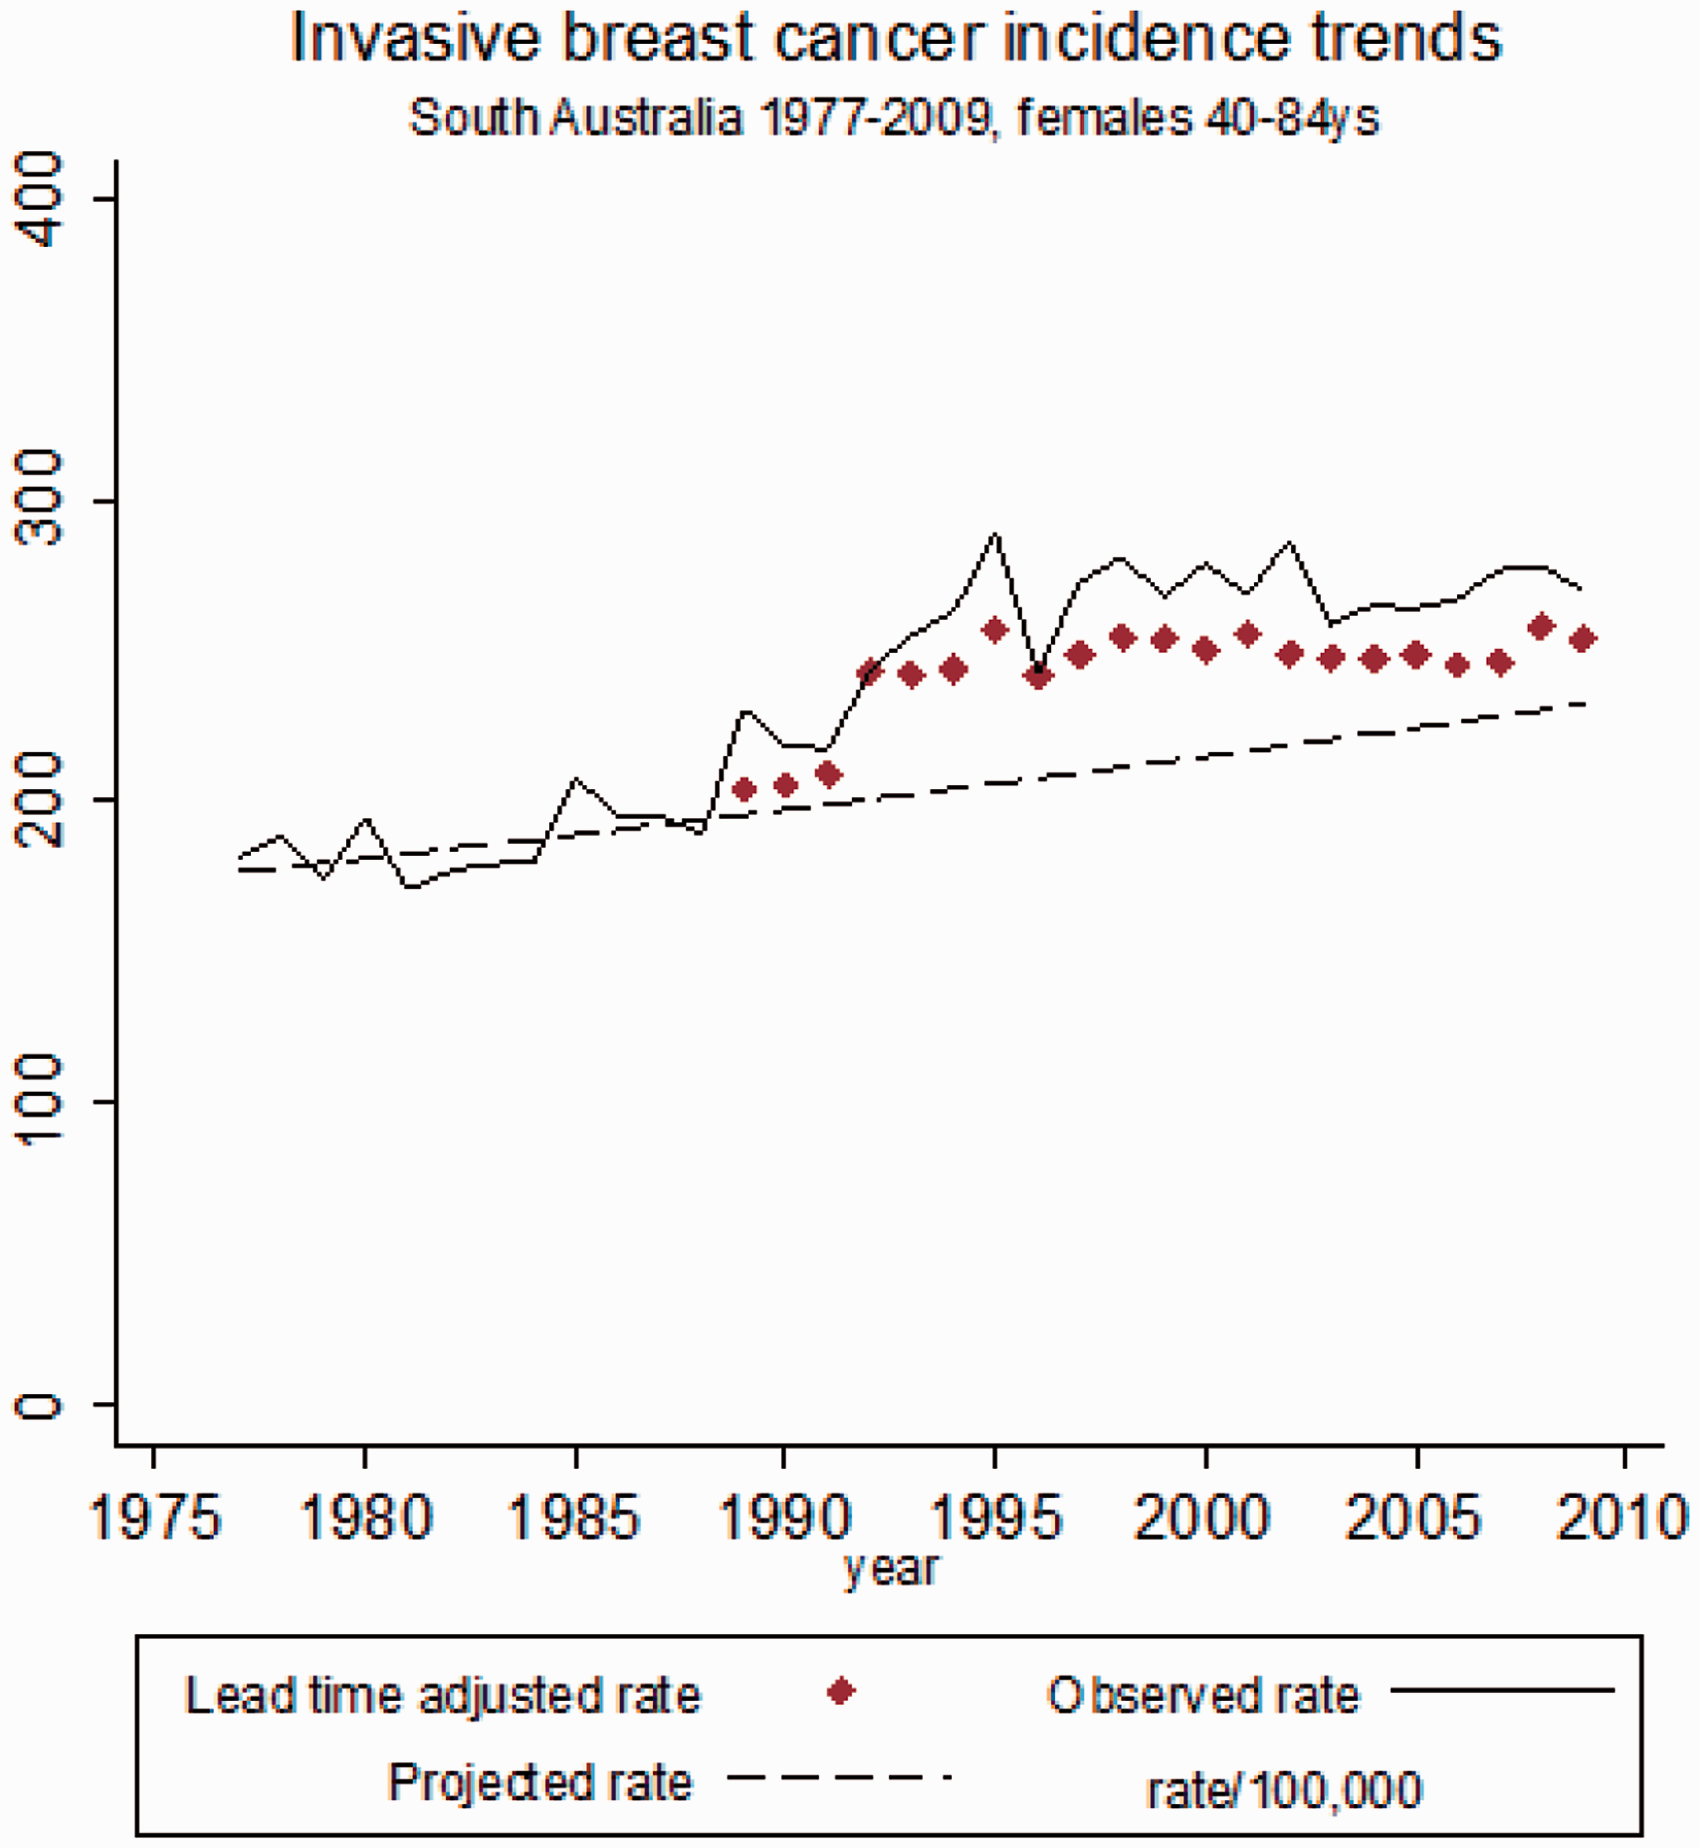
Cumulative number of observed and modelled (lead time adjusted) breast cancer cases, and percent of excess (over-diagnosed) cases for SA females aged 40–84 (2005–2009).
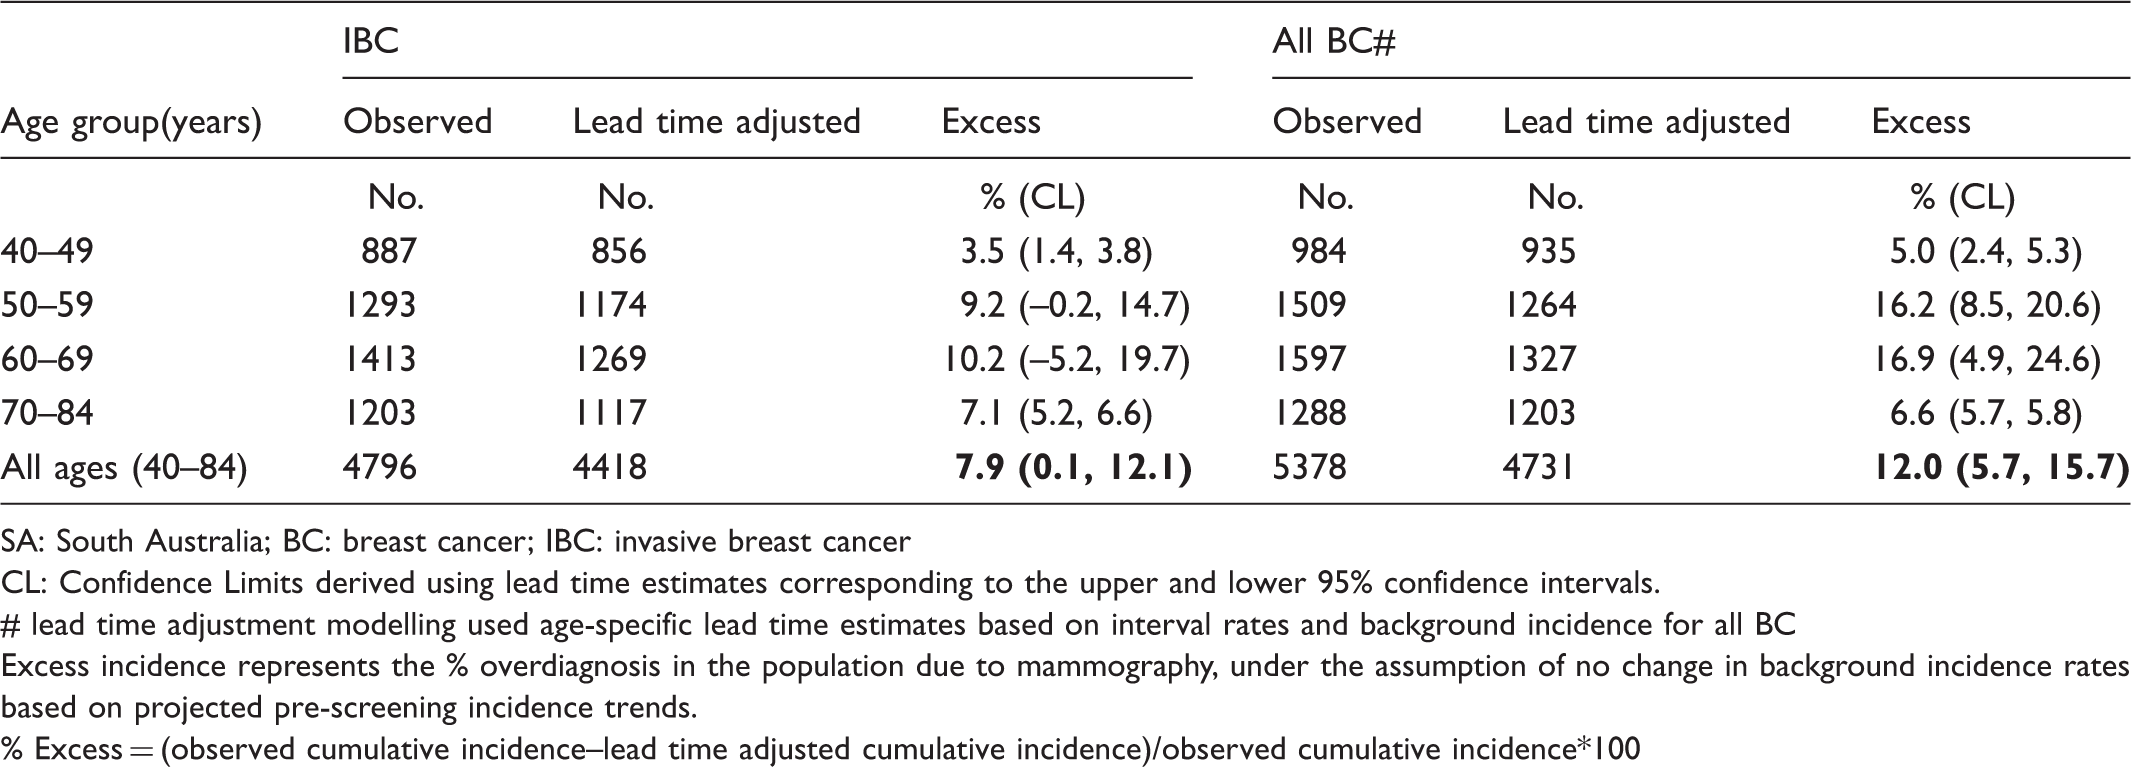
SA: South Australia; BC: breast cancer; IBC: invasive breast cancer
CL: Confidence Limits derived using lead time estimates corresponding to the upper and lower 95% confidence intervals.
# lead time adjustment modelling used age-specific lead time estimates based on interval rates and background incidence for all BC
Excess incidence represents the % overdiagnosis in the population due to mammography, under the assumption of no change in background incidence rates based on projected pre-screening incidence trends.
% Excess = (observed cumulative incidence–lead time adjusted cumulative incidence)/observed cumulative incidence*100
Sensitivity analyses for estimates of excess cumulative incidence (over-diagnosis) in SA women aged 40–84.
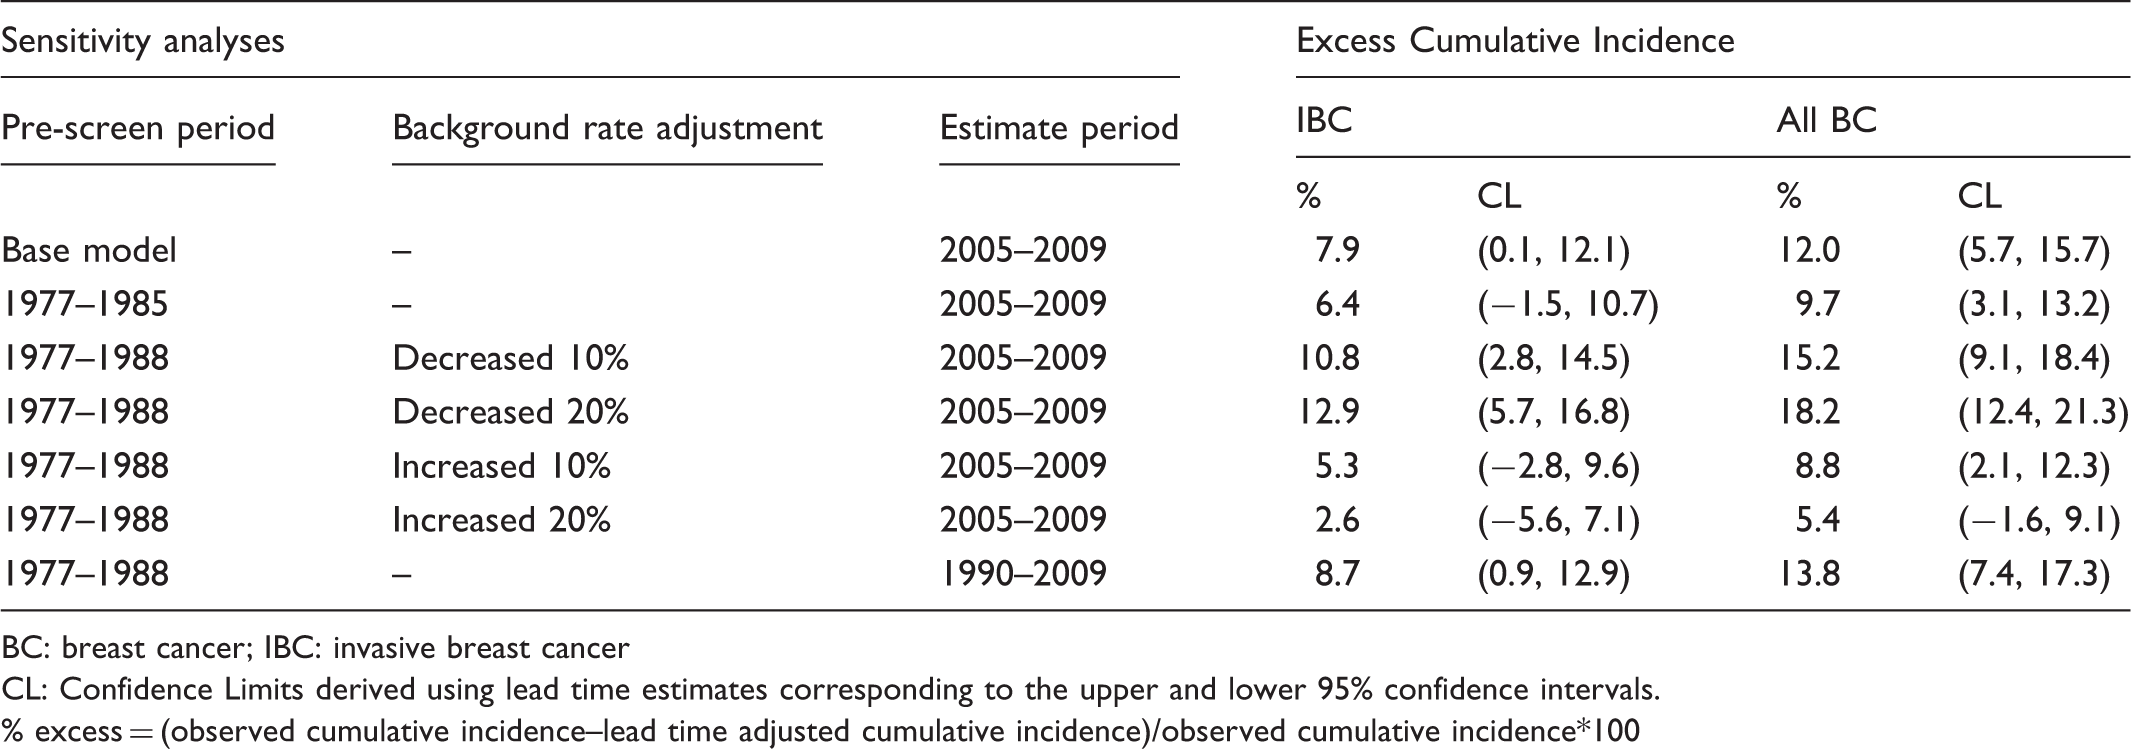
BC: breast cancer; IBC: invasive breast cancer
CL: Confidence Limits derived using lead time estimates corresponding to the upper and lower 95% confidence intervals.
% excess = (observed cumulative incidence–lead time adjusted cumulative incidence)/observed cumulative incidence*100
Discussion
Our findings indicate a modest level of over-diagnosis due to population-based mammography screening in SA. Trends in lead time adjusted incidence rates closely resemble the observed pattern for SA, although adjusted rates were consistently lower than observed rates. As our lead time estimates were based on symptomatic cases, the excess in observed compared with modelled (lead time adjusted) incidence will be equivalent to the level of overdiagnosis, provided no influences other than mammography screening affected underlying incidence rates after screening commenced. Under this assumption, over-diagnosis due to population-based mammography screening in SA was estimated as 8% for IBC, and 12% for all breast cancers for women aged 40–84 during 2005–2009. These estimates are consistent with our previous findings in SA using a case-control design with individual measures of screening participation and breast cancer incidence (8% for IBC and 14% for all breast cancer). 17
Our estimates are consistent with those from randomized control trials,18,19 and with data from the 2012 independent review of breast screening in the UK. 20 Moss 18 reported 11–14% over-diagnosis for all breast cancer based on follow-up for trials which did not offer screening to the control arm at the end of the trial period. Similarly, Zackrisson et al 19 reported 7% over-diagnosis for IBC and 10% for all breast cancer based on the Malmo trial data. There is also good agreement between our findings and the observational studies by Falk et al 21 (11–13% for IBC in Norway), Waller et al 22 (∼11% for IBC in the UK), and Puliti et al 23 (10% for all breast cancer in Northern Italy). However, lower (from 0–5% for IBC,9, 10 24–27) and much higher rates of over-diagnosis (from 22–54%28–32) have also been reported. Choice of denominator explains the higher levels of over-diagnosis reported in some of the latter studies. 4
Our estimates are slightly higher than those of other studies that used similar lead time modelling (eg. 5% of all breast cancer in Northern/Central Italy,9,10) possibly reflecting variation in the screening programmes themselves, or other factors that influence background incidence (eg. differences in HRT use). Also, our assumption of no lead time beyond 10 years may overestimate over-diagnosis, particularly for older ages where the duration of the preclinical screen detectable period is relatively long.
By contrast, our estimates are considerably lower than those from studies which adjusted for lead time by shifting incidence rates by the estimated lead time, eg. in New South Wales, Australia, where over-diagnosis between 30–54% of the expected rate (equating to 23–35% of observed rates) was reported. 29 The work of Duffy and Parmar 7 suggests that using the rate shift method may underestimate the excess incidence due to lead time effects, because lead time adds a proportion of future cancers rather than simply exchanging future incidence rates. Using their scenario of a lead time of 40 months 7 , the incidence rate ratio (IRR) due to lead time effects among women aged 50–69, 15-16 years after screening started, is 1.22 compared with background rates. However, shifting incidence rates 3 years forward gives an IRR of 1.06 compared with background incidence rates, or 1.11 for a 5-year shift. This is due mainly to the dynamic, ongoing nature of screening whereby first time participants are continually being recruited into the programme. This excess is mostly compensated for in the years after screening ceases, which are not included in the rate shift method. (See online Supplementary Appendix for details.)
We made several assumptions in estimating over-diagnosis through modelling lead time effects. The first was that there were no major changes in underlying incidence trends. The lack of baseline data during the pre-screening period meant we could not include breast cancer risk factors in our prediction modelling. With the exception of HRT use, prevalence of several known breast cancer risk factors (relating to body weight, alcohol consumption, parity, age at first birth, diabetes rates) among SA women has steadily increased over the two decades since screening began,33,34 which may have further increased incidence rates. The impact of changing patterns of HRT use on background incidence is more difficult to assess, but the high prevalence of use for much of the time since screening began probably led to higher than predicted background incidence. 35 Use of private mammography screening 36 and increasing diagnostic vigilance 37 may also have inflated background incidence rates over the past two decades. Sensitivity analyses indicate that adjusting the background trend rate has a moderate impact on our estimates. Even with a 20% lower rate of increase over time, excess incidence (ie. over-diagnosis) was just under 13% for IBC. However, the most likely scenario is higher rather than lower background incidence rates, given the cumulative effect of increasing prevalence across multiple breast cancer risk factors, 33 in which case over-diagnosis would be lower than our estimate of 8%.
Our model also assumes that background incidence trends before organized screening began were not greatly affected by any uptake of opportunistic screening during that period. Data from New South Wales, Australia, indicate a marked increase in Medicare-funded diagnostic mammography between 1985 and 1992. 36 The authors believe that some diagnostic mammography during this period constituted de facto or opportunistic screening. Any parallel increase in opportunistic screening in SA may have inflated incidence trends. However, sensitivity analyses, which restricted the pre-screening era to the period 1977-1985 to remove any effect of opportunistic screening, actually yielded slightly lower estimates of over-diagnosis in our study.
Finally, we have assumed an exponential distribution for lead time, which applies only to cancers that are truly progressive. The assumption that lead time is exponentially distributed is based both on the biological models of cell growth for tumours in the screen detectable size range 38 and empirical evidence which indicates that an exponential distribution gives the best fit when modelling lead time effects. 14 Zahl et al8,39 have argued that lead time adjustment methods underestimate over-diagnosis because lead time estimates include slowly growing or dormant tumours that would never have arisen clinically during a person’s life time (ie. over-diagnosed cases). However, the method used in this study to derive age-specific lead times was based on projected background incidence rates in the absence of screening and on interval cancer rates, which for the most part, are truly progressive tumours.
The strengths of this study include the application of age-specific lead times derived directly from the study population. Our lead time estimates were calculated from parameters for symptomatic cancers only, so do not include any contribution from non-progressive cancers detected at screening. Our model also includes adjustment for screening sensitivity for different age groups. Furthermore we used fine grained data on screening participation to model lead time effects.
Conclusion
Our findings suggest a relatively low level of over-diagnosis due to organized population-based mammography screening in SA. Assuming a constant increase in background incidence rates based on incidence trends prior to the implementation of mammography screening, much of the observed increase in breast cancer can be explained by lead time effects. Our estimate of 8% for IBC is consistent with findings from randomized trials and the recent UK Independent Review, 20 and in agreement with results from our previous case-control study. 17 Our estimate may overstate the extent of over-diagnosis if projections have not accounted adequately for effects of increases in breast cancer risk factors in the decades following commencement of the screening programme.
Footnotes
Competing interests
The authors have no competing interests.
Financial declaration
Ms Beckmann is the recipient of a NHMRC PhD scholarship and Professor Lynch is supported through a NHMRC Australian Fellowship. This work was funded by the National Breast Cancer Foundation’s Novel Concept Award (#NC-11–53).
Acknowledgements
Special thanks go to Graeme Tucker and Minh Nguyen from the Epidemiology Branch of SA Health for their painstaking work in record linkage and assembly of relevant datasets, and to Gillian Rogers from BSSA for her assistance with data extraction and compilation, without which this study would not have been possible.
References
Supplementary Material
Please find the following supplemental material available below.
For Open Access articles published under a Creative Commons License, all supplemental material carries the same license as the article it is associated with.
For non-Open Access articles published, all supplemental material carries a non-exclusive license, and permission requests for re-use of supplemental material or any part of supplemental material shall be sent directly to the copyright owner as specified in the copyright notice associated with the article.