
Abstract
Objective
To estimate the detection rates (DRs) and false-positive rates (FPRs) in the incidental identification of trisomy 18 (T18) and trisomy 13 (T13) as part of antenatal screening for Down's syndrome (DS) using the Combined, Quadruple and Integrated test markers.
Methods
Screening marker levels on 224 T18 and 67 T13 pregnancies screened for DS were evaluated. Estimated means, standard deviations and correlation coefficients were used with published estimates for unaffected pregnancies to derive detection algorithms for the two disorders. DRs and FPRs of the algorithms were estimated using Monte Carlo simulation.
Results
In T18 and T13 pregnancies first trimester nuchal translucency was raised, free β-human chorionic gonadotrophin (hCG) and pregnancy associated plasma protein-A reduced. In T18 pregnancies second trimester alphafetoprotein, unconjugated oestriol and free β-hCG were reduced. In T13 pregnancies second trimester inhibin-A was raised. These markers specified T18 and T13 algorithms. The DS Combined test algorithm detected 42% of T18 and 59% of T13 (2.00% FPR); 88% and 74% by adding the T18 Combined test algorithm (2.17% FPR) and 89% and 75% by further adding the T13 Combined test algorithm (2.19% FPR). The corresponding detection rates for the Quadruple test were: 2% and 17% (2.00% FPR), 55% and 17% (2.16% FPR) and 55% and 19% (2.28% FPR), and for the Integrated test were: 40% and 64% (2.00% FPR), 92% and 65% (2.12% FPR) and 92% and 72% (2.18% FPR).
Conclusions
Antenatal screening for DS detects about 40% of T18 and about 60% of T13 pregnancies. The addition of a T18 algorithm substantially increases the detection of both trisomies with a small increase in the FPR. The further addition of a T13 algorithm results in a small increase in the detection of T13.
INTRODUCTION
Several publications estimate the incidental detection of trisomy 18 (T18) and trisomy 13 (T13) in antenatal screening for Down's syndrome (DS). 1–7 Uncertainty remains in respect of the following: (i) lack of data because the background birth prevalence is low, 8 (ii) the choice of parameters that can be used from all the main current DS screening tests, (iii) whether parameters should be combined for T18 and T13 4 or whether separate parameters should be used and (iv) lack of data providing a complete comparison of markers from the main DS screening tests. These uncertainties prompted us to carry out a study to help resolve the issues.
METHODS
We identified 224 T18 and 67 T13 singleton pregnancies screened for DS at the Wolfson Insititute of Preventive Medicine, London, between 1994 and 2011. Of these, 152 and 47 were screened using the Combined test (measurement of the ultrasound marker nuchal translucency [NT] and serum markers pregnancy associated plasma protein-A [PAPP-A] and human chorionic gonadotrophin [hCG; total or the free β subunit] at 11–13 weeks’ gestation), 59 and 13 using the Quadruple test (second trimester measurement of alphafetoprotein [AFP], unconjugated estriol [uE3], hCG and inhibin-A; 6 and 1 of which had total rather than free β-hCG measured), 6 and 1 using the Triple test (Quadruple test without inhibin-A, all with total hCG), 7 (one had no PAPP-A measurement) and 5 (one did not return for the second stage) using the Integrated test (first trimester NT, and PAPP-A and second trimester AFP, uE3, free β hCG and inhibin-A) respectively. One T13 pregnancy only had AFP measured, as a neural tube defect screening test. Marker values were expressed as multiples of the unaffected median (MoM) for the same gestational age, with serum markers adjusted for maternal weight. The distributions of marker values in T18 and T13 pregnancies were compared using the Wilcoxon rank sum test.
Algorithms for the identification of T18 and T13 were specified from the multivariate log Gaussian distributions of the markers in T18 and T13 pregnancies. Median log MoM values were used as estimates of means on a log scale, to avoid the influence of outliers. Standard deviations (log) were calculated by regression of the points on the Gaussian probability plot between the 10th and 90th centiles, and correlation coefficients were calculated after excluding points more than 3.5 standard deviations from the mean. There were too few pregnancies with both first and second trimester markers values to determine the correlation coefficients between first and second trimester markers. These were assumed to be zero. In DS pregnancies there is little correlation between these first and second trimester markers, and the same is likely to be true in T18 and T13 pregnancies. Log means and standard deviations of the markers in unaffected pregnancies and correlation coefficients were taken from the SURUSS (Serum, Urine and Ultrasound Screening Study) report 9 with a recent update 10 (parameters for NT were those with the measurement performed at 11 completed weeks’ gestation). Probability plots and, if appropriate, the approximate point of risk reversal (to ensure risk estimation is a monotonic function of the marker value 11 ) were used to specify truncation limits within which the range of values the markers approximately followed log-Gaussian distributions. Parameters specifying the algorithms for the identification of DS pregnancies were taken from the SURUSS report and the recent update 9,10 (parameters for the first trimester markers were those with the measurements at 11 completed weeks’ gestation).
Monte Carlo simulation used these specified Gaussian distributions to generate hypothetical random samples of 250,000 T18, 250,000 T13, 250,000 DS and 250,000 unaffected pregnancies. Each simulated pregnancy was assigned a maternal age based on the maternal age distribution of maternities in England and Wales 2006–2008 12 and the maternal age-specific odds of a live birth affected with T18, 8 T13 8 or DS. 13,14 For each simulated pregnancy, and for each disorder, an early second trimester maternal age risk was calculated by multiplying the maternal age-specific odds of having an affected live birth by 1/0.35 for T18, 15 1/0.58 for T13 15 and 1/0.77 for DS, 16 to allow for the general fetal loss in affected pregnancies from this time in pregnancy until term. For each disorder, the predicted risk of the disorder was calculated by multiplying the age-specific odds of the disorder by the likelihood ratio (for a given set of marker values) obtained from the overlapping multivariate Gaussian distributions of marker levels in affected and unaffected pregnancies. Each simulated pregnancy, therefore, was allocated a predicted risk of T18, T13 and DS. We estimated the DS, T18 and T13 DRs using (i) DS test algorithms only, (ii) DS and T18 algorithms and (iii) DS, T18 and T13 algorithms for DS false-positive rates (FPRs) of 1%, 2% and 3%, and T18 and T13 FPRs of 0.1%, 0.2% and 0.3%. We also estimated the performance of the T18 and T13 algorithms alone according to risk cut-off.
RESULTS
Figure 1 shows the marker MoM values in the T18 pregnancies, and Figure 2 shows the values in the T13 pregnancies, together with median values and 95% confidence intervals. In the first trimester NT is statistically significantly increased in both T18 and T13 pregnancies compared with unaffected pregnancies (medians of 1.71 and 2.12 respectively compared with 1.00) and free β-hCG and PAPP-A are reduced, more so in T18 than T13 pregnancies (free β-hCG 0.16 and 0.47, PAPP-A 0.16 and 0.26 respectively). In the second trimester AFP, uE3 and free β-hCG are reduced in T18 pregnancies (median MoM values of 0.72, 0.47 and 0.25 respectively), but there is no statistically significant difference in inhibin-A. Conversely, in T13 pregnancies inhibin-A is increased (median MoM 1.61), but AFP, uE3 and free β-hCG are not statistically significantly increased or decreased. The MoM values were statistically significant different between T13 and T18 pregnancies for first trimester free β-hCG and PAPP-A, and second trimester markers AFP, uE3, free β-hCG (all P < 0.001) and inhibin-A (P = 0.033), but not NT (P = 0.086). The statistical parameters (means, standard deviations, correlation coefficients and truncation limits) used in subsequent modelling are shown in the Appendix Table A1.
Distribution of MoM values for (a) first trimester and (b) second trimester markers in trisomy 18 pregnancies, with medians (95% confidence intervals). MoM, multiples of the unaffected median Distribution of MoM values for (a) first trimester and (b) second trimester markers in trisomy 13 pregnancies, with medians (95% confidence intervals). MoM, multiples of the unaffected median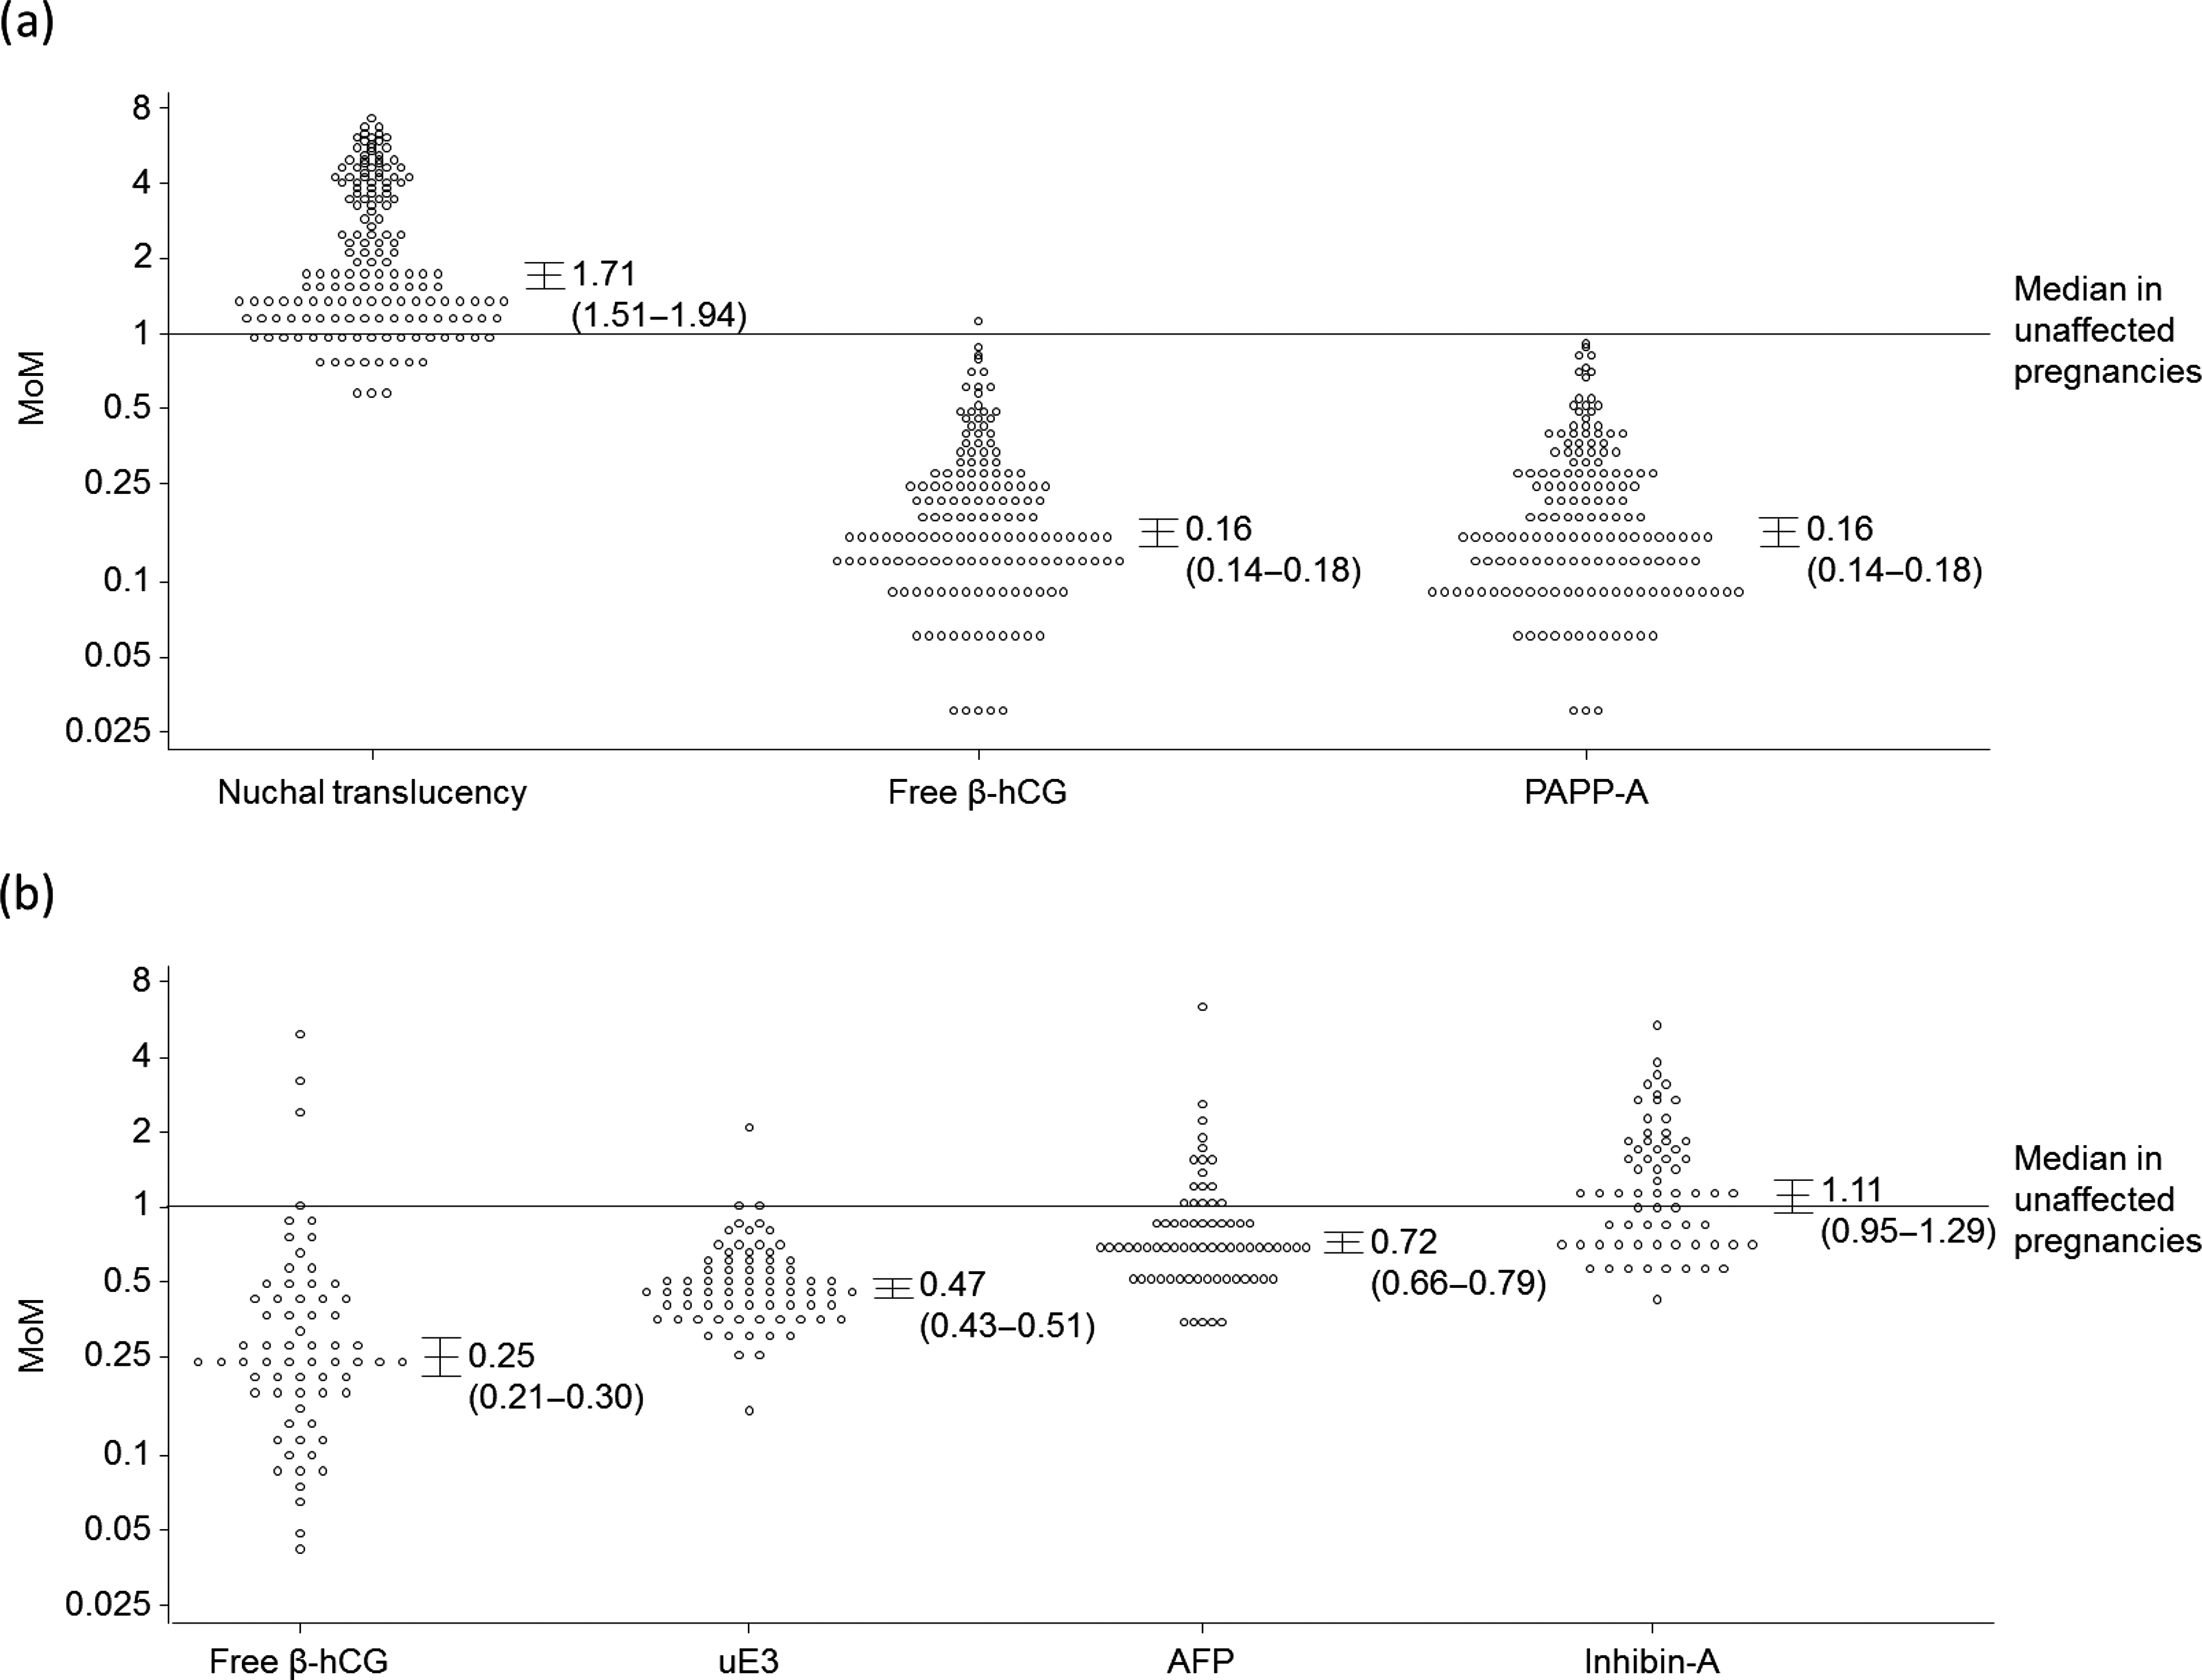
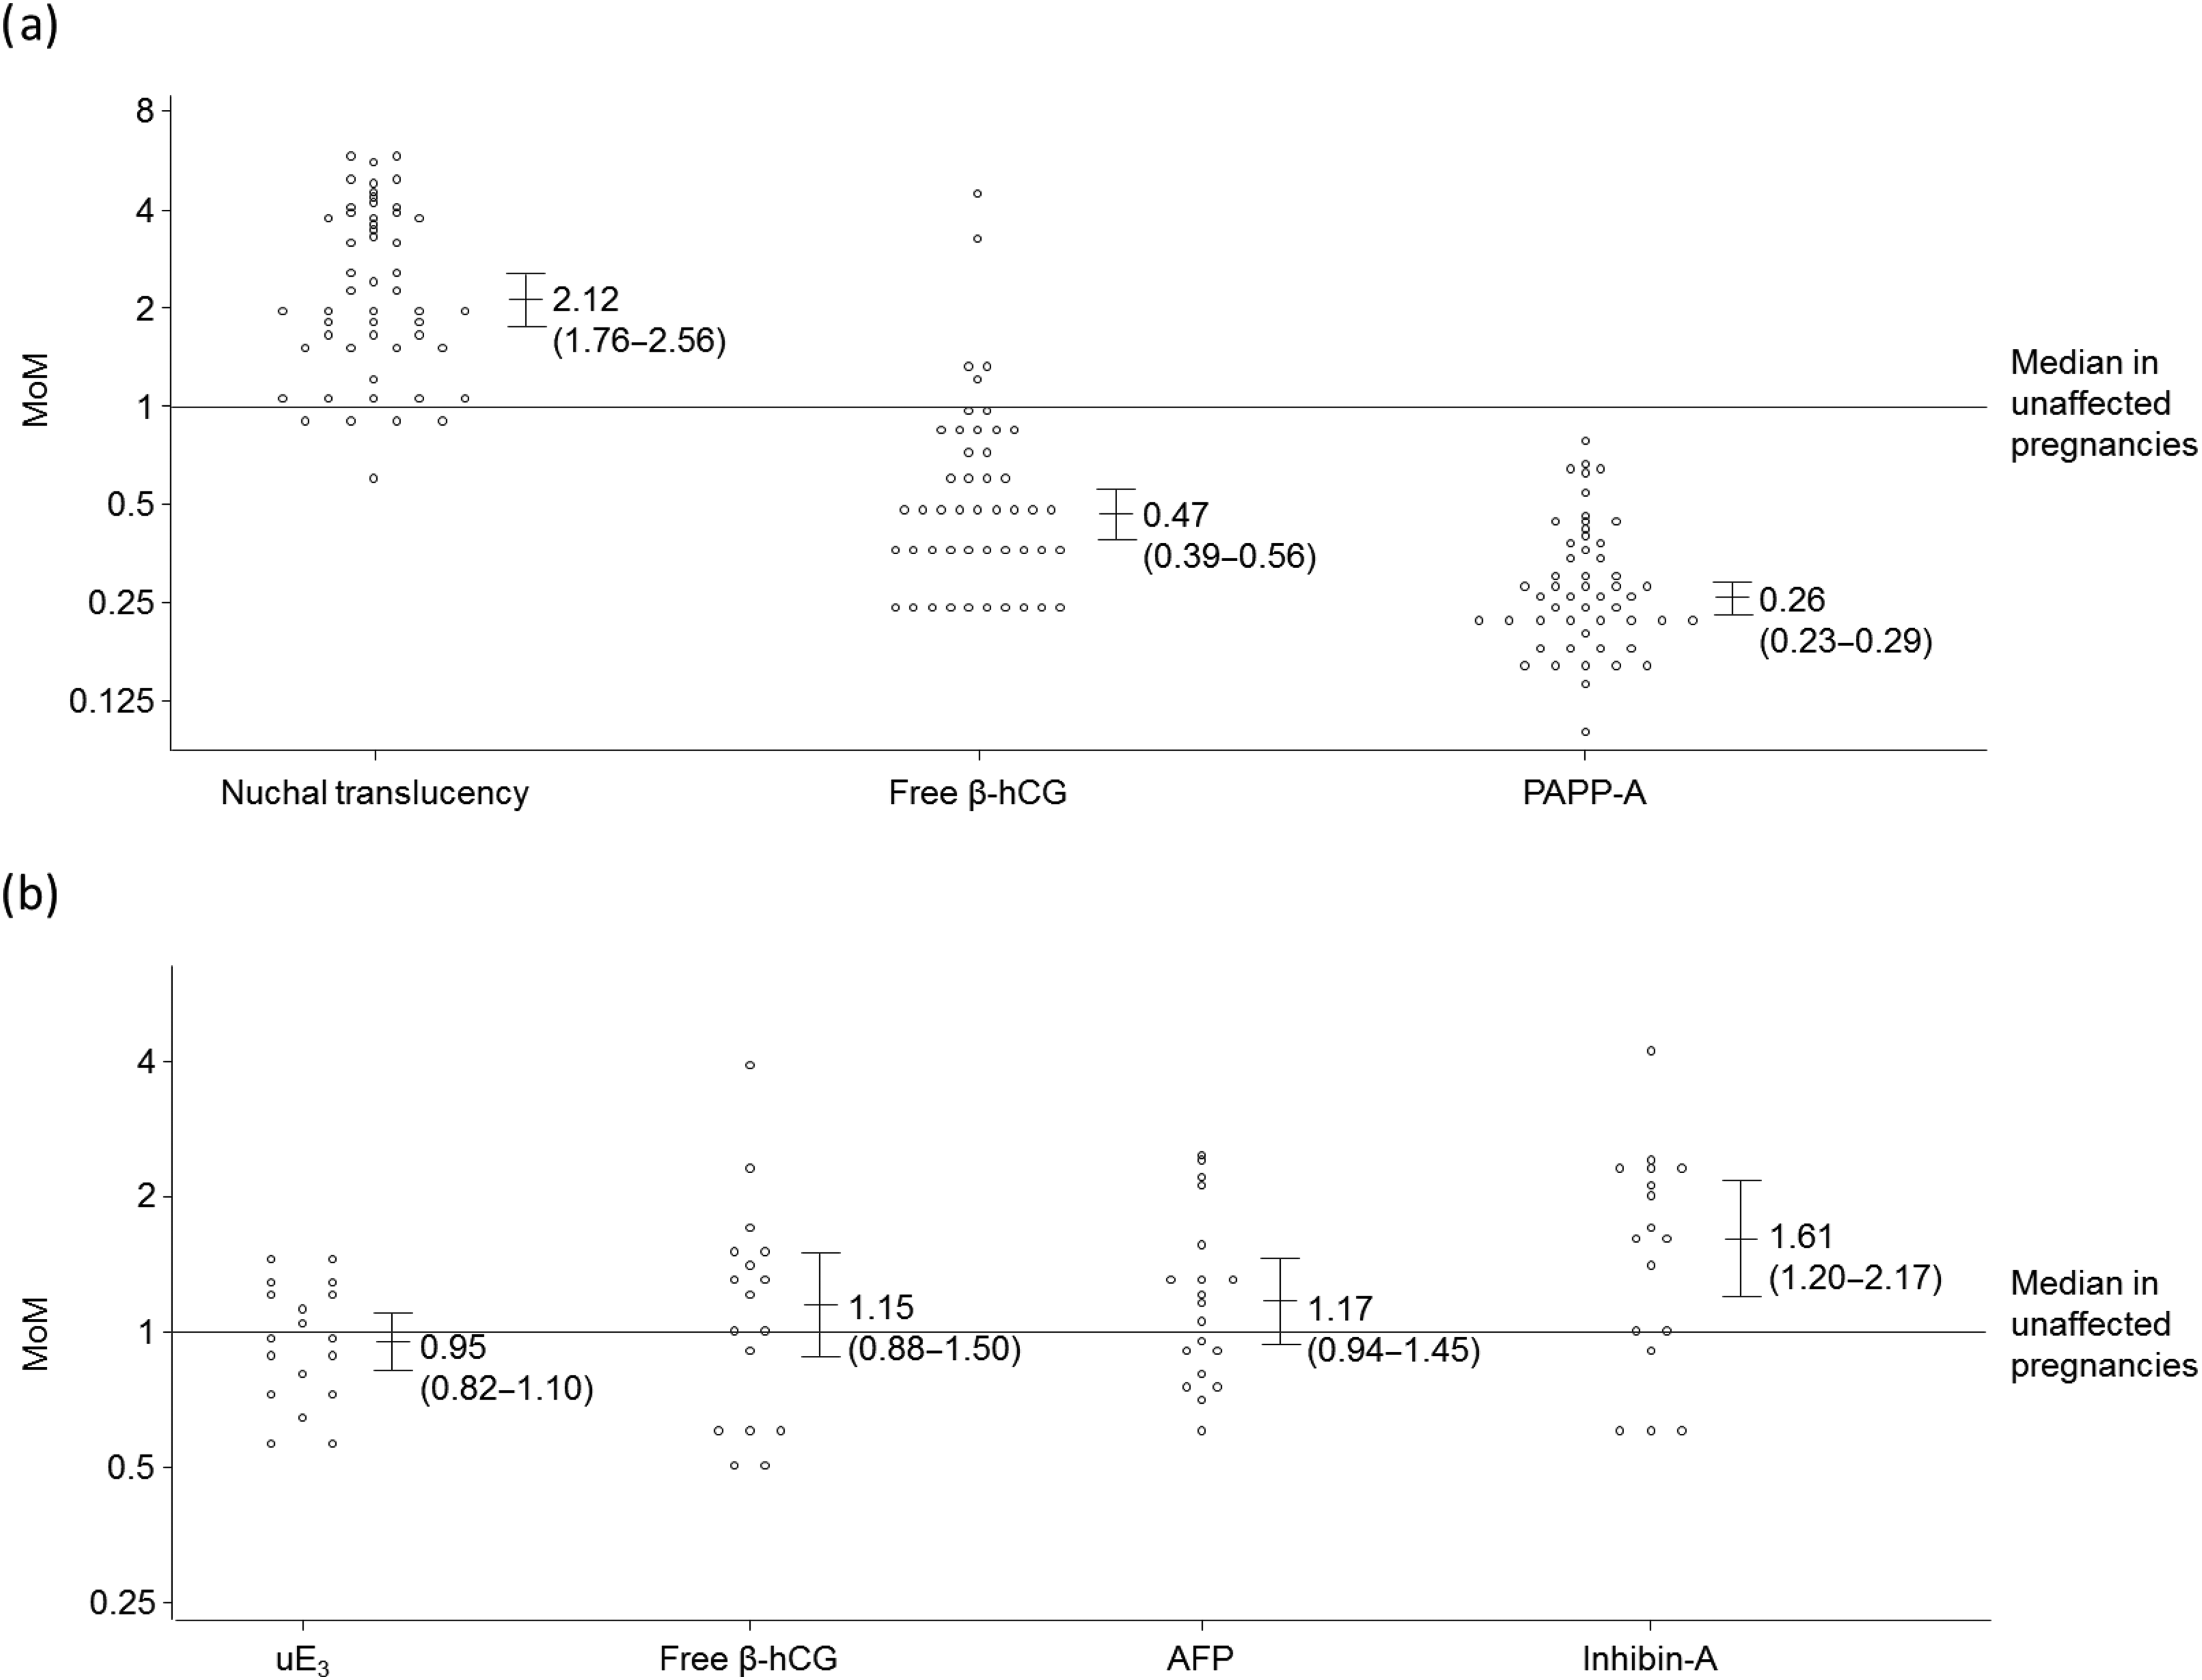
Figure 3 shows the proportion of DS, T18, T13 and unaffected pregnancies that are screen-positive using the Combined and Integrated tests with and without the addition of algorithms for the identification of T13 and/or T18 based on the markers in the DS screening tests that show significant difference between unaffected pregnancies and T18 or T13 pregnancies. False-positive rates were fixed at 2% for the DS screening tests and 0.2% for the T18 and T13 algorithms. With only DS screening being performed, 42% of T18 and 59% of T13 pregnancies are detected by the Combined test. With the addition of a T18 Combined test algorithm to the DS Combined test, 88% of T18 and 74% of T13 pregnancies are detected and the overall false-positive rate increases from 2.00% to 2.17%. There is no material effect on detection and false-positive rates with the addition of a T13 Combined test algorithm. The addition of a T18 Integrated test algorithm to the DS Integrated test increases the T18 detection rate from 40% to 92%, but has no material effect on the T13 detection rate. The false-positive rate increases from 2.00% to 2.12%. The further addition of a T13 Integrated test has no material effect on the T18 detection rate, but increases the T13 detection rate from 65% to 72% with a small increase in the overall false-positive rate to 2.18%.
Down's syndrome (DS), trisomy 18 (T18) and trisomy 13 (T13) detection rates, and false-positive rates according to screening algorithms used. (a) Combined test markers. NT, free β-hCG and PAPP-A; 2% false-positive rate for DS Combined test, 0.2% false-positive rates for T18 and T13 algorithms. (b) Integrated test markers. NT, PAPP-A, AFP, uE3, free β-hCG and inhibin-A; 2% false-positive rate for DS Integrated test, 0.2% false-positive rates for T18 (inhibin-A not used) and T13 (AFP, uE3, free β-hCG not used) algorithms. NT, nuchal translucency; PAPP-A, pregnancy associated plasma protein-A; β-hCG, beta-human chorionic gonadotrophin; AFP, alphafetoprotein; uE3, unconjugated estriol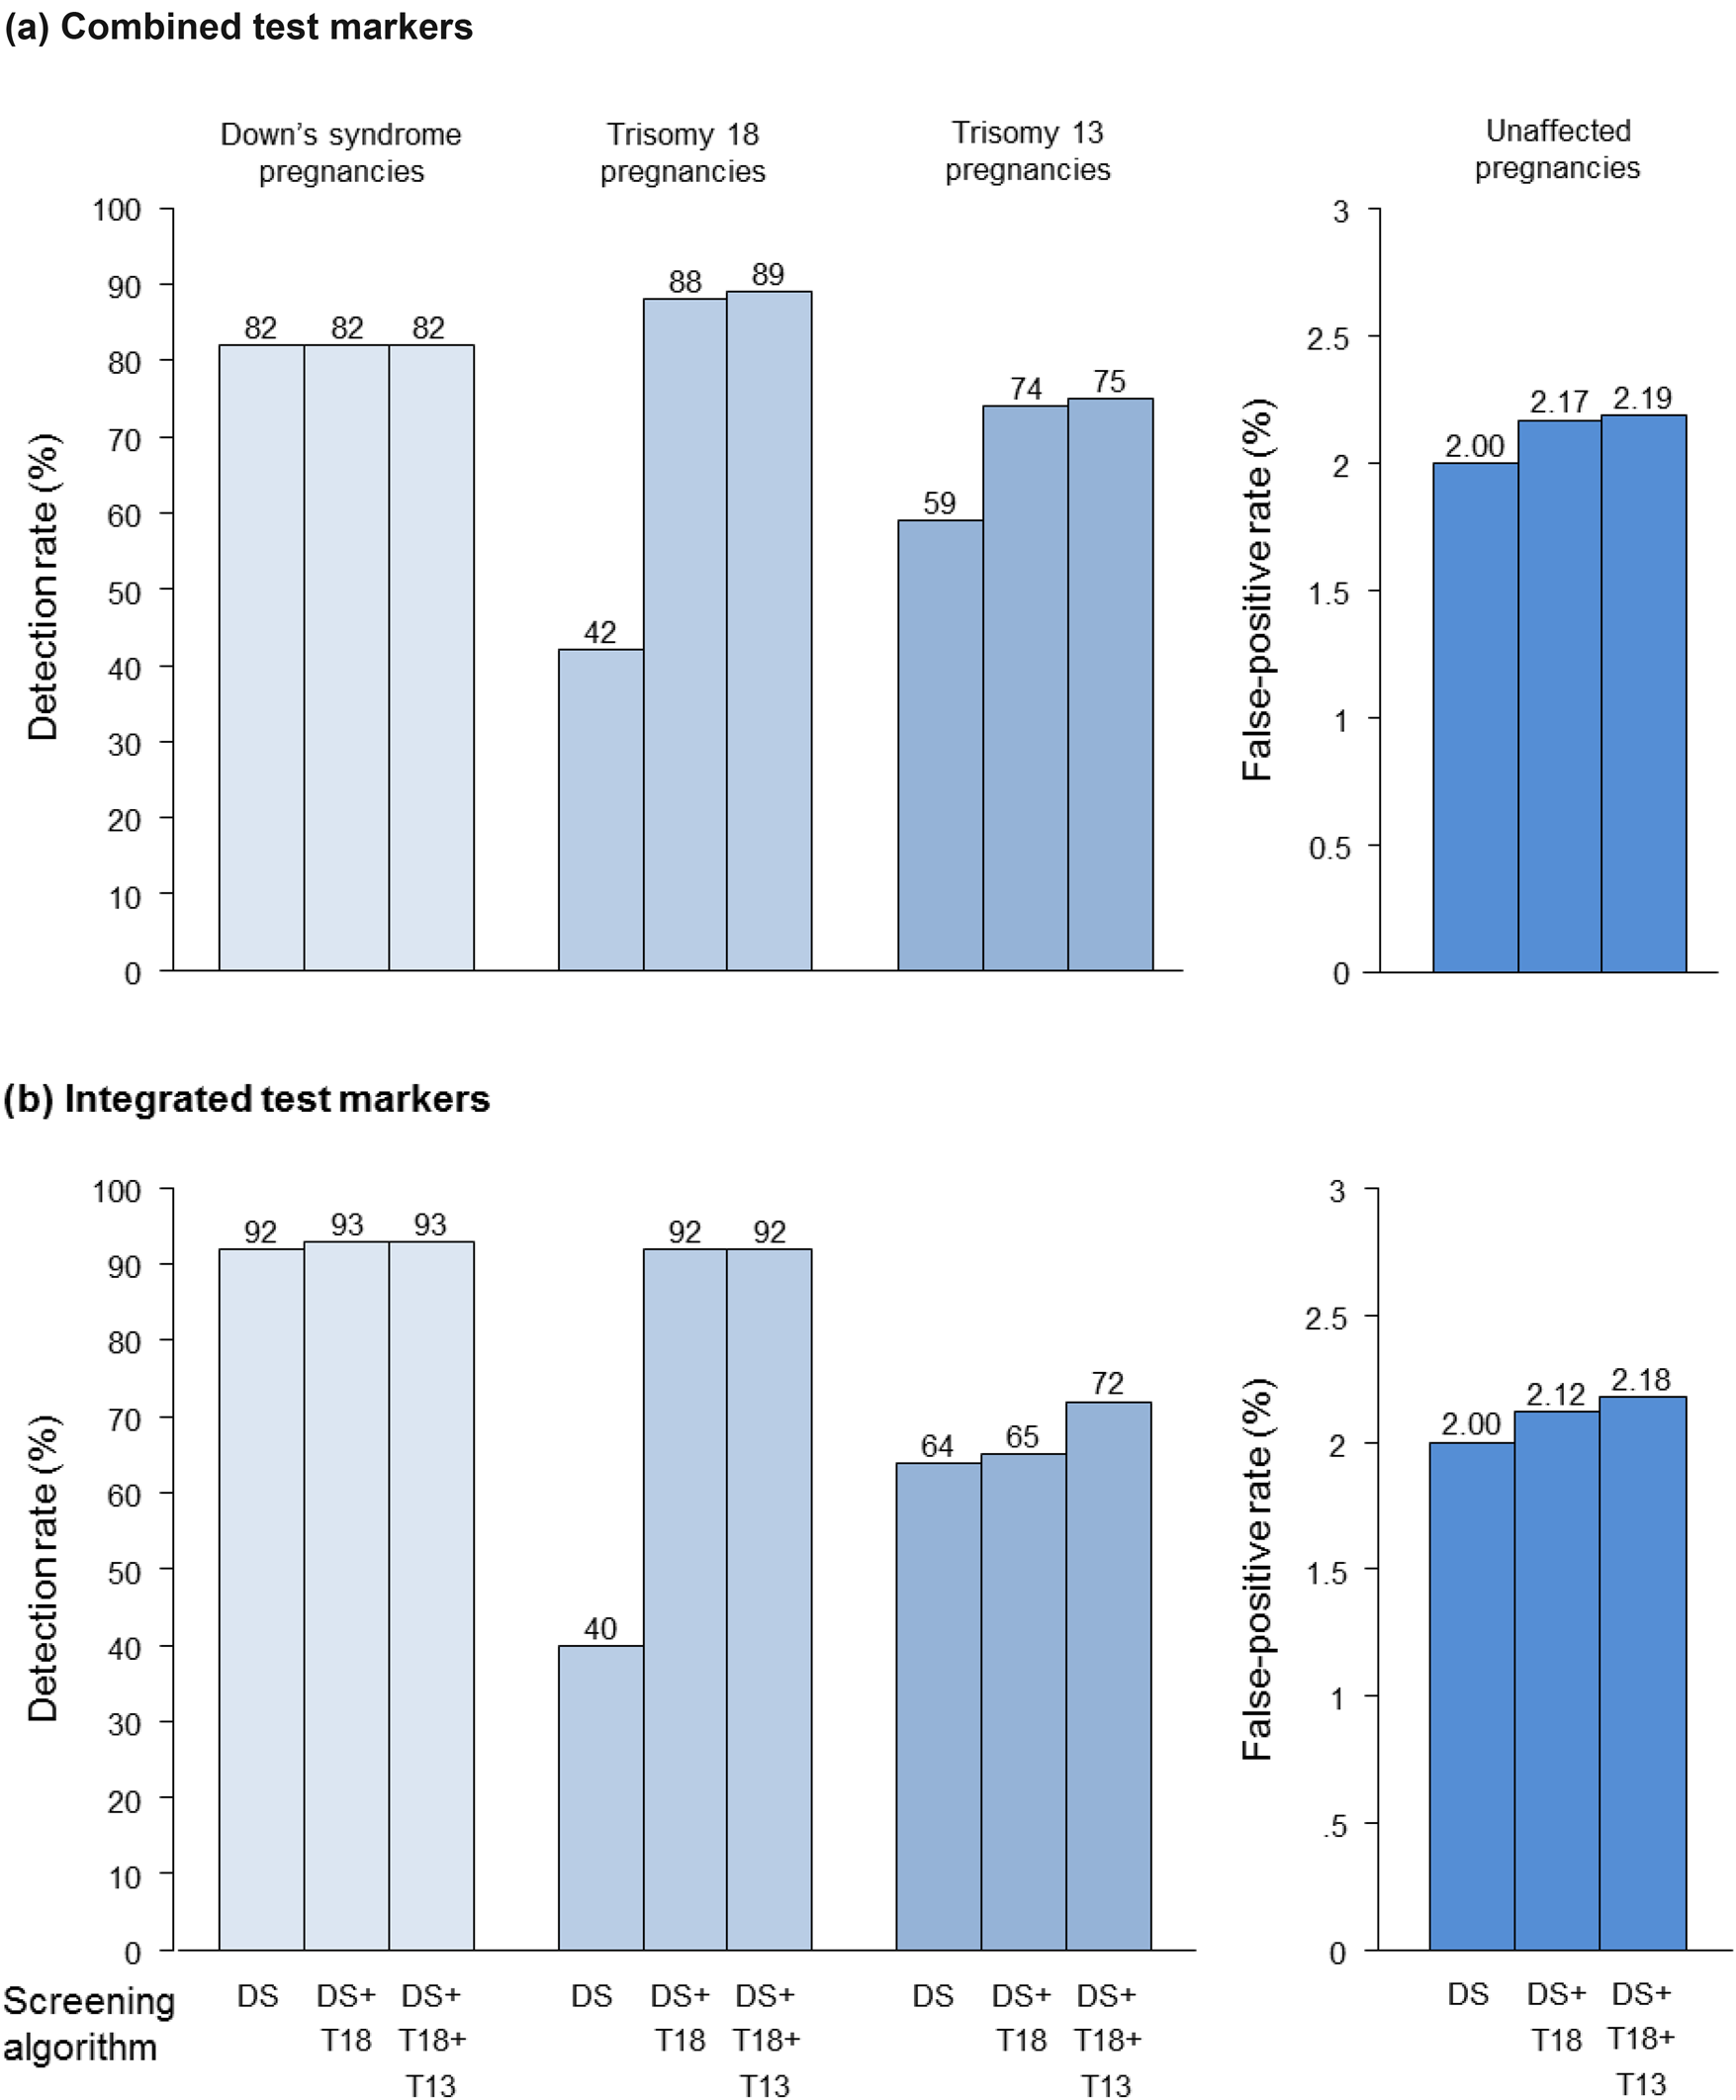
Figure 4 shows, in a similar way to Figure 3, results for the Quadruple and Serum Integrated tests. The addition of a T18 algorithm increases the T18 detection rate from 2% to 55% using the Quadruple test, and from 9% to 86% using the serum Integrated test. There is little advantage in adding a T13 algorithm to the Quadruple test, but there is an increase in the T13 detection rate from 32% to 49% with the addition of a T13 algorithm to the serum Integrated test. Table 1 shows results for all four tests, for a range of DS tests and T18 and T13 algorithm false-positive rates. Appendix Table A2 shows the T18- and T13-specific algorithm performances according to early second trimester risk cut-off. Risk cut-offs of 1 in 200, 1 in 150, 1 in 250 and 1 in 450 yield false-positive rates of about 0.2% for algorithms added to the Combined, Quadruple, Serum Integrated and Integrated tests respectively. The risk cut-offs for T13 are 1 in 100, 1 in 300, 1 in 100 and 1 in 100 respectively.
Down's syndrome (DS), trisomy 18 (T18) and trisomy 13 (T13) detection rates, and false-positive rates according to screening algorithms used. (a) Quadruple test markers. AFP, uE3, free β-hCG and inhibin-A; 2% false-positive rate for DS Quadruple test, 0.2% false-positive rates for T18 (inhibin-A not used) and T13 (AFP, uE3, free β-hCG not used) algorithms. (b) Serum Integrated test markers. PAPP-A, AFP, uE3, free β-hCG and inhibin-A; 2% false-positive rate for DS Serum Integrated test, 0.2% false-positive rates for T18 (inhibin-A not used) and T13 (AFP, uE3, free β-hCG not used) algorithms. PAPP-A, pregnancy associated plasma protein-A; β-hCG, beta-human chorionic gonadotrophin; AFP, alphafetoprotein; uE3, unconjugated estriol Detection rates (DRs, expressed as percentages) for Down's syndrome (DS), trisomy 18 (T18) and trisomy 13 (T13) and overall false-positive rates (FPRs as percentages) according to DS test and with the addition of a T18 algorithm, and T18 and T13 algorithms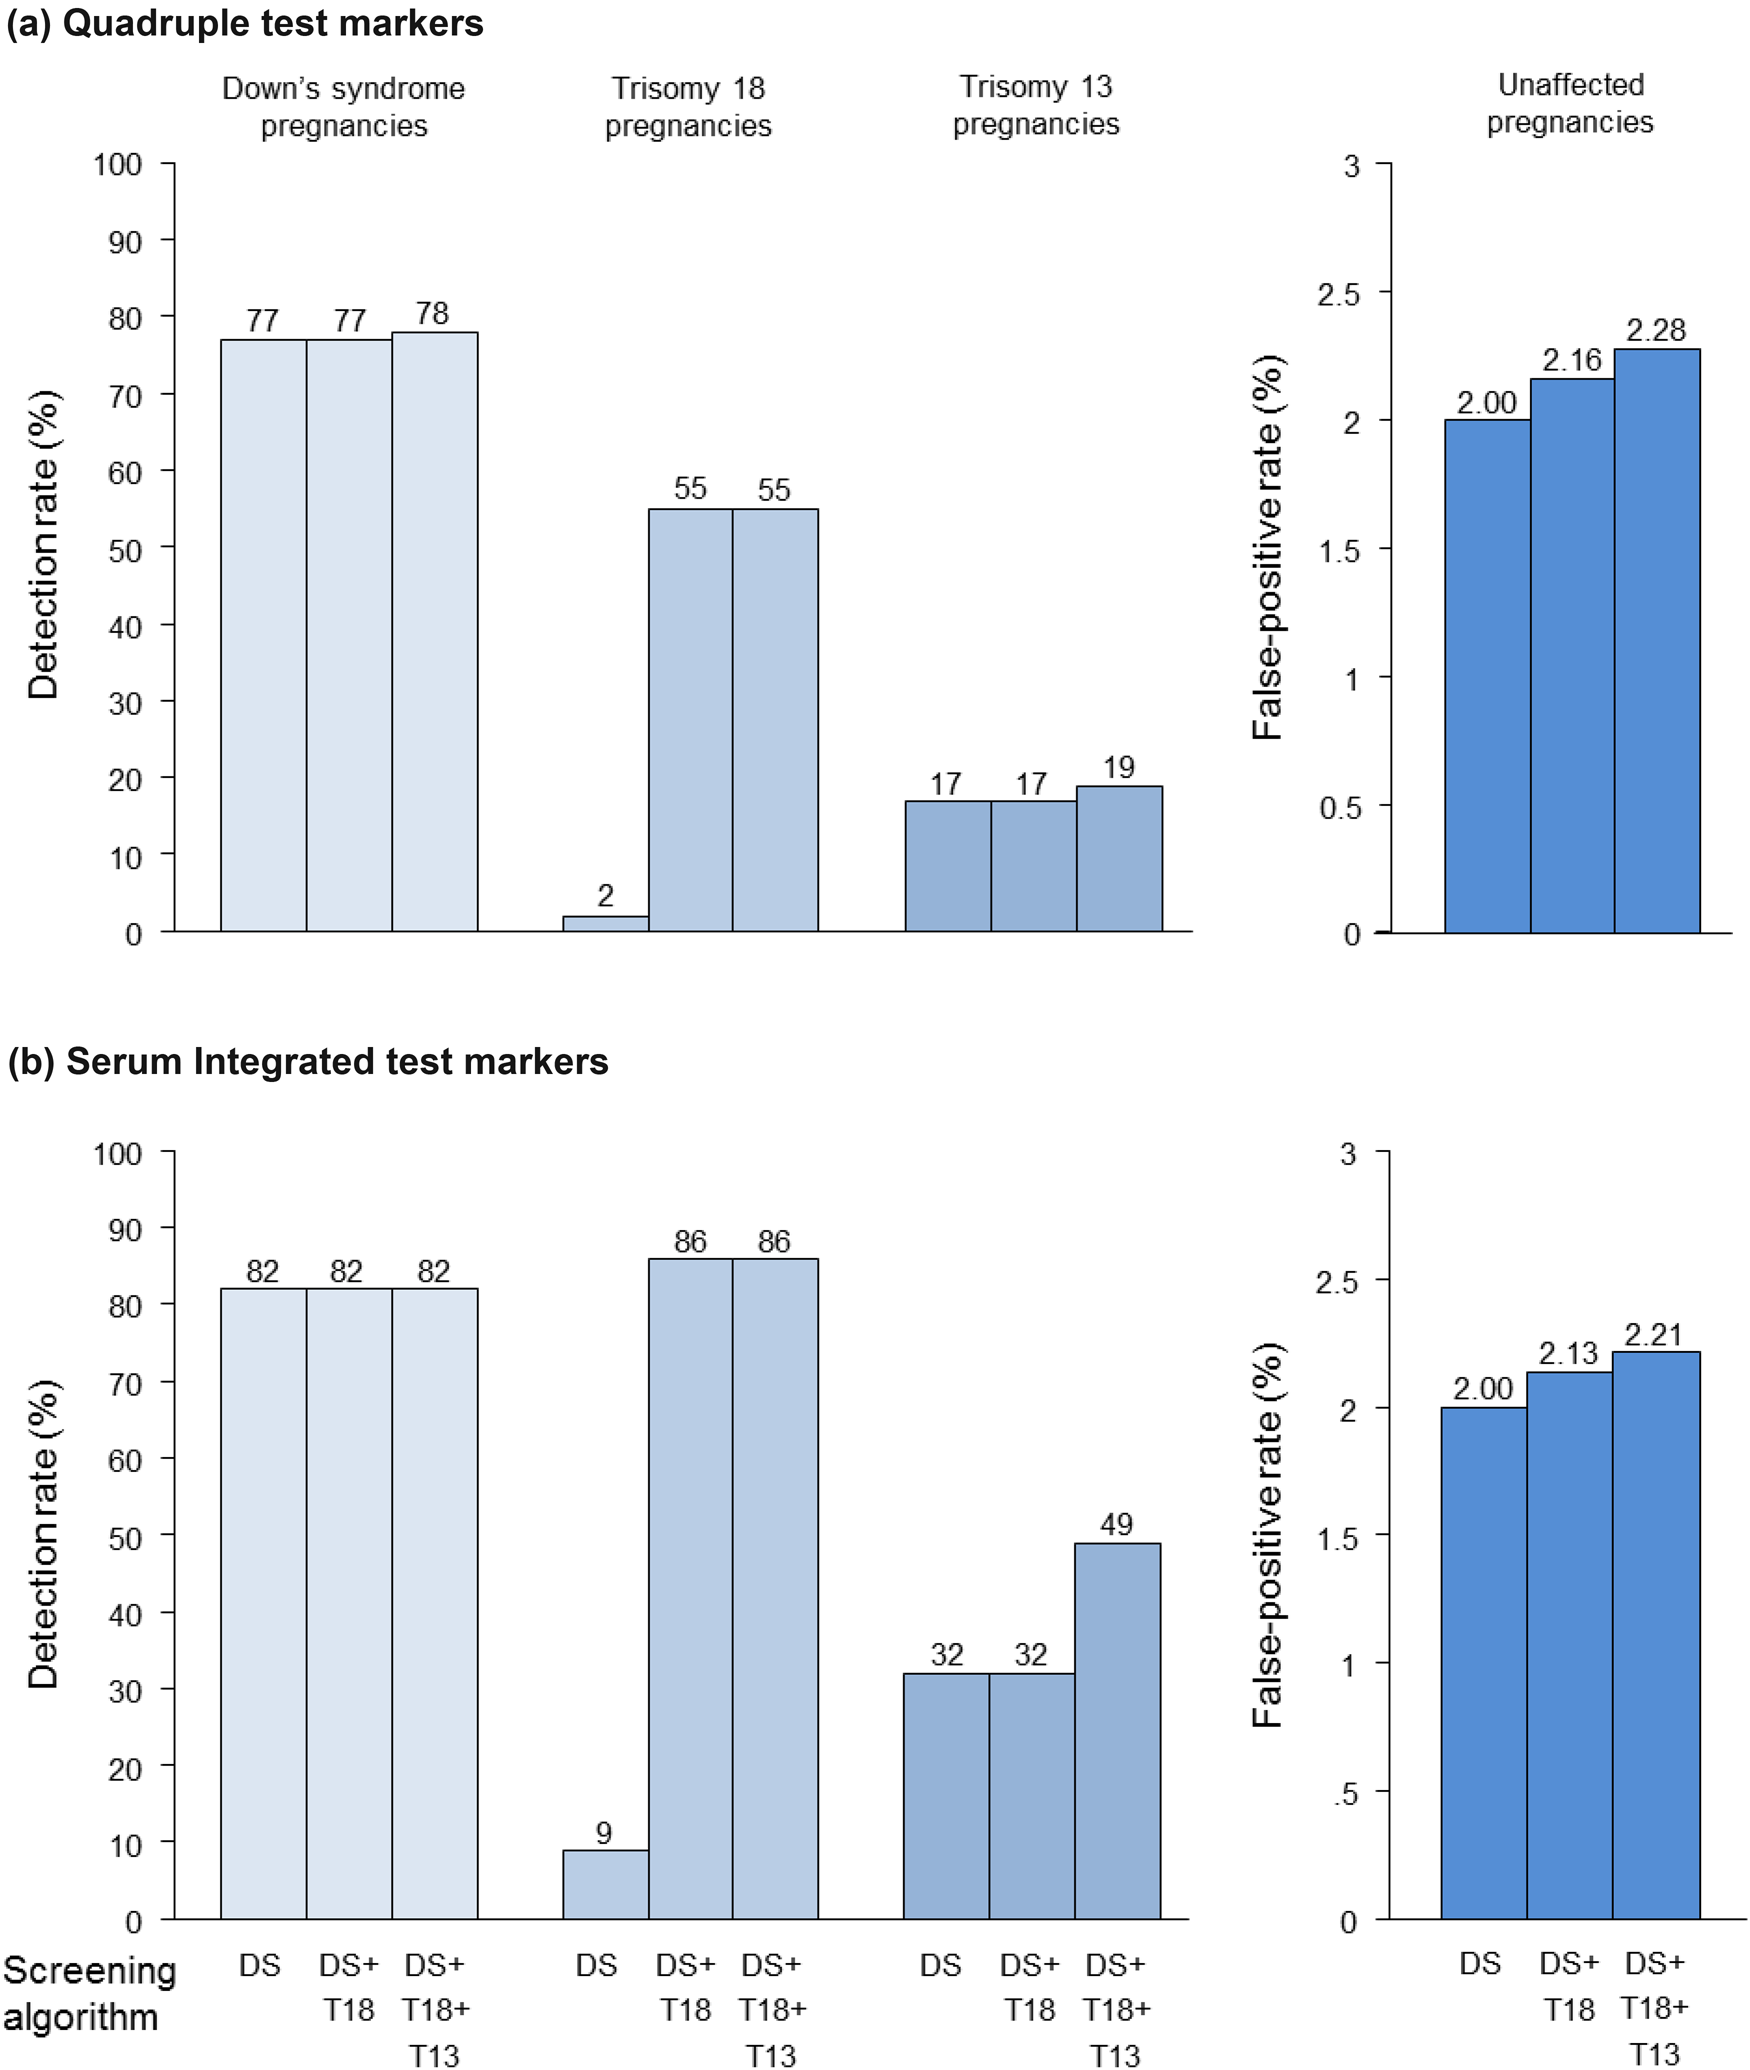
DISCUSSION
Our results show that 42% of T18 and 59% of T13 pregnancies are detected using the DS Combined test, with a 2% false-positive rate. Adding the T18 specific algorithm increased the detection rates to 88% and 74% respectively, with an increase in the false-positive rate to 2.2%. The further addition of the T13 specific algorithm had no material advantage. Similarly, our results showed that 40% of T18 and 64% of T13 pregnancies were detected using the Integrated DS test. Adding the specific T18 algorithm increased these to 92% and 65% respectively, with a small increase in the false-positive rate (to 2.1%). The further addition of the T13 specific algorithm had no material advantage in the detection of T18, but increased the T13 detection rate to 72%. Results for the Quadruple test showed a similar pattern to the Combined test, and results for the Serum Integrated test showed a similar pattern to the Integrated test.
Our study shows that the marker profiles for T18 and T13 are different, so a single additional algorithm for the identification of pregnancies affected with either T18 or T13 is not appropriate. Previous reports have described the effect on detection of T18 and T13 with the addition of algorithms for both disorders to DS tests. 7 Here we describe the effect of first adding a T18 algorithm, and then a T13 algorithm. The case for a T13 identification algorithm is not compelling; almost all pregnancies affected with T13 will be screen positive for either DS or T18. Only with the Integrated and Serum Integrated tests was there a material improvement in the identification of T13 pregnancies with the inclusion of a T13 algorithm (from 64% to 72% for the Integrated test, from 32% to 49% for the Serum Integrated test), but this would mean only about one more T13 pregnancy detected per 100,000 women screened. Nevertheless, if there is a need for a separate T13 risk, one could be provided.
The median values in our study for first trimester serum markers in T18 and T13 pregnancies are similar to those previously reported. 7 For second trimester markers, the median AFP, uE3 and free β-hCG are similar, 1,3,5,6 but our estimate for inhibin-A (1.11 MoM; not statistically significantly different from 1.00) is larger than that previously reported by Lambert-Messerlian et al. 2 (0.88 MoM; statistically significantly different from 1.00); however, our data are based on about three times more T18 pregnancies (66 versus 21).
The distribution parameters for NT are uncertain because some pregnancies with high NT measurements are immediately offered diagnostic testing without proceeding to serum testing, resulting in an underestimation of the median NT MoM. Consequently, the performances of T18 and T13 algorithms that include use of an NT measurement are likely to be underestimated. Also, T18 and T13 pregnancies have a high miscarriage rate (20% between 12 and 18 weeks gestation in T18 pregnancies and 12% in T13 pregnancies 15 ), and those with high NT measurements are more likely to miscarry than pregnancies with lower NT measurements. This will tend to have an opposite effect and the performances of the Integrated test algorithms are likely to be overestimated because of the miscarriage of pregnancies with high NT measurements (the estimation of distribution parameters for NT are dominated by results from women who were screened for DS using the first trimester Combined test). These two issues will largely cancel each other out for the T18 and T13 Integrated test algorithms, but the first issue remains for Combined test algorithms. However, a sensitivity analysis in which the median NT MoM was taken as 2.5 instead of 1.71 for T18 did not materially affect performance of the T18 Combined test algorithm, a three percentage point increase in the T18 detection rate (from 88% to 91%) at a 0.2% false-positive rate. Using a median MoM of 3.0 instead of 2.12 for T13 resulted in a larger increase in the T13 detection rate (from 65% to 78%) for the same 0.2% false-positive rate. The latter is unlikely to have much effect on the detection of T13 because over 60% of T13 pregnancies are detected using the DS and T18 algorithms, and adding the T13 algorithm adds only a percentage point increase in detection for the same 0.2% false-positive rate (see Figure 3).
In reporting risks, it may be beneficial to provide an overall risk of a pregnancy being affected with DS, T18 or T13. If a woman was screened positive for DS, T18 and T13, for example, if she had a DS risk of 1 in 25 (4%), a T18 risk of 1 in 5 (20%) and a T13 risk of 1 in 10 (10%), then her risk of having a pregnancy affected with DS or T18 or T13 is 1 in (1/[1–0.96 × 0.80 × 0.90]) = 1 in 3. This overall risk could be reported, together with separate risks for each disorder.
This study, like others on the same subject, has unavoidable limitations, mainly arising from the high miscarriage rate in T18 and T13 pregnancies and the fact that the population studied is not a random sample of cases in the population. This means that there is considerable uncertainty in the risk of T18 and T13 given to individual women at different stages of pregnancy. However, the separation between affected and unaffected pregnancies is large, so estimates of overall detection and false-positive rates are likely to be reasonably accurate.
Because the identification of T18 and T13 is an ‘add-on’ to DS screening, the false-positive rate for T18 and T13 algorithms needs to be kept low to avoid a large increase in the number of women exposed to invasive diagnostic testing as a result of the DS screening; all algorithms, apart from second trimester inhibin-A for the identification of T13, achieve a high enough detection rate while maintaining a low false-positive rate.
DECLARATION OF INTERESTS
NW has a patent for the Integrated test. He is Director of Logical Medical Systems Ltd, which produces software for the interpretation of Down's syndrome screening tests. NW and JB have a patent for reflex DNA screening.
Footnotes
Appendix A
Statistical parameters of first and second trimester markers in trisomy 18 and trisomy 13 pregnancies MoM, multiples of the unaffected median; SD, standard deviation; NT, nuchal translucency; PAPP-A, pregnancy associated plasma protein-A; β-hCG, beta-human chorionic gonadotrophin; AFP, alphafetoprotein; uE3, unconjugated estriol Trisomy 18 and trisomy 13 detection rates, and false-positive rates according to algorithm and early second trimester risk cut-off DR, detection rate; FPR, false-positive rate *First trimester nuchal translucency (NT), free β-human chorionic gonadotrophin (hCG) and pregnancy associated plasma protein-A (PAPP-A)
†Second trimester alphafetoprotein (AFP), unconjugated estriol (uE3) and free β-hCG
‡First trimester PAPP-A, second trimester AFP, uE3 and free β-hCG
§First trimester NT and PAPP-A, second trimester AFP, uE3 and free β-hCG **First trimester PAPP-A, second trimester inhibin-A
††First trimester NT and PAPP-A, second trimester inhibin-A
First trimester markers
Second trimester markers
NT
Free β-hCG
PAPP-A
AFP
uE3
Free β-hCG
Inhibin-A
Median (log10)
0.2330
−0.7959
−0.7959
−0.1427
−0.3279
−0.6021
–
SD (log10 MoM)
0.3499
0.2919
0.3209
0.1745
0.1502
0.3300
–
Truncation limits (MoM)
0.94–2.50
0.30–1.00
0.20–0.80
0.40–1.20
0.50–1.00
0.60–1.00
–
Correlation with:
First trimester
Free β-hCG
0.1975
1
0.2599
–
–
–
–
PAPP-A
0.0429
0.2599
1
–
–
–
–
uE3
–
–
–
0.0923
1
0.1226
–
Free β-hCG
–
–
–
0.1342
0.1226
1
–
Median (log10)
0.3263
−0.3279
−0.5850
–
–
–
0.2068
SD (log10 MoM)
0.3014
0.2743
0.1986
–
–
–
0.2714
Truncation limits (MoM)
0.90–2.50
0.30–1.35
0.20–0.50
–
–
–
0.50–2.00
Correlation with:
First trimester
Free β-hCG
−0.1541
1
0.1476
–
–
–
–
PAPP-A
−0.1418
0.1476
1
–
–
–
–
Second trimester
Inhibin-A
–
–
–
–
–
–
1
Risk cut-off (early second trimester)
1 in 50
1 in 100
1 in 150
1 in 200
1 in 250
1 in 300
1 in 350
1 in 400
1 in 450
1 in 500
Test (all include maternal age)
DR (%)
FPR (%)
DR (%)
FPR (%)
DR (%)
FPR (%)
DR (%)
FPR (%)
DR (%)
FPR (%)
DR (%)
FPR (%)
DR (%)
FPR (%)
DR (%)
FPR (%)
DR (%)
FPR (%)
DR (%)
FPR (%)
Combined*
70
0.05
79
0.10
86
0.17
88
0.21
89
0.26
90
0.32
91
0.37
91
0.42
92
0.47
92
0.51
Triple†
34
0.03
48
0.11
57
0.19
65
0.27
73
0.41
74
0.50
76
0.62
77
0.74
78
0.85
79
0.95
Serum Integrated‡
71
0.03
78
0.08
82
0.13
85
0.17
86
0.21
88
0.25
89
0.29
90
0.33
90
0.38
91
0.42
Integrated§
75
0.02
82
0.05
85
0.07
87
0.10
88
0.12
89
0.15
90
0.17
91
0.18
91
0.20
92
0.22
Combined*
58
0.09
65
0.21
70
0.35
73
0.52
75
0.70
77
0.87
78
1.03
80
1.20
81
1.36
82
1.51
Inhibin-A
0
0
0
0
0.1
0.003
1.4
0.03
4.0
0.10
6.3
0.19
6.9
0.24
10
0.38
13
0.56
13
0.65
Serum Integrated**
30
0.07
44
0.22
52
0.40
58
0.61
62
0.83
66
1.07
69
1.35
71
1.59
73
1.88
75
2.10
Integrated††
58
0.06
65
0.17
69
0.28
72
0.40
75
0.54
77
0.67
78
0.81
79
0.95
80
1.08
81
1.21