
Abstract
This research aims to characterize the mechanical and thermal properties of a blend of epoxy (EPR) and polysulfide (PS) that incorporates alumina trihydrate (ATH) nanoparticles (NPs). The purpose is to investigate the effect of adding NPs on the properties of the resulting epoxy-polymer blends. The polymer blend nanocomposites (PBNCs) were prepared from EPR and PS by adding different concentrations (1 wt.%, 3 wt.%, and 5 wt.%) of ATH NPs. The hand lay-up molding method was utilized to prepare the samples. The mechanical and thermal characteristics of the specimens have been studied. The structure and formation of the blend (EPR/PS) and the dispersion of NPs inside the blend and epoxy were confirmed by X-ray diffraction (XRD) analysis and scanning electron microscopy (SEM). Mechanical behaviour through tensile, flexural, and hardness tests was carried out on polymer blends and composites. The results show that the maximum toughness for PBNCs and EPR NCs was recorded at 5 wt% ATH NPs, exhibiting enhancements of 54.22% and 206.5% above pure EPR, respectively. Maximum elongation at break is observed at 5 wt.% of ATH nanoparticles, with increases of 312.45% and 425.36% for PBNC and EPR nanocomposites, respectively, in comparison to EPR. The maximum hardness is 86.26 at 5 wt.% of ATH nanoparticles for EPR nanocomposites. While the maximum flexural strength (75.05 MPa) and flexural modulus (2406.69 MPa) for EPR NCs exhibited increases of 20.62% and 37%, respectively, in comparison to EPR (1756.73 MPa). The XRD pattern showed a favourable interaction among the components in the EPR/PS blend and the NCs. SEM micrographs revealed that the blend has a single face, and the NPs were effectively dispersed into the prepared composites. The examination of thermogravimetric analysis-derivative thermogravimetry (TGA-DTG) data indicates that the enhanced thermal stability of EPRNCs and PBNCs contrasts with that of the EPR/PS blend.

Keywords
Introduction
Polymer blending has been encouraged by the fact that new materials can progress with superior properties in a relatively shorter period of time and with a lower investment. 1 An exciting field within materials science is polymer blending, which offers a dynamic landscape for researchers and engineers to investigate the intricate balance of properties and performance.2,3 The matrix polymer, the dispersed polymer, the distribution of components within the matrix, and the interactions at the polymer-polymer interface all impact the characteristics of a blend system.4–6 Blending polymers can be an inexpensive method to develop a material with specific properties based on customer requirements.6,7 It is a common method to achieve properties that aren’t present in the original polymer components. For instance, incorporating an elastomer into a rigid polymer can enhance the mixture’s flexibility and impact resistance.8–11
Composite materials, in general, and polymeric nanocomposites, in particular, are among the advanced materials that are widely used in various fields, such as manufacturing parts of automobiles and aircraft structures, marine, biomedical engineering adhesives and coating applications,12–15 due to their good mechanical and physical properties, eco-friendly properties and inexpensive contrast with metals and other materials. 13
Recent research in nanotechnology highlights the significant interest in polymer nanocomposites due to their improved physical, mechanical, and thermal properties achieved with low filler loadings. The characteristics of these nanocomposites are influenced by various factors, including the type of nano-filler, the amount used, and the processing methods employed.16–19
Among the resins that used widely in polymer blending is epoxy resins that have high adhesive quality and rigidity and are also good for chemical and heat resistance.15,20,21 Epoxy is commonly reinforced with other materials, including rubbers and nanoparticles, to increase its performance in both mechanical and chemical aspects.12,22–24 The key disadvantage of cured epoxy is its inherent brittleness, which results from the high cross-link density associated with its curing process. This brittleness makes it less crack-resistant and severely lacks impact strength. To overcome this problem, it has been researched on the nanoscale, and so-called epoxy nanocomposites were developed.19,25,26 These modifications can lead to a large enhancement in the fracture toughness while maintaining other beneficial properties.22,27
Polysulfides and epoxies copolymerize to combine the soft and rigid properties, making them suitable for visible features such as paints, sealants, flexible anti-corrosion coatings, construction for concrete repair, and marine coatings. However, introducing polysulfide can significantly affect some of the desired properties of epoxy resins, such as elastic modulus, tensile strength, and glass transition temperature.23,27–29
There are numerous previous studies related to polymer blends and their industrial applications; for instance, Nagalingam et al. 30 studied various mixtures of polyester resins, fibers, and nano-clays (montmorillonite) with differing percentages. They found that as the percentage of nano-clay increased, the ultimate tensile strength decreased, while the impact strength increased. Mohamed 9 investigated the toughening of epoxy using polysulfide rubber (PSR). He demonstrated that the addition of PSR enhances impact resistance and elongation at break, but it leads to a reduction in modulus and tensile strength. Sun et al. 31 carried out a study on epoxy polymer blends. The investigation involved using polysulfone (PSF) to enhance and alter the epoxy properties. The impact strength and fracture toughness of PSF/epoxy blends show a notable enhancement and a marginal gain in thermal stability when compared to neat epoxy. Salih et al. 32 conducted an estimation of various physical and mechanical properties of a composite material. This composite comprises an epoxy/styrene-butadiene-rubber blend serving as the matrix, reinforced with copper oxide (CuO) at a weight fraction of 3 percent. The hand lay-up process was utilized to produce a composite material. The findings indicated that the addition of CuO nanofiller improved the tensile and impact traits of the blend. Ejaz et al. 33 made composite materials using polyester and jute as base materials. Then they added different concentrations of ATH and zirconium hydroxide (ZHO) nanoparticles. They found that the composites enhanced thermal and mechanical properties.
Madhu et al. 34 conducted a comparative study of the influence of micro ATH and carbon nanofillers on the thermal characteristics of nanocomposites developed from glass fiber and a modified epoxy resin, incorporating graphene nanoplatelets (GNP), multi-walled carbon nanotubes (MWCNT), and ATH fillers. They found that the MWCNT/GNP-ATH composite exhibits improved thermal stability attributable to the incorporation of ATH filler. Sung et al. 35 synthesized composites by combining epoxy resin with benzoxazine resin and an ATH additive. The researchers examined the influence of composites and surface modification on the flame-retardant and mechanical properties of a modified ATH incorporated into a 60/40 epoxy/benzoxazine blend. They concluded that the combined use of ATH and benzoxazine exhibited significant synergism in terms of flame retardancy and mechanical properties. Wu et al. 36 investigated the influence of alumina nanoparticles on the mechanical properties of the epoxy/Al2O3 nanocomposite. At 3.0 wt.% of Al2O3, the tensile strength, elongation at break, and impact strength were increased by 82.60%, 33.38%, and 63.58%, respectively, in comparison with pure epoxy resin. The researchers demonstrate good dielectric properties and excellent thermal stability. Yazman et al. 12 conducted a study on the influence of incorporating MWCNT and Al2O3 nanoparticles into the epoxy matrix at varying concentrations from 0.5 to 2.0 wt.%, which affected the chemical, thermal, and mechanical properties of nanocomposites. They found that the most notable improvement in mechanical properties was achieved by incorporating 1.25 wt.% CNT and 1.0 wt.% Al2O3, respectively. Kozako et al. 37 prepared epoxy/alumina nanocomposites by dispersing various amounts (3, 5, 7, and 10 wt.%) of boehmite alumina nanofillers into bisphenol-A epoxy resin. At a content of 5 wt%, the mechanical properties, such as flexural strength and flexural modulus, improved by 5% and 8%, respectively. Kolar et al. 38 investigate the influence of structurally distinct aluminum (tri/mono) hydroxide nanoparticles (Al (OH)3/AlO (OH)), their dispersibility, and loading quantity on the optical, mechanical, thermal, and heat transfer properties of films derived from microfibrillated cellulose (MFC). The incorporation of ATH/AMH nanoparticles substantially enhanced the thermal stability of the MFC films. Shah et al. 39 extensively incorporated ATH into polypropylene (PP) to create a fire-retardant composite and presented the effect of the concentration of ATH on the strength of the PP/ATH composite. Tensile, flexural, and fracture properties were studied. The tensile strength, flexural strength, and fracture toughness of the composite decrease with the increment of ATH content; however, the elastic modulus of the composite slightly increases with the increment of ATH content.
The focus of this research is on exploring the mechanical and thermal properties of PBNCs and the influence of ATH NP concentration on neat ERP and ERP/PS blends. This topic is important, yet still needs more attention, as there are still discussions on it. Science polysulfide epoxy is used for industrial and specialty coatings; the resin’s mechanical and thermal characteristics are important and need a complete study. For this purpose, compositions were prepared by adding ATH in 1, 3, and 5 wt.%. Mechanical tests through tensile, flexural, and hardness and thermal analysis through TGA, DTG and DSC were conducted. Both XRD and SEM were used to support the findings. The results yield to preliminary findings that evaluated the properties of the epoxy and polymer blend nanocomposites.
Materials and methods
Materials
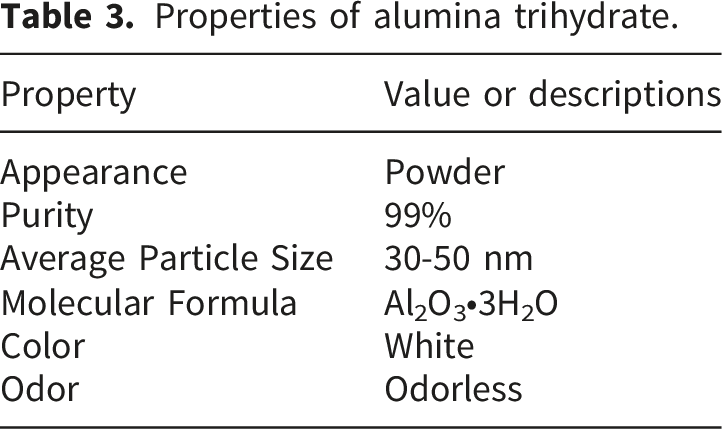
The base matrix in this research is EPR, while the blended matrix system comprises epoxy resin and polysulfide rubber. Quickmast 105® (DCP) is a thermosetting epoxy resin containing an epoxide group, produced by the Quick Mast company. The hardener from the same manufacturer is utilized to cure the epoxy resin. Polysulfide rubber comprises sulfur within a sequence of linear polymers branded as Don Construction Products. The polysulfide is provided as white dough. After adding lead oxide (Pb-O2) (black dough) in a 1:16 ratio, it changes into a form of elasticity with a density of 1.35 g/m3. The 30–50 nm-sized, high-purity (99%) alumina trihydrate nanoparticles were purchased from Nanochemazone.
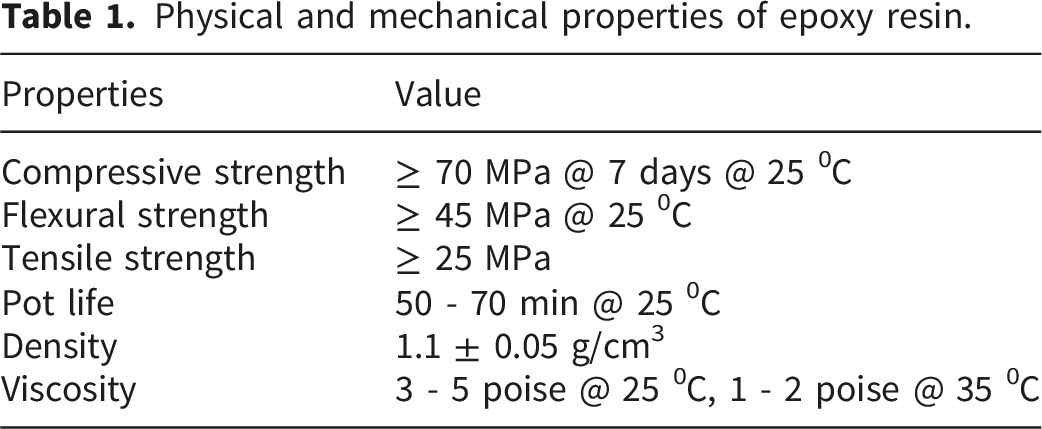
Physical and mechanical properties of epoxy resin.
Properties of polysulfide.

Properties of alumina trihydrate.
Fabrication of samples
All samples in this study were fabricated utilizing the hand lay-up technique. Figure 1 presents a schematic diagram of the fabrication process, followed by mechanical testing and characterization methods. A laser CNC machine was used to manufacture the mold from acrylic for tensile (ASTM D638), flexural (ASTM D790), and hardness (ASTM D2240) tests. Based on the compositions of the samples shown in Table 4, the different sets of EPR, EPR/PS blend, EPR-ATH NPs, and PBNC, as shown in Figure 2, were prepared according to the mentioned standards. Schematic diagram of the method. Compositions of the prepared samples. Fabricated samples.


The blends were prepared by adding 5, 10, 15, and 20 weight percentages of polysulfide rubber into epoxy resin. The polymeric blend matrix was presented by mixing the resins of both epoxy and polysulfide rubber via an ultrasonic homogenizer. A sequence of on-off pulsed ultrasonic modes was applied for 5–15 seconds, and each mixed solution was processed for 2 hours until achieving homogeneity. To remove air bubbles from the mixtures, the blend was subjected to a vacuum for 30 minutes for degassing prior to the addition of the hardener. The amount of hardener in the weight ratio of 1:5 of EPR and 1:16 of polysulfide (1 g of lead oxide to 16 g of polysulfide) was added to the mixture of epoxy-polysulfide. The final mixture was gently swirled manually for 8 minutes.
After the mixture became homogeneous enough, it was slowly poured into the fabricated mold by hand lay-up molding from one side only to eliminate the entrapment of air and left to cure at ambient temperature for 48 hrs. The chemical cross-linking reactions between the EPR are formed during the curing process. A lubricant was utilized to easily remove the mixture of epoxy from the mold after curing. Thereafter, the specimens were placed in an oven at 50°C for 3 hours to post-cure the composite. Before conducting the mechanical tests, the samples were maintained for 24 hrs at room temperature. To prepare EPR NCs and PBNCs, ATH NPs with a content of 1, 3, and 5 wt.% were added into the pure epoxy resin and polymer blend. The EPR NC and PBNC samples were made in two stages: initially, the fillers were dispersed in the EPR matrix, followed by the curing of the mixes. To remove air bubbles from the NCs, the mixture was degassed under vacuum for 30 minutes before the addition of the hardener. The hardener was added to the EPR NCs mixture at a weight ratio of 1:5. The final mixture was softly stirred for 5 minutes by manual mixing. After the mixture became homogeneous enough, it was slowly poured into the mold and left to be cured at ambient temperature for 48 hrs. After curing, the specimens were extracted from the mold and underwent a post-curing process for 3 hrs at 50°C to ensure that all samples were post-cured at the same temperature.
Characterization
The specimens were tested using a Cussons Technology Universal Testing Machine with a maximum load capacity of 100 kN. The tensile test was performed at ambient temperature and a crosshead speed of 5 mm/min. A three-point flexural test was conducted using a crosshead speed of 2 mm/min and a span length of 64 mm. The Shore D hardness of the prepared samples was measured to assess the surface’s mechanical property. The hardness data are the mean of ten measurements obtained from various sections of the samples.
The WinTest software was employed to conduct tests and gather results. At least three samples were tested for each component, and the average results were reported. The tensile test results have been used to choose the blend matrix with the percentage of PS that has the best mechanical properties. This has been selected to prepare polymer-blend (90 wt.% EPR and 10 wt.% PS) nanocomposites. The samples’ structure was analyzed using a Philips PW 1730 X-ray diffractometer, employing Cu-Kα radiation at a wavelength of 1.5406 Å, to investigate the materials under study. The relevant data were acquired at a glancing angle (2θ) between 10° and 80°, with a step size of 0.05°.
The morphologies of the fractured surfaces of the tensile samples were characterized using an Axia Chemi SEM, and the samples were coated with gold for SEM analysis. SEM micrographs were obtained at accelerating voltages ranging from 30 kV and magnifications of 600x and 5000x.
The thermal stability of the epoxy and blend, as well as its nanocomposites, was assessed using TGA analysis conducted in an Argon atmosphere. The SDT Q600 V20.9 Build 20 was utilized to test the temperatures between 25°C and 800°C. The temperature was elevated at a rate of 20°C/min, and a gas flow rate of 60 ml/min was kept during the analysis.
The Tg of the pure epoxy and EPR/PS blends, as well as their nanocomposites, was measured using a Mettler Toledo Star instrument. A temperature range of 25°C to 600°C was employed, with a heating rate of 20°C/min in a nitrogen atmosphere. The nitrogen flow rate was maintained at 50 ml/min.
Results and discussion
XRD analysis
The XRD pattern of EPR, PS, ATH NPs, and the EPR/PS blend filled with 1 and 5 wt.% ATH is shown in Figure 3. The existence of two diffraction peaks at around 19° (intensity of 3250 a.u.) and 38° (intensity of 350 a.u.), as shown in Figure 3(a), signifies the amorphous characteristics of the cured EPR matrix. In the pattern of PS, Figure 3(b), two distinct sharp peaks appear at about 29°, which have high intensity, and 38°. The peaks located at various 2θ angles (14.2°, 28.4°, 38.65°, 49.4°, 55.75°, 65.05°, and 72.6°) in Figure 3(c) indicate the existence of crystal planes in ATH nanoparticles. The peak intensity was sharp for pure ATH NPs, which decreased when the ATH NPs were dispersed into the EPR/PS blend matrix. Thus, making it less distinguishable due to the dispersion of crystalline all over. Many reports state that XRD can analyze NPs dispersed within a polymer matrix.29,40 X-ray diffraction pattern (a) EPR (b) PS (c) ATH NPs (d) EPR/PS - 1& 5 wt.% ATH.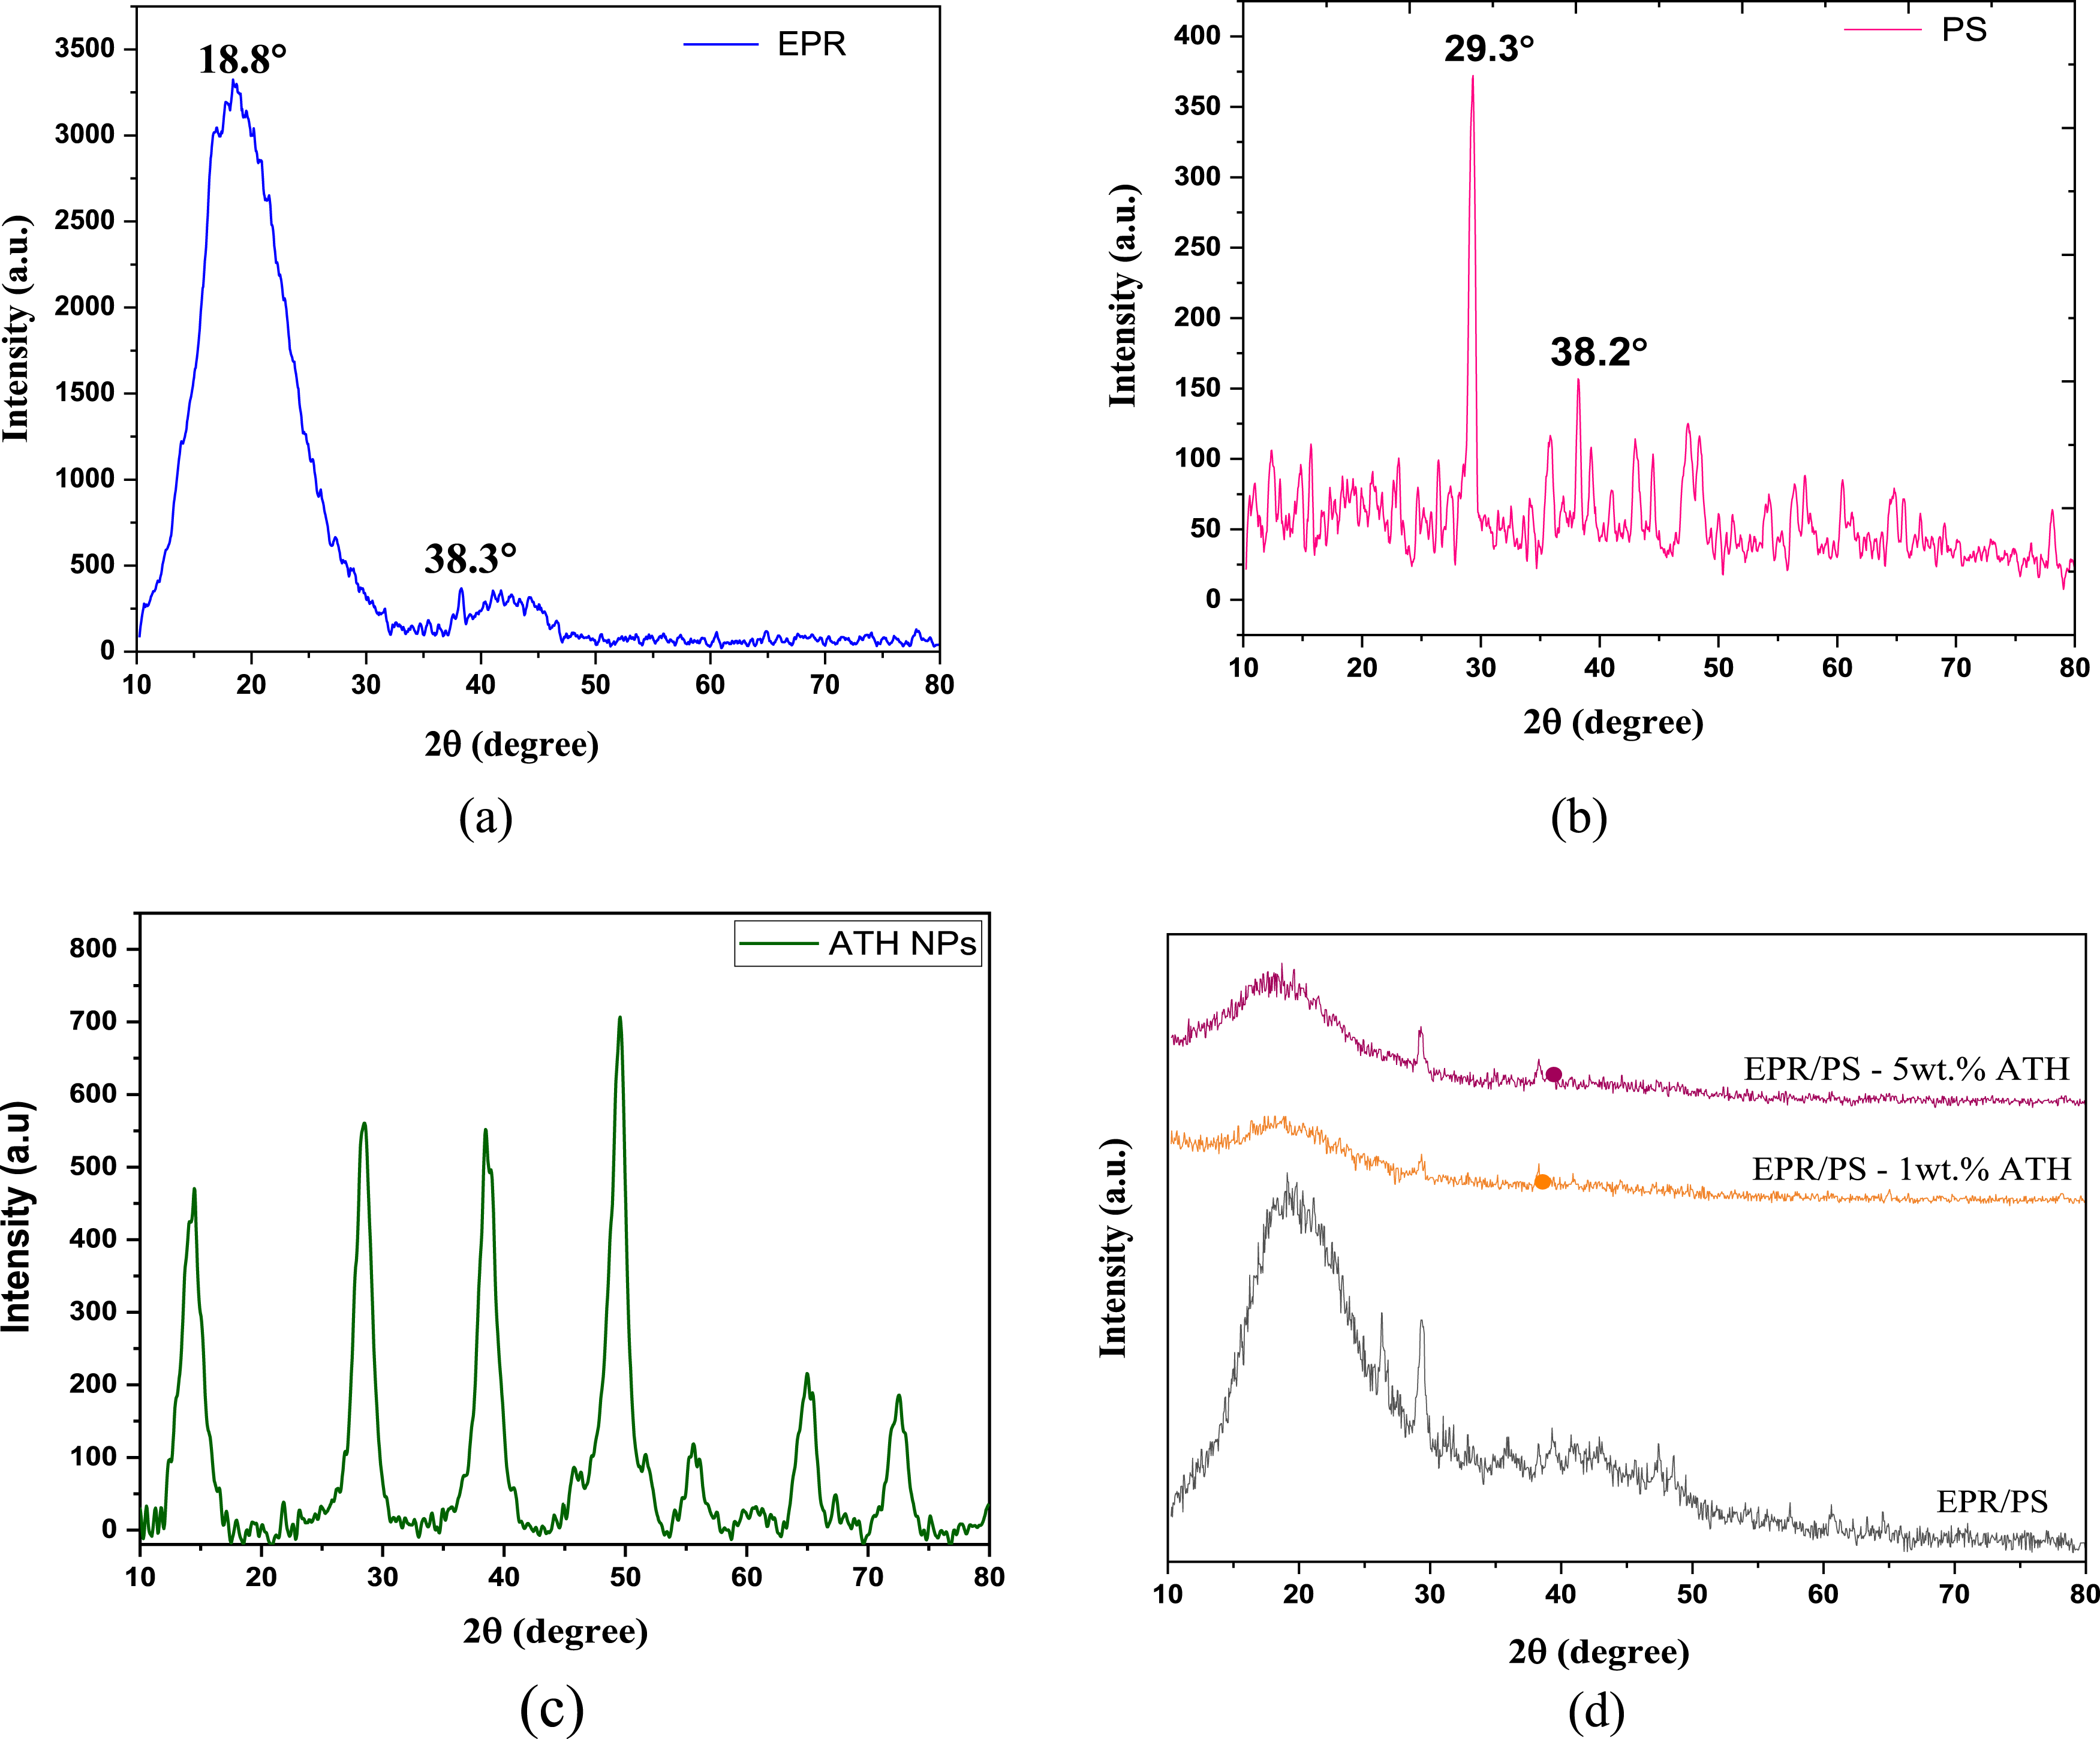
The XRD patterns for PBNCs filled with ATH NPs show that the major peaks of the EPR/PS blend nanocomposites are slightly shifted to the left, and the characteristic EPR peaks get wider and less intense (Figure 3(d)). This implies that ATH is intercalating between the PBNCs compound, which considerably influences the compound’s mechanical properties. Prior research has established that the attraction between surface groups of nanoparticles, driven by Coulombic and Van der Waals forces, is responsible for nanoparticle aggregation at elevated concentrations.41,42 Furthermore, research 43 has shown that the distribution and clustering of nanoparticles inside a polymer matrix significantly influence the mechanical properties of NCs, as explained in the upcoming sections.
Mechanical properties
Tensile test
Figure 4 displays the stress-strain curves of neat EPR and PBNCs with varying weight percentages of ATH NPs. It is obvious that filler-containing neat EPR and PBNCs provide better stretchability; besides, the area under the curve of the blends is greater than that of neat EPR and extremely increased with increased concentration of AHT NPs for both neat EPR and PBNCs. Stress-strain curves for epoxy resin and polymer blends nanocomposites.
Figure 5 demonstrates that the elongation at break for blends increases compared to the neat epoxy. The figure shows a gradual increase in elongation for both EPR NCs and PBNCs by loading different concentrations of ATH nanoparticles into the mixture. It can be noted that elongation at break increases steadily from 3.31 mm and 6.996 mm for pure EPR and blends to a maximum value of 17.392 mm and 13.654 mm, both at 5 wt. % of ATH NPs, respectively. The figure shows that adding ATH nanoparticles to the epoxy resin and polymer mixtures makes them more flexible. The higher limit of elongation demonstrates this fact. The improvement of elongation is essentially owed to a number of crucial factors that deal with the nanoscale fillers and the polymer matrix at the molecular level. Elongation at break versus ATH nanoparticles concentration for epoxy resin and polymer blends nanocomposites.
The toughness and ultimate tensile strength versus ATH content for the neat EPR and PBNCs are presented in Figure 6. Interestingly, the blend samples showed an improvement in the average toughness relative to the neat EPR, which is 206.83 x 10⁶ J/m3 and 251.96 x 10⁶ J/m3, respectively. The toughness of EPR NCs and PBNCs was observed to increase gradually with increasing NP content. At 1, 3, and 5 wt. % of ATH, the average toughness increased by 155.9 %, 171.48 %, and 206.5 % for EPR NCs and 20.82 %, 25.04 %, and 26.59 % for PBNCs, which may be due to the homogeneous stress distribution between the host EPR matrix and fillers. This enhancement may be due to the good dispersion of ATH in the composite. Toughness and ultimate tensile strength versus ATH nanoparticles concentration for epoxy resin and polymer blend nanocomposites.
The further increase in ATH NP content results in a rise in the system’s toughness. It noted that at 5 wt.% ATH NPs, a bit increasing of the toughness in the systems can be related to the unavoidable aggregation of nanoparticles, resulting in weaker interfacial adhesion between the nanoparticles and EPR, limiting the improvement of mechanical properties. The fracture toughness increases with increasing particle loading and eventually reaches a steady state. 44
From Figure 6, it is evident that the ultimate tensile strength of polymer blends drops to about half of that of pure EPR. It also showed that the ultimate tensile strength drops when ATH NPs are added. At 1 wt.% ATH NPs, the ultimate tensile strength reduces from 39.8 MPa to 25.9 MPa for EPR NCs and 20.51 MPa to 15.77 MPa for PBNCs.
Similar results observed in literature. For instance, it was reported a substantial reduction in tensile strength with the incorporation of micro-ATH by Sung et al. 35 The tensile strength of pure epoxy, measured at 30.3 and 36.2 MPa, decreases to 12.1 MPa and 11.4 MPa in a 60/40 epoxy/benzoxazine blend. No reinforcing effect is detected in either epoxy or epoxy/benzoxazine composites. They believed the diminished strength may be attributed to the incompatibility between the micro-ATH and resin. Also, Shah et al. 39 observed that the tensile strength of the polypropylene (PP)/ATH composite are decreasing with the increase of ATH. They believed that this decrease in the strength was due to the week intermolecular forces between PP and ATH. Conversely, they observed a slight increase in the composite’s elastic modulus as ATH increased.
Figure 7 presents the Young’s modulus of EPR and EPR/PS blends. The modulus reduced with the addition of ATH NPs. The average Young’s modulus of neat EPR was observed to be 1885.86 MPa and 1058.91 MPa for the EPR/PS blend. The values gradually decreased with the increase of ATH NPS concentration to the minimum of 1148.86 MPa and 503.29 MPa at 5 wt.% of ATH NPs. Young’s modulus versus ATH nanoparticles concentration for EPR and PBNC.
The diminished strength may be ascribed to the incompatibility between the EPR and ATH, 35 thereby lowering the bond strength at the interface. The introduction of nanoparticles can lead to improved dispersion within the polymer matrix, which can enhance toughness. ATH nanoparticles have been shown to improve the mechanical characteristics of polymer blends by stabilizing the domain structure and lowering stress concentrations. This makes the blends much tougher while lowering their tensile strength because the matrix is more flexible. This flexibility could then lead to increased toughness through greater energy absorption during deformation. As the material loses its rigidity, though, this can lead to a decrease in tensile strength. For instance, certain nanoparticles have been shown to enhance toughness, but the subsequent flexibilization of the matrix can lead to a reduction in tensile strength. Studies have indicated that while adding certain nanoparticles may enhance toughness, they can simultaneously reduce the tensile strength due to the resulting matrix flexibility23,45
Tensile results indicated that the addition of the ATH nanoparticles into the EPR and EPR/PS blend resulted in an enhancement of the tensile toughness and elongation at break; however, both the ultimate tensile strength and Young’s modulus decreased due to matrix flexibility.
Flexural test
The flexural stress–strain curves of the epoxy resin and polymer blend nanocomposites are depicted in Figure 8, which shows the flexural properties of pure epoxy and the EPR/PS blend as well as the influence of ATH NPs on the flexural properties of EPR and EPR/PS blend nanocomposites. It is found that the increased flexural strain of the EPR/PS blend, compared to pure EPR, is achieved at the expense of stress, leading to improved flexibility and ductility. The flexural stress and strain increased for EPR NCs that are higher than pure epoxy, whereas for the EPR/PS blend, stress increased at the expense of strain at 1 wt.% of ATH content, and the opposite occurred at 3 and 5 wt.% of ATH content. Flexural stress-strain curves for epoxy resin and polymer blends nanocomposites.
Figure 9 displays the flexural properties of EPR and EPR/PS blends and how the presence of nanoparticles affects the flexural properties of strength and modulus. The flexural strength of the EPR and EPR/PS blend is 62.22 MPa and 42.83 MPa, respectively, as shown in Figure 9(a). The values of flexural strength exceed those of the equivalent tensile strength. This difference between flexural and tensile strengths results from the nature of the tests performed. A tensile test only involves pulling the specimen, while a flexural test involves both pulling and pushing. Tension occurs in a sheet due to bending. Thus, the tensile side of a bending crack grows gradually, and the compressive side is less about crack growth and more about crack closure. This effect leads to increased ductility and flexural strength.
46
Flexural stress versus ATH nanoparticle concentration for epoxy resin and polymer blend nanocomposites.
Figure 9(a) shows that the flexural strength of EPR NCs increased with increasing nanoparticle content. The incorporation of ATH NPs significantly changes the flexural strength of EPR NCs due to the uniform dispersion of nanoparticles within the EPR matrix and the interaction between ATH and EPR. Similar results regarding flexural strength and modulus were reported for polyester/jute composites incorporating ATH and ZHO nanoparticles. 33 Flexural strength increased by 19.78% compared to pure EPR when 5 wt.% ATH NPs were added. The flexural strength of NPs-filled blend composites increased at a 1 wt.% content of ATH, which is 6.58% higher than that of the EPR/PS blend; thereafter, it began to decrease with increasing filler content. Figure 9(b) illustrates that the inclusion of ATH NPs improved the flexural modulus of the EPR (1756.73 MPa) and EPR/PS blend (1181.38 MPa). The maximum flexural modulus for EPR NCs is 2406.69 MPa at 5 wt.% of ATH content, and for the EPR/PS blend, it is 1259.1 MPa at 3 wt.% of ATH content, which is 36.69% and 6.59% higher than for the EPR and EPR/PS blends, respectively. The flexural properties (strength and modulus) of the EPR/PS blend were reduced at higher loadings of ATH NPs; this may be due to nanofiller agglomeration, and the formation of micro-voids might cause a decrease in stress transfer between the EPR/PS blend and the ATH nanofiller.
The addition of filler normally changes flexural properties, as confirmed by numerous researchers.46–48
Shore D hardness test
Hardness is regarded as a critical component influencing the abrasion resistance or indentation of any material. Increased hardness is considered as a favorable outcome. Figure 10 illustrates the hardness (Shore D) results of the EPR and EPR/PS blends, as well as their nanocomposites. It was observed that improving the hardness of the EPR NCs and reducing the EPR/PS blend NCs were due to the incorporation of ATH nanoparticles. Its value for EPR/PS blend is higher than that of pure epoxy and is approximately equivalent at an ATH content of 1 wt. %. Hardness results of EPR and EPR/PS blend with their nanocomposites.
The hardness of EPR NCs increases with increasing ATH NP content, which is in agreement with the reported result in,14,46 while the hardness of EPR/PS blend NCs decreases. Elevated hardness values indicate the materials’ ability to withstand localized surface deformation. The reduction in hardness may be due to the heterogeneous distribution of ATH nanoparticles or ascribed to agglomeration and the disruption of blended nanocomposites at elevated nanoparticle concentrations.
Mechanical properties of EPR, EPR/PS blend and their nanocomposites.

Morphology analysis
The relationship between the mechanical properties and the internal structures has been studied using SEM to observe the tensile fractured surfaces of pure EPR, EPR/PS blends, and both EPR and blends filled with 1 and 5 wt.% of ATH (Figure 11). SEM micrographs for (a) EPR, (b) EPR/PS, (c) EPR/PS - 1 wt.% ATH, (d) EPR/PS - 5 wt.% ATH, (e) EPR - 1 wt.% ATH, and (f) EPR - 5 wt.% ATH.
Figure 11(a) shows the surface morphology of the fracture surface of an epoxy sample. The image shows a breaking line along the surface fractography, indicating a brittle fractured surface, and a void is observed. Figure 11(b) illustrates the surface morphology of the fractured EPR/PS blend. It is revealed to have a moderately rough surface and a fracture with ridges. The epoxy matrix lacks voids or phase-separated rubber areas, which are often observed on the fractured surfaces of rubber-toughened epoxy materials.
Figure 11(c)–(f) demonstrates the dispersion of ATH NPs in the EPR NCs and PBNCs. From the micrographs, it can be seen that the crack evolution was disorganized, and the fracture surface became much rougher. Overall roughness, a tortuous crack path, and the absence of wide, flat facets indicate increased fracture energy relative to brittle epoxy. The numerous bright particles indicate a well-distributed nanofiller phase.
Atiqah et al. 49 observed, through SEM analysis of cross-sections, that the matrix surface of kenaf/polyester composites containing ATH (micro-sized) is rougher than that of unfilled ATH composites.
Figure 11(c) displays the fractured surfaces of the EPR/PS blend following the addition of 1 wt.% of ATH NPs. The left side indicates relatively smooth, river-like lamellae suggestive of shear deformation and localized plastic flow; the central-right region becomes much rougher in the case of a 5 wt.% ATH content blend; nanocomposites exhibit a significantly rough surface with cracks and some voids, as shown in Figure 11(d).
The broken surface of the nanocomposite exhibits significant yielding and plastic deformation compared to the unfilled counterpart. A similar phenomenon was also reported in previous research using epoxy-polysulfide-filled nanoclay. 29 The enhanced plastic deformation of nanocomposites is due to the role of ATH NPs in twisting cracks in the epoxy and polymer blend matrix.
The presence of ATH particles significantly roughens the fracture surfaces of EPR/PS blend nanocomposites. This evidence confirms that the deformation of the crack tip is influenced by ATH particles, making it difficult for crack propagation.
Figure 11(e) and (f) show the fractured surfaces of the EPR NCs, adding 1 and 5 wt.% of ATH NPs, respectively. Figure 11(e) shows that dispersion greatly improved and is a markedly rough, consistently dimpled surface with numerous small void ligaments, indicating an advanced stage of micro-damage and mainly ductile (energy-absorbing) failure rather than brittle cleavage.
The increase in ductility of the nanocomposite with the addition of nanoparticles has been attributed to the formation of a flexible interface between the ATH NPs and the EPR and EPR/PS blends. The formation of a flexible interface is mainly ascribed to the plasticization effect of the intercalating ATH NPs in the EPR and EPR/PS blend matrix.
Figure 11(f) possessed cracks and some voids with small agglomerations of ATH NPs. Moreover, higher concentrations of ATH NPs in both the EPR NCs and PBNCs resulted in agglomeration of nanoparticles, as shown in Figure 11(d) and (f). A prior study indicated that an increase in the incorporation of nanoparticles inside the polymer matrix correlates with a rise in cluster formation. 33 ATH nanoparticles are embedded within the matrix, most appearing well anchored without obvious debonding gaps, which suggests reasonably good interfacial adhesion. There are no large agglomerates, implying relatively uniform dispersion.
Thermal properties
Thermogravimetric analysis
The influence of ATH nanoparticles on the thermal stability of the epoxy and epoxy/polysulfide blend was investigated by TGA analysis. Figures 12 and 13 show TGA and DTG curves for pure EPR, blends, and their nanocomposites. It can be seen that all of the samples exhibit a one-step weight loss process, and major weight loss occurs around the temperature range of 300 - 400°C. TGA for EPR and blend incorporated 1 wt.% and 5 wt.% of ATH nanoparticles. DTG for EPR and blend incorporated 1 wt.% and 5 wt.% of ATH nanoparticles.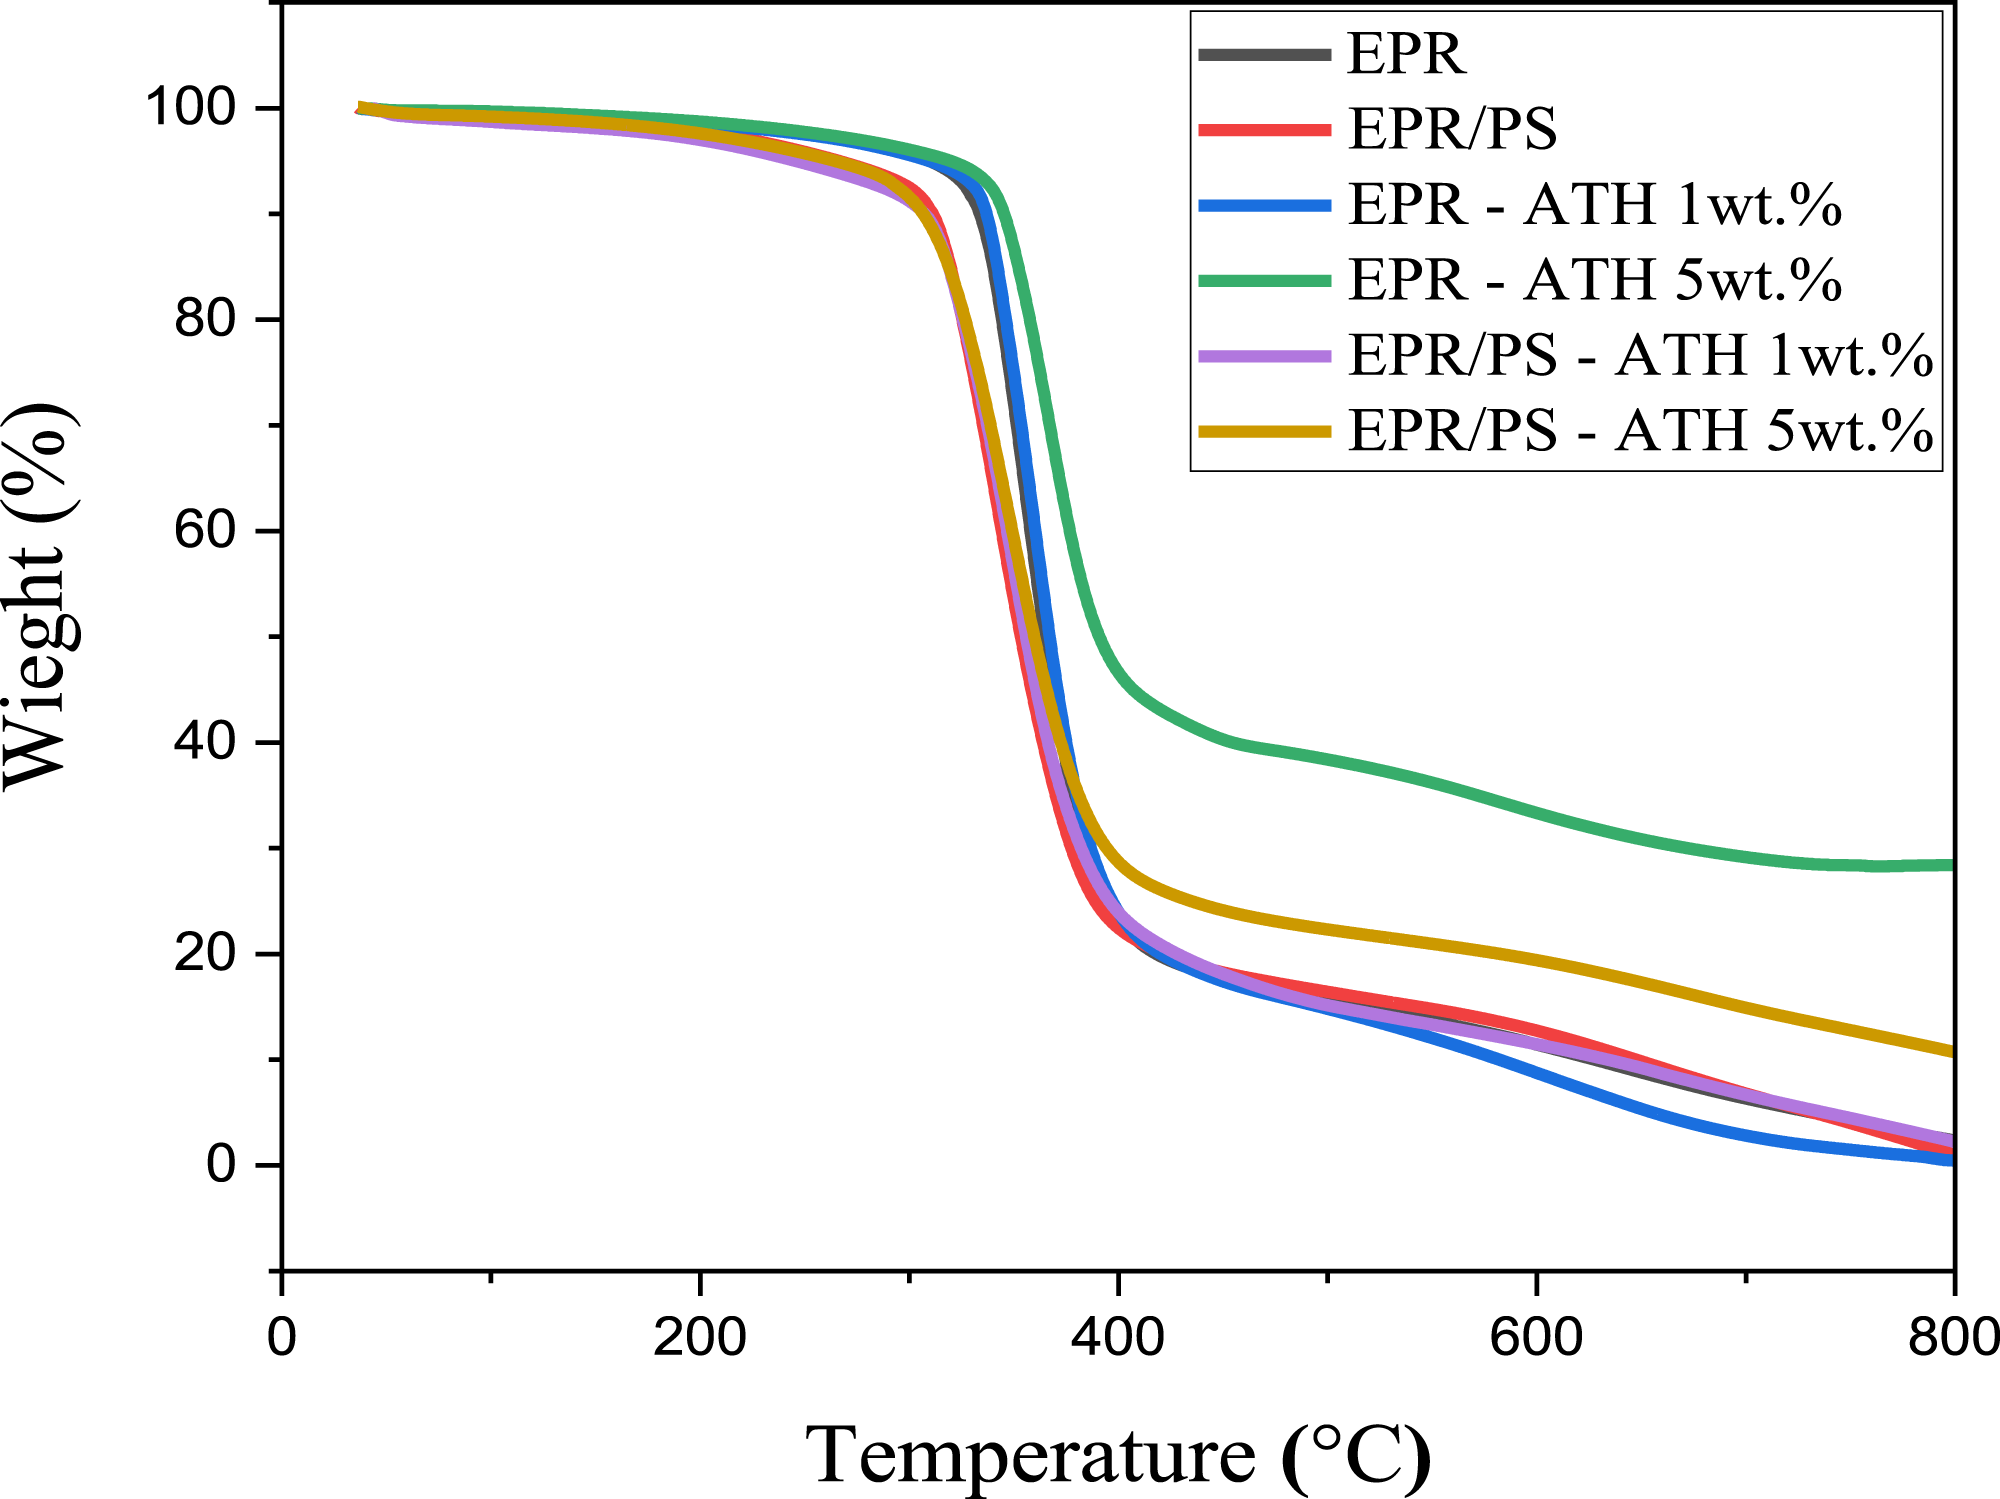
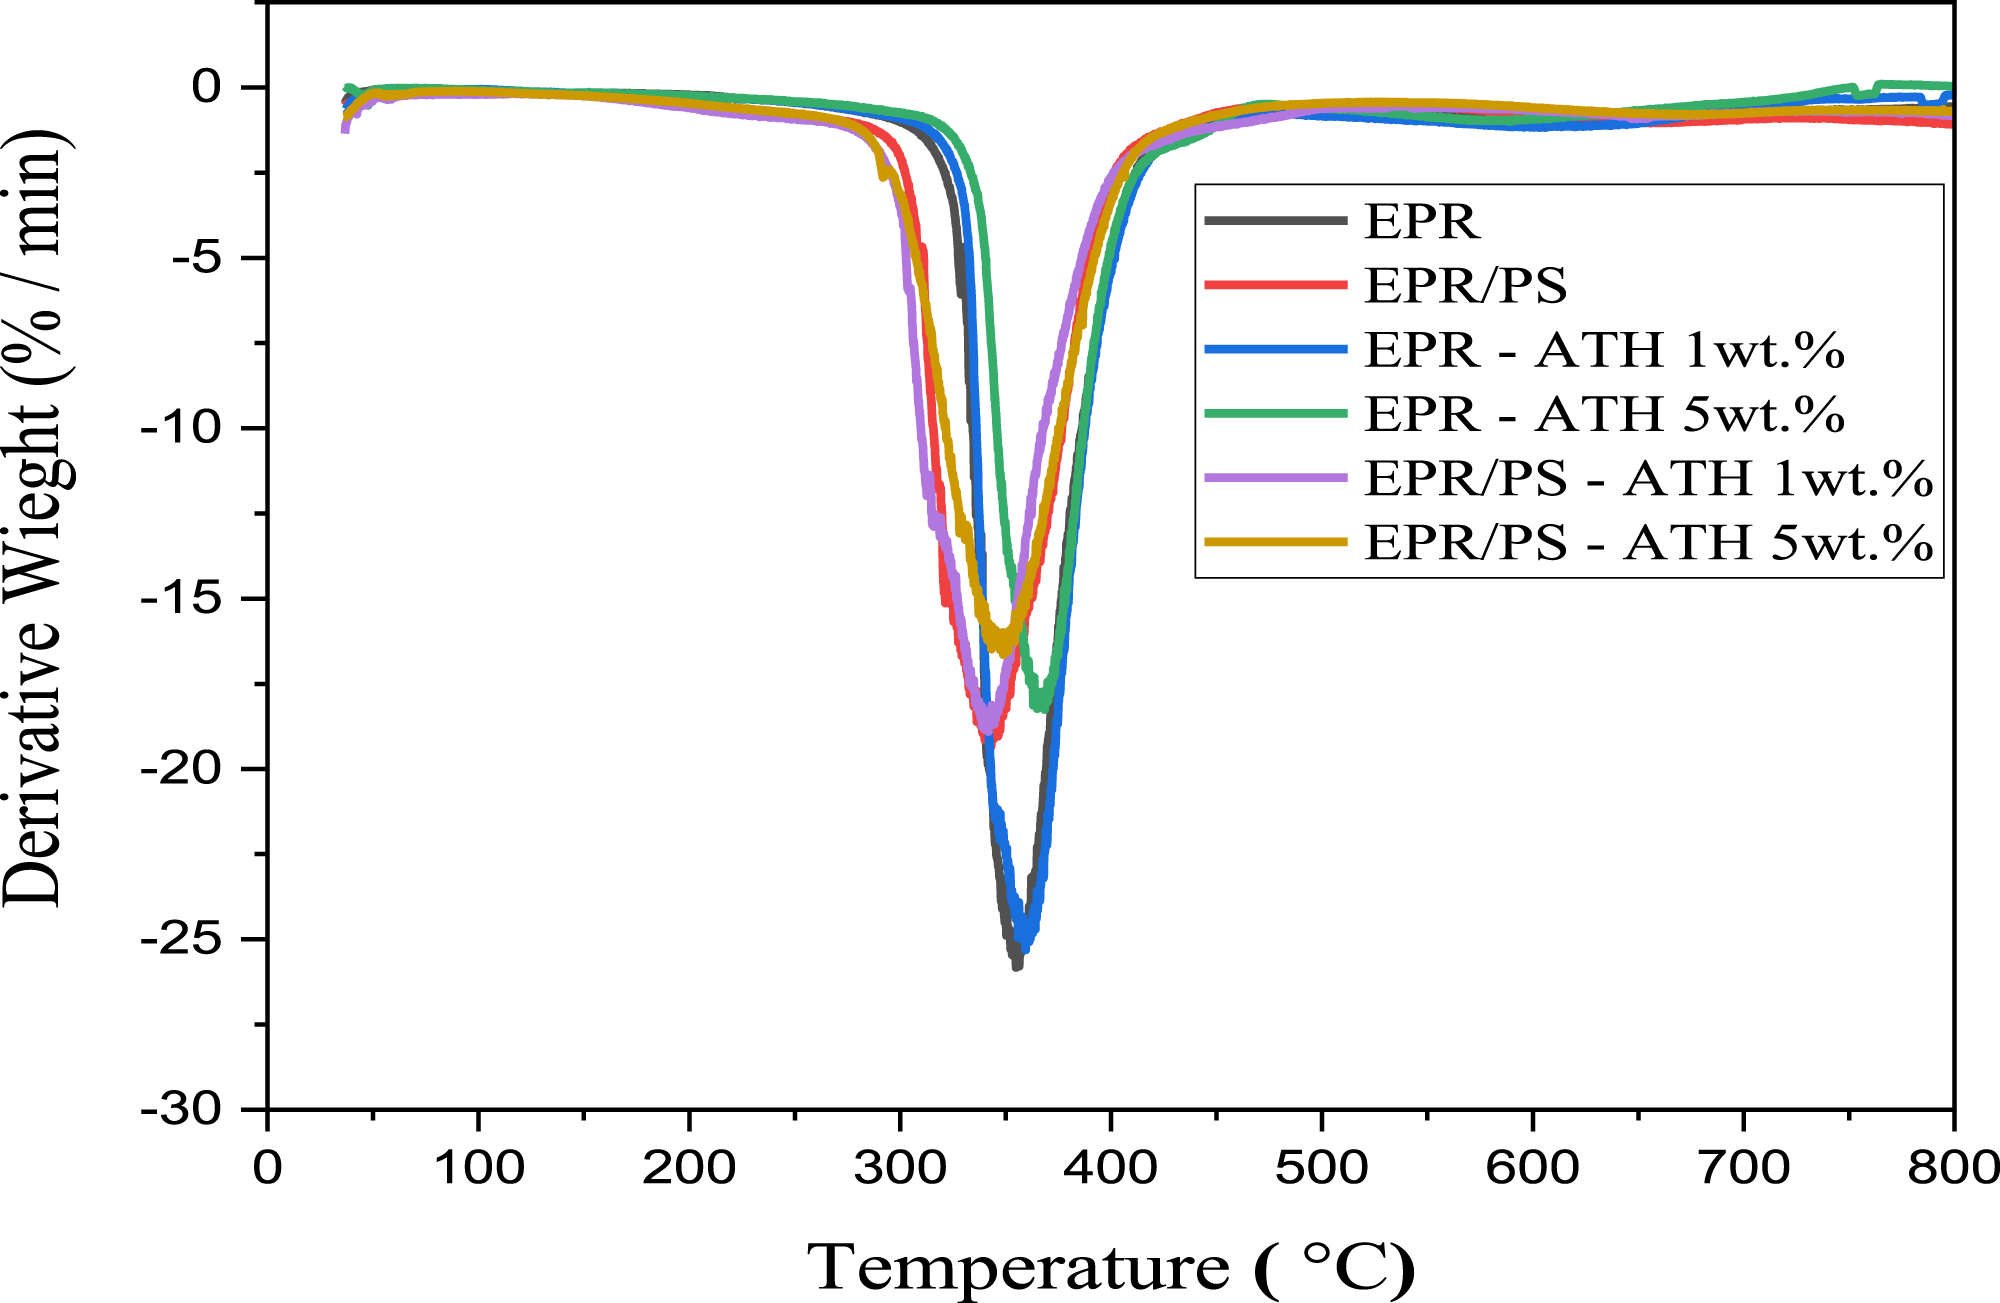
In EPR PNCs, decomposition is reduced due to the interaction at the interface between nanoparticles and the polymer matrix 50 ; hence, the thermal stability of the PNCs is enhanced with the addition of dopants at elevated temperatures. The presence of the ATH NPs improved the thermal stability of the epoxy and blend nanocomposites at a higher temperature range compared to pure epoxy, as seen in Figure 12.
The peaks in the DTG curve (Figure 13) correspond to the nanocomposite’s maximum decomposition temperatures (Tmax), which is the temperature where the maximum degradation rate occurs for the main degradation step.
Decomposition temperature and residue at 800°C of EPR and EPR/PS blend containing different wt.%.

The results showed that the addition of ATH NPs into epoxy resin increased the onset temperature, while it decreased for the blend. The onset temperature of the EPR NCs increases with the increase in the ATH NPs concentration. The Tonset values at 1 wt.% and 5 wt.% are 122.17°C and 132.46°C, respectively. The table clearly indicates that the thermal degradation temperatures for 30% weight loss (Td 30%) and 50% weight loss (Td 50%) of EPR PNC samples exceed those of pure EPR. The maximum degradation temperatures, Td 30% and Td 50%, were found to be 367.02°C and 390.72°C, respectively, for EPR incorporated with 5 wt.% NPs compared with the pure EPR; the Td 30 % and Td 50 % of EPR PNC increased by 15.71°C and 26.01°C, respectively. Additionally, the maximum decomposition temperature (Tmax) of EPR that incorporated 5 wt.% ATH NPs increased from 354.96°C to 368.51°C, which represents a rise of 13.55°C compared to pure EPR. This reveals that the inclusion of nanofillers can improve the thermal stability of cured networks. Reports indicate that the presence of nanofillers serves as a mass-transfer barrier, impeding the mobility of polymers, which is essential for delaying polymer degradation. 51
The Tmax of EPR has increased following the incorporation of NPs. This increase is attributed to the endothermic decomposition of ATH (Al2O3·3H2O) nanoparticles, which absorb energy and simultaneously release water vapor. The decomposition temperature of ATH is 310°C. Upon heating ATH within the temperature range of 300-400°C, it decomposes into water vapor, and a layer of oxide forms over the surface of the composite material, acting as insulation. This insulation limits both heat and mass transport, resulting in an enhanced thermal stability. 33 This reveals that the incorporation of ATH NPs enhances the thermal stability of EPR and blend nanocomposites. Kolar et al. 38 reported a similar result. In addition, the char formation of EPR NCs and PBNCs was also found to be higher compared to pure epoxy. As seen from the table, the highest char residue was recorded for both EPR NCs and blend NCs at 5 wt.% of ATH NPs, which are 28.4% and 10.69%, respectively, as compared to pure EPR (2.33%). This phenomenon demonstrates that the thermal stability of EPR and blend nanocomposites is enhanced at 5 wt.% of ATH NPs.
Differential scanning calorimetry analysis
Figure 14 illustrates the variation in Tg for both pure EPR and the EPR/PS blend, as well as their nanocomposites. The midpoint temperature is denoted as the glass transition temperature. The Tg of pure EPR is 69°C, while that of the EPR/PS blend is 64.4°C, indicating a drop in Tg for the EPR/PS blend compared to pure EPR. This reduction in Tg is due to the mobile polysulfide chains acting as internal plasticizers, which increase free volume and reduce crosslink density and diminishing the overall stiffness of the matrix.52,53 DSC thermograms showing the glass transition temperatures of EPR, blend and their nanocomposites.
Researchers examined the impact of various nanofillers on the Tg of epoxy resins. The glass transition temperature relative to the unfilled resin can increase, decrease, or remain unchanged, depending on the type and amount of filler loading and the surface properties of the filler.12,37,54–56 The most influential factors in the glass transition temperature of nanocomposites were the segmental mobility of the matrix chains, the organic interphase, surface moisture on the filler, and changes in crosslinking density in its vicinity. In a study by Kozako et al. 37 conducted on epoxy/boehmite alumina nanocomposites, the results indicate that Tg is almost unchanged after the addition of different wt.% of the nanofillers, with a small decrease observed at 7 wt.% concentration. They mentioned that it might be related to the quantity of nanofiller attached to the surrounding polymer matrix in the zone of interaction, either increasing or decreasing.
It was observed that the Tg value increased in correlation with the quantity of nanoparticles. The researchers believed that the potential causes of this rise are related to the presence of CNT and Al2O3 nanoparticles, which decrease mobility by narrowing the distance between macromolecules, increasing cross-link density, and enhancing the rigidity of the polymeric segments. 12
The Tg shifts to lower values with the incorporation of ATH nanoparticles into the EPR and EPR/PS blend. The results show a slight decrease in Tg, which may be due to ATH NPs introducing extra free volume and increasing segment mobility at the matrix-filler interface.56–58 It demonstrated that silica particles resulted in a notable reduction in the nanocomposites relative to the unfilled epoxy, attributing this to residual organics and bonded water facilitating molecular motions and generating additional free volume at the resin-filler interface as in. 56 Consequently, it is expected that changes in glass transition temperatures are affected by the interaction between nanoparticles and epoxy. It has also been reported that humidity significantly affects the Tg of nanocomposites, and the presence of a water nanolayer on the nanoparticles’ surface can decrease the Tg values as in. 59
An increase in moisture content results in the establishment of hydrogen bonds with polymeric chains, increasing the distance between them. Hence, it increases the free volume and reduces the glass transition temperature. Researchers reported a similar result for various EPR-based PNCs as in, 60 which showed that the glass transition temperature was reduced for epoxy matrix/halloysite nanotubes (HNT) nanocomposite at different concentrations of HNT compared to pure epoxy due to a nanoparticle-related decrease in the crosslinking density. Also, in, 55 it was found that adding 2 wt% of Fe2O3 and ZnO to the epoxy matrix slightly decreased the Tg values due to a plasticizing effect. However, Tg was raised by the addition of 2 wt% of SiO2 and ZrO2 NPs, respectively. They believed this increase in Tg can be ascribed to strong interactions between the NPs and the epoxy matrix, which restrict the mobility of the epoxy chains.
Conclusions
In the current research, the mechanical and thermal properties of the epoxy/polysulfide blend, epoxy nanocomposites, and polymer blend nanocomposites have been investigated. Multiple sets of pure EPR, EPR/PS, and blends with 1, 3, and 5 wt.% of ATH NPs were prepared. The ultrasonic processor allowed the nanoparticles to be evenly distributed in the blends and epoxy resin. This significantly improved the mechanical properties of the composites, including their toughness and elongation at break. Based on the results, it can be concluded that: 1. Blending PS with EPR enhances toughness, elongation at break, and surface hardness, while the ultimate tensile strength, flexural strength, modulus of elasticity, and flexural modulus are decreased. The highest toughness for PBNCs and EPR NCs was recorded at 5 wt.% of ATH NPs. 2. The maximum value for flexural strength and flexural modulus for EPR NCs was recorded at 3 wt.% and 5 wt.% of ATH NPs, while for PBNCs, flexural strength was at 1 wt.% and flexural modulus at 3 wt.% of ATH NPs. 3. Both ultimate tensile strength and Young’s modulus were reduced for the blend and gradually decreased with increasing NPs concentrations for both epoxy and blend. 4. The XRD pattern showed the degree of crystallinity of pure EPR, PS, and ATH NPs, as well as a positive interaction between them in the EPR/PS blend and PBNCs. 5. The surface morphology demonstrated that the EPR/PS blend exhibits a singular surface, with the ATH nanoparticles uniformly distributed within both the EPR NCs and PBNCs. 6. The analysis of TGA-DTG data reveals that the improved thermal stability of EPR NCs and PBNCs is in contradiction to that of the EPR/PS blend. The Tg value obtained from the DSC curve was reduced for the EPR/PS blend and was a bit lower than that of pure epoxy for the nanocomposites.
Footnotes
Funding
The authors received no financial support for the research, authorship, and/or publication of this article.
Declaration of conflicting interests
The authors declared no potential conflicts of interest with respect to the research, authorship, and/or publication of this article.
Data Availability Statement
The authors declare that all data supporting the findings of this study are included in the article.