
Abstract
This study examines how flow velocity affects the current response due to erosion damage in a nanocomposite of polyurethane, carbon nanotube (CNT), and reduced graphene oxide (rGO). Increased nano-filler contents improved electrical conductivity, transitioning the polyurethane from an insulator to a conductor. For the polyurethane nanocomposite with the electrical conductivity of around 10-5 S/m, erosion tests in a NaCl solution with the applied voltage of 10 VSCE were carried out and showed that the current slope, rather than the absolute current value, closely correlated with the flow velocity. An ensemble model using current slope data, including support vector regression (SVR), achieved high prediction accuracy with R2 values around 0.93 for both increasing and decreasing velocities.
Introduction
In recent years, there has been a concerted global effort by governments and energy companies to significantly increase the integration of wind power into their energy portfolios. This push towards wind energy expansion has been propelled by ambitious targets and facilitated by remarkable strides in technology and engineering. Notably, advancements have led to the development of larger, more robust wind turbines capable of harnessing greater amounts of electricity from the same wind resources. These modern turbines boast innovations such as elongated blades, towering structures, and enhanced generators, empowering them to expedite progress towards energy targets while simultaneously improving cost-effectiveness. 1
The scalability of wind turbine technology has been a key driver in its growing competitiveness within the energy sector. As turbines increase in size, the cost per unit of energy produced diminishes, positioning wind power as a compelling alternative to traditional energy sources. 2 However, this scaling up is not without challenges. Longer turbine blades, in particular, are exposed to a larger volume of air and a myriad of environmental elements including rain, sand, and salt.3‒5 This heightened exposure renders the blades more susceptible to erosion damage, which can compromise their aerodynamic efficiency and consequently reduce electricity generation.6,7 To mitigate this risk, wind turbine blades are often coated with protective layers such as polyurethane designed to withstand environmental stresses and minimize wear and tear.8,9
The critical role of collision energy or flow rate at the blade tip of wind turbines emerges as a focal point in assessing potential erosion damage over time. 10 Erosion occurs when turbine blade surfaces degrade due to environmental factors encountered during operation including wind-driven particulates and precipitation. 11 Elevated collision energies at the blade tip correlate with increased erosion damage, underscoring the importance of accurately predicting and managing these dynamics. By forecasting collision energies, engineers and maintenance personnel can proactively plan inspection and maintenance schedules to forestall erosion-related issues. This proactive approach may involve regular inspections to detect and remedy damage before it escalates.
Polyurethane nanocomposites reinforced with CNTs have emerged as versatile sensing platforms because the high-aspect-ratio CNTs establish a robust, three-dimensional percolation network inside the insulating polymer, enabling outside forces to be turned into electrical signals.12–16 When the PU is stretched or compressed, the gaps and contacts between CNTs change, which changes the network’s resistance through both path re-organization and quantum tunnelling; this piezoresistive effect is the basis of CNT strain gauges. Georgousis et al. showed this by mixing 0.5–8 wt % multi-walled CNTs into a PVDF matrix, where stretching produced repeatable resistance changes caused by CNT–CNT contact and tunnelling. 13 Additionally, Kanoun et al. reviewed CNT/elastomer systems—such as TPU, PDMS and Ecoflex—and found these polymers can stretch over 100 % while keeping a stable conductive network even at low CNT levels, giving flexible or textile-based sensors with high gauge factors for wearable devices and soft-robotic skins. 14 Taken together, these studies underline the basic science and practical importance of CNT-reinforced PU (and similar polymer) nanocomposites for sensitive, flexible strain sensing.
The utilization of polyurethane nanocomposites in wind turbine blade coatings represents an active area of research and development. Scientists are exploring diverse nanocomposite formulations and processing methods to optimize their properties for use in blade coatings.17‒21 While studies have shown promising results in enhancing impact resistance and reducing maintenance costs, the application of these materials in predicting collision energy during turbine operation remains relatively unexplored. The ability to detect collision energy in real-time could empower turbine operators to swiftly identify and address blade damage, thereby minimizing downtime and repair expenses while enhancing overall turbine performance and efficiency. Moreover, longitudinal monitoring of collision energy levels could unveil trends and patterns, enabling the formulation of proactive risk mitigation strategies.
This work introduces a novel sensing paradigm: polyurethane/CNT/rGO nanocomposites are used to predict fluid flow velocity via the electrochemical current slope measured under potentiostatic jet-impingement conditions. Unlike traditional resistive sensors, this method captures time-dependent changes in surface-erosion dynamics, enabling indirect yet quantifiable assessment of flow velocity. To the best of our knowledge, this is the first demonstration of polyurethane-based nanocomposites applied to flow-velocity prediction using electrochemical current response as the sensing metric. In light of these considerations, this study investigates the potential of polyurethane nanocomposites to predict collision energy in wind turbine blade applications, offering insights into their viability for enhancing turbine performance and longevity.
Materials and methods
Materials
Characteristics of CNT/rGO hybrid slurry used for polyurethane nanocomposite production.

Preparation of polyurethane nanocomposite
Processing parameters for the polyurethane nanocomposite preparation.

Jet impingement test
The experimental setup for conducting jet impingement tests is depicted schematically in Figure 1, while Table 3 provides a summary of the key parameters involved in these tests. A conventional three-electrode system was employed for these experiments, comprising the polyurethane nanocomposite as the working electrode, a graphite rod as the counter electrode, and a saturated calomel electrode (SCE) as the reference electrode. To ensure reliable electrical contact between the polyurethane specimen and the potentiostat, a Cu rod was used as a current collector in the testing cell. The Cu rod was designed in a screw shape to securely fix the polyurethane specimen in place. To simulate erosion conditions, sand particles with diameters ranging from 200 to 400 μm were introduced into a 3.5% NaCl solution, constituting 10 wt% of the solution (Figure 2). Schematic diagram of the jet impingement apparatus for erosion tests. Jet impingement test parameters using three electrode system. Sand particles used in the jet impingement tests.
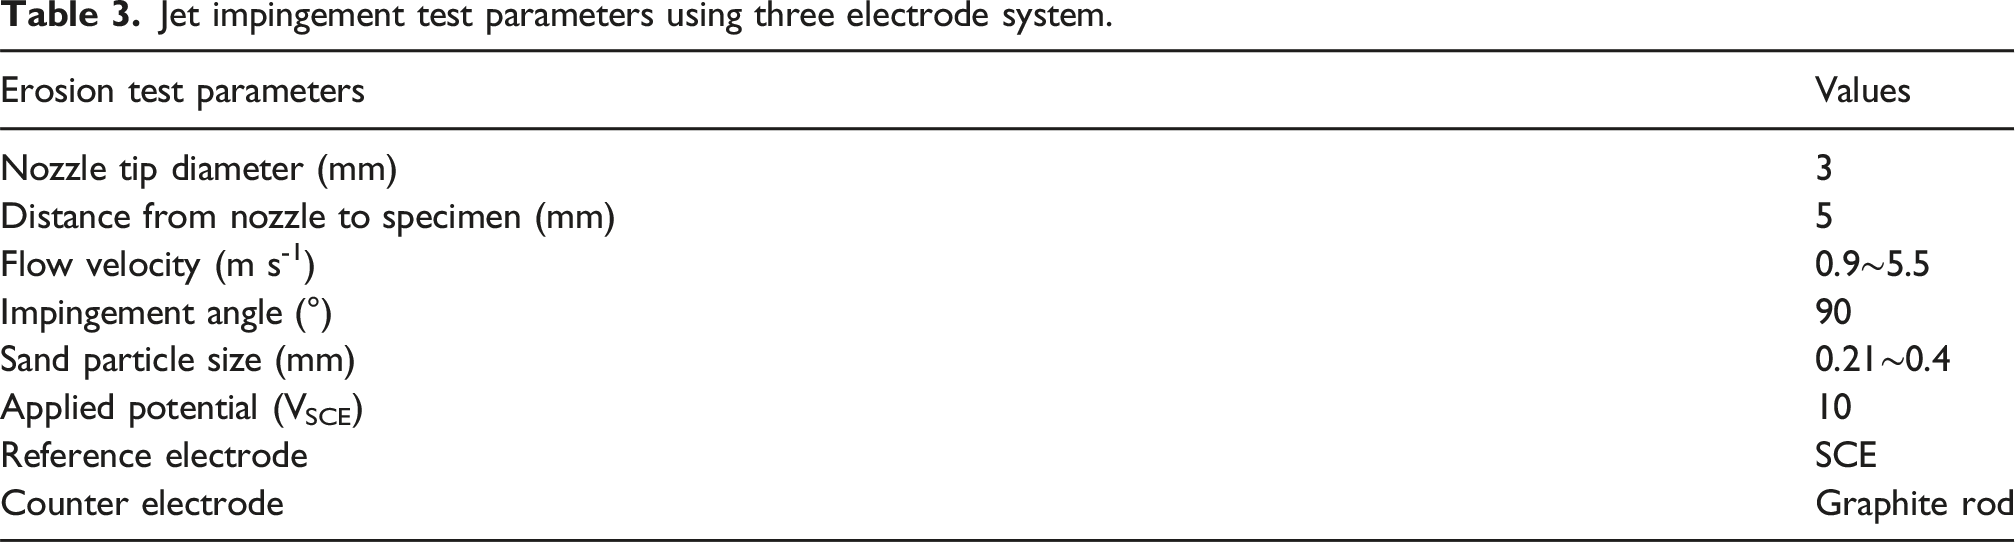

During the jet impingement tests, the sand-laden solution was sprayed directly onto the surface of the working electrode using a nozzle with a diameter of 3 mm. The distance between the nozzle tip and the sample surface was maintained at 5 mm. To ensure consistent fluid velocity and prevent air injection, a pump dampener was incorporated into the experimental setup. The temperature of the solution was controlled and maintained at room temperature throughout the duration of the tests. The fluid velocity was incrementally increased during testing, with velocity increments ranging from 1000 to 2000 s, ultimately reaching a maximum velocity of 5.5 m/s. Current measurements were conducted under potentiostatic conditions at 10 VSCE. Following the attainment of the maximum flow velocity, the velocity was gradually decreased, and current readings were recorded during this phase as well. Post-test analysis included the measurement of the maximum depth of erosive wear damage using a pit gauge. Additionally, the surfaces of the electrodes were examined using FE-SEM to assess the extent of erosion and wear. To ensure the reliability and reproducibility of the results, all corrosion tests were repeated at least twice.
Results and discussion
Preparation of polyurethane nanocomposite and its electrical conductivity
As shown in Figure 4, a nanocomposite material was synthesized by dispersing nano-fillers, namely CNT (Figure 3a) and rGO (Figure 3b), into a polyurethane matrix using a commercial CNT/rGO hybrid liquid with an organic base. This process effectively facilitated the dispersion of the nano-fillers within the polyurethane matrix, preventing the formation of agglomerates and ensuring their homogeneous distribution. The rationale for simultaneously employing both CNT and rGO lies in their distinct yet complementary structural and electrical characteristics. CNTs, owing to their one-dimensional tubular structure and high aspect ratio, serve as primary conductive pathways within the polymer matrix. In contrast, rGO offers a two-dimensional sheet-like structure with abundant oxygen-containing functional groups, which not only enhance inter-tube connectivity but also improve dispersion by mitigating CNT agglomeration and rGO restacking. The interaction mechanism underlying this hybrid system is based on π–π stacking and van der Waals interactions between CNTs and rGO, forming a robust percolation network.
22
Additionally, polar functional groups on the surface of rGO facilitate interfacial compatibility with the polyurethane matrix via hydrogen bonding and dipole–dipole interactions.
22
These combined effects result in improved electron transport, better network stability, and enhanced sensing performance. This synergistic behavior has been widely reported in prior literature on polymer nanocomposites, and similar observations have been cited in recent studies employing CNT–rGO hybrids for strain and pressure sensing applications.23–26 FE-SEM images of the (a) CNT and (b) rGO nano-fillers used in this study.
The dispersion of nano-fillers was achieved through a high shear mixing process, which can create a percolated network within the matrix particularly at low filler content levels (<1.5 wt%) investigated in this study. This percolated network structure was confirmed through electric conductivity measurements, which will be discussed in detail later.
The incorporation of nano-fillers significantly increased the number of interaction sites or interfaces between the nano-fillers and the polyurethane matrix in the nanocomposite consequently influencing its properties. Notably, the viscosity of the nanocomposite increased with the addition of nano-fillers. However, despite this increase, the nanocomposite remained manageable and easy to handle even at the maximum tested nano-filler content of 1.5 wt%. This was attributed to the relatively modest rise in viscosity observed with the addition of nano-fillers. During the shear mixing process of the nanocomposite, the slight increase in viscosity led to the growth of bubbles. These bubbles, if retained, could adversely affect the mechanical and electrical properties of the nanocomposite. Therefore, measures were taken to minimize the presence of residual bubbles during the coagulation process. By effectively removing these bubbles during coagulation, mechanical and electrical properties of the nanocomposites were preserved and optimized for subsequent characterization and testing.
As shown in Figure 4, a notable change in color was observed in the nanocomposite materials compared to pure polyurethane, transitioning from an initial pale gray hue to a darker gray shade with increasing nano-filler concentration. This visual alteration in color is indicative of the incorporation of nano-fillers into the polyurethane matrix. In our routine handling of the materials, it was noted that the nanocomposites exhibited increased rigidity compared to pure polyurethane. Despite this enhancement in rigidity, the composites retained a degree of flexibility, consistent with previous findings indicating that CNT/rGO/polyurethane composites possess superior mechanical properties compared to pure polyurethane.28‒30 This observation underscores the reinforcing effect of nano-fillers on the mechanical strength of the nanocomposite materials. However, it is noteworthy that an increase in nano-filler concentration up to 1.5 wt% resulted in a notable increase in contraction of the nanocomposite after full coagulation in air. This phenomenon may be attributed to the higher amount of organic solvent required for dispersing 1.5 wt% nano-fillers probably leading to premature bonding failure between the composite and the substrate. This contraction behavior highlights the intricate interaction between nano-filler content, solvent concentration, and composite properties, necessitating careful consideration during the formulation and processing of CNT/rGO/polyurethane nanocomposites. Photograph of the polyurethane nanocomposites with the different nano-filler contents. Nano-filler content of 0 wt% represents the pure polyurethane.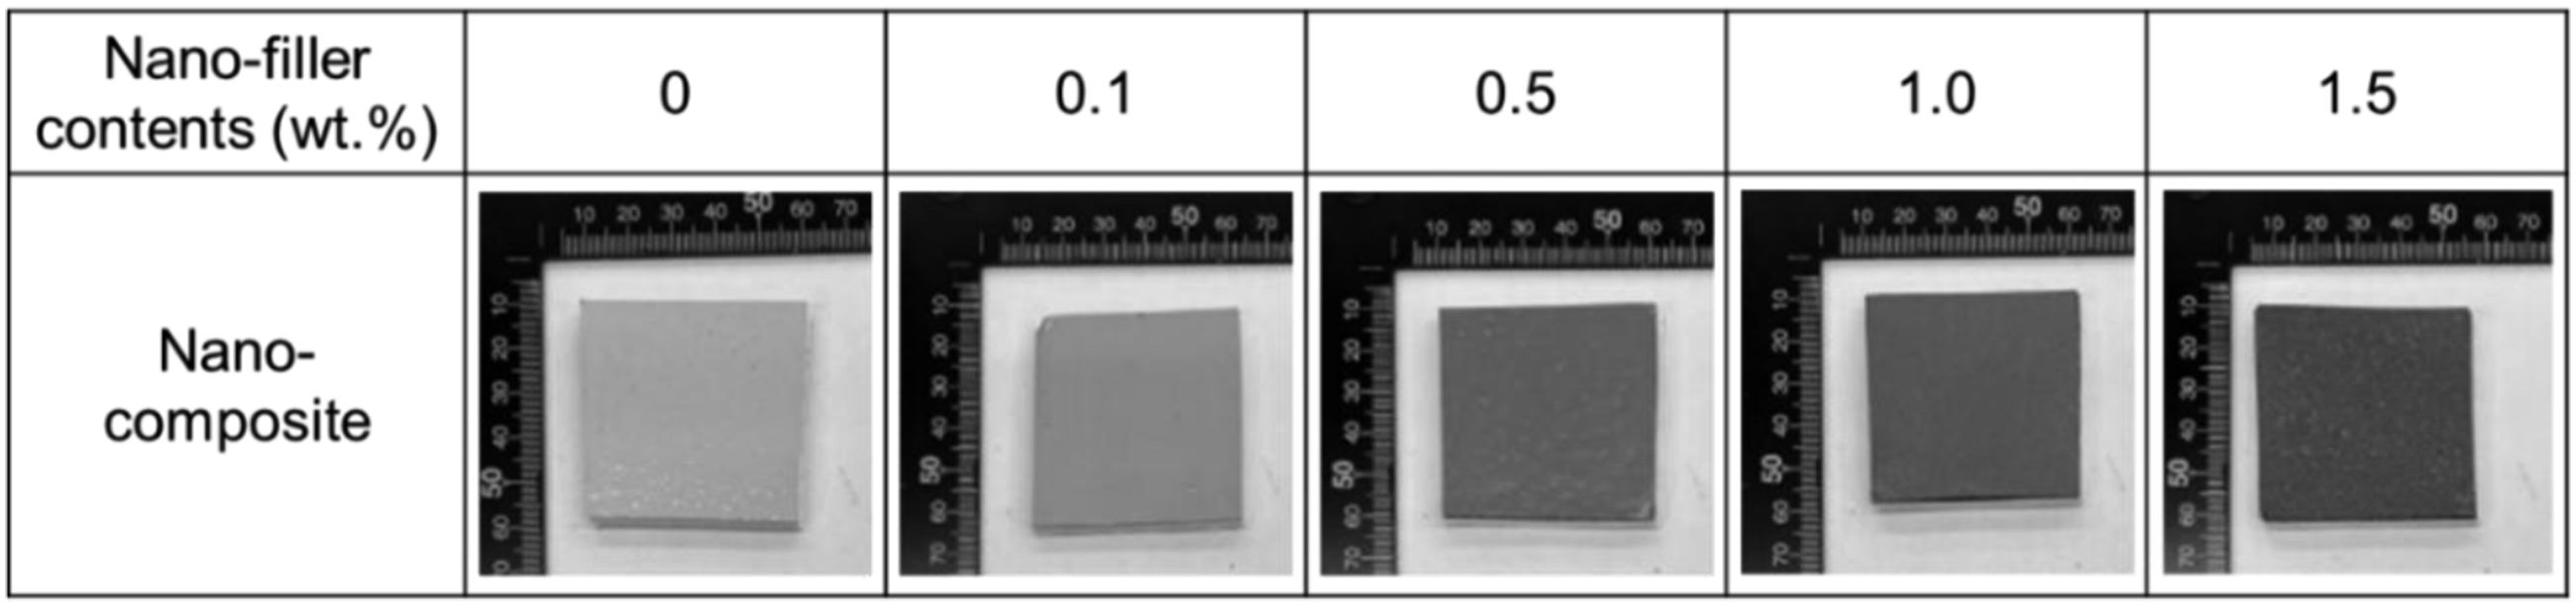
As shown in Figure 5, the relationship between the electric conductivity of the nanocomposites and the nano-filler contents was investigated. Initially, it is crucial to note that polyurethane is inherently an insulating material, typically exhibiting a low conductivity in the range of 10-12 S m-1, which corresponds to the lowest measurable capability of standard multimeters. However, the polyurethane utilized in this study displayed a conductivity approximately in the range of 10-8 S m-1 even in the absence of nano-fillers. This unexpected conductivity level can be attributed to the presence of unknown nano-powders originally incorporated into the polyurethane formulation to enhance rain erosion resistance during operational conditions at wind turbine sites. Since this matter pertains to company patents, it is crucial to maintain confidentiality and not disclose any related information in this context. Upon the addition of nano-fillers, a significant enhancement in conductivity was observed. At a nano-filler content of 0.1 wt%, there was an order of magnitude increase in conductivity compared to pure polyurethane, reaching around 0.15 × 10⁻⁶ S m-1. This notable increase indicates the initiation of interconnection between the CNT and rGO nano-fillers within the polyurethane matrix, establishing a continuous network of pathways for current flow.
27
Further increasing the nano-filler content beyond 0.1 wt% led to a more substantial increase in conductivity, reaching approximately 8.99×10⁻⁶ S m-1 at 1 wt% nano-filler content. The most significant augmentation in conductivity was observed at 0.5 wt% nano-filler content (around 2.27×10⁻⁶ S m-1), with a tendency for diminishing returns at higher nano-filler concentrations. This behavior is characteristic of an insulator-to-conductor transition attributed to the formation of an infinite cluster of interconnected nano-fillers. Notably, the critical concentration where this transition occurs was identified to be around 0.5 wt% nano-filler content in the polyurethane used in this study. Prior research by Yan et al. reported a similar insulator-to-conductor percolation threshold for CNT nano-fillers occurring at approximately 1.2 wt% due to a drastic increase in conductivity from around 10-12 to 10-6 S m-1.
31
For the erosion tests conducted in this study, the polyurethane nanocomposite containing 1 wt% nano-fillers with a conductivity of 8.99×10⁻⁶ S m-1 was selected for evaluation which may underscoring its suitability for the intended application. Certified Electrical conductivity of the polyurethane nanocomposites as a function of nano-filler content. Mean and standard deviation (scatter band) are from five measurements.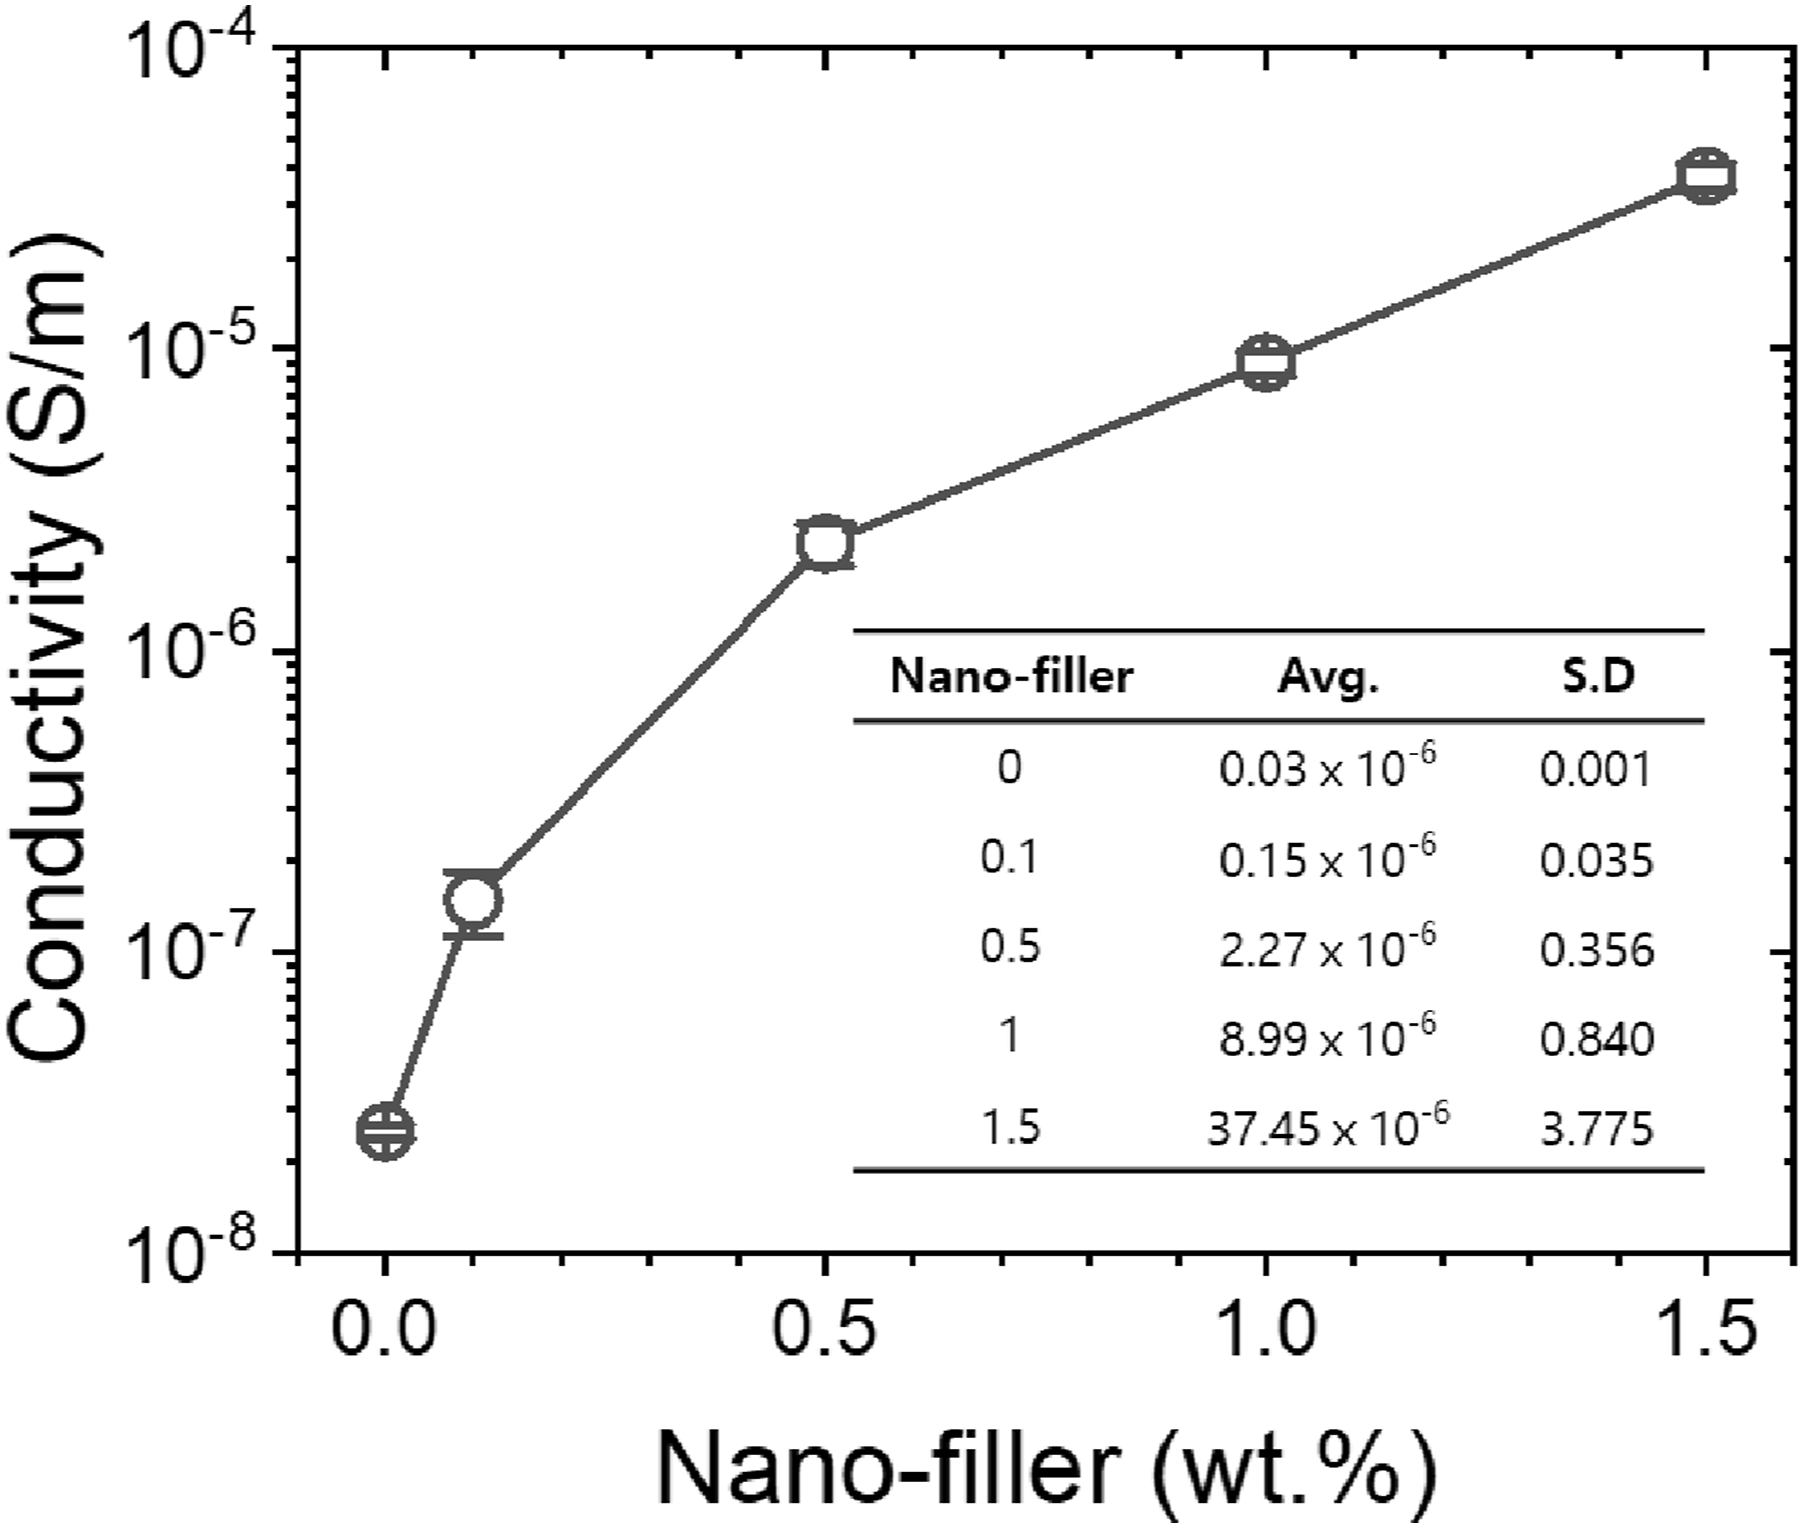
Effect of flow velocity on current response
To examine the impact of flow velocity on the current response induced by erosion damage, a jet impingement test was conducted under potentiostatic condition at 10 VSCE. The applied potential of 10 VSCE was chosen to ensure that the measured current values remained within a meaningful and interpretable range. Selecting a voltage that is too low could result in extremely small current values, making it difficult to observe significant responses associated with erosion dynamics. Conversely, excessively high voltages may pose a risk of sparking or arc discharge, which can lead to unpredictable damaging conditions for the blade system especially in environments where conductive paths may form. In our experiments, the applied voltage of 10 VSCE allowed for stable current measurements in the range of approximately 0.1 to 1 µA.
It is well understood that higher flow velocities lead to more significant erosion damage primarily due to the increased collision energy of sand particles against the surface of the material. Upon impact, these particles can cause abrasion and scratching particularly in the primary collision zone. 32 Furthermore, secondary damage may occur as particles spread out upon collision, potentially affecting adjacent areas of the surface. The resistance of the target polyurethane nanocomposite material to erosion in a two-phase solid-liquid flow environment is profoundly influenced by its mechanical characteristics. Unlike metallic materials, which may exhibit erosion-corrosion damage in corrosive environments, polyurethane materials are more prone to erosion damage even in such conditions owing to their superior corrosion protection performance. In contrast, metallic materials like stainless steel are susceptible to erosion-corrosion damage, resulting from the combined effects of mechanical damage and electrochemical corrosion. This synergistic interaction often leads to more severe damage than would be caused by either process alone.
For metallic materials subjected to jet impingement tests, the absolute value of current response in potentiostatic mode typically exhibits a direct correlation with flow velocity.
33
As flow velocity increases, the erosion-corrosion current tends to rise accordingly. However, in the case of the polyurethane materials investigated in this study, the absolute value of current response at 10 VSCE in potentiostatic mode remained exceedingly low, consistently below 1 μA cm-2. Moreover, this absolute current value showed no noticeable correlation with flow velocity. Instead of relying on absolute current values, the study identified a more meaningful parameter: the current slope (dI/dt), which exhibited a close relationship with flow velocity across numerous erosion experiments. Essentially, the higher the flow velocity from the nozzle tip to the specimen surface, the steeper the slope calculated from the current-time curve. This current slope was determined by the tangent line at the initial maximum slope as indicated by a dotted tangent line in Figure 6. The effectively captures the characteristic current slope progression pattern during erosion damage. This initial maximum slope was consistently maintained for all polyurethane nanocomposite samples used in the study, persisting for at least the first 1500 s in potentiostatic mode. This approach enabled the characterization of erosion damage dynamics and facilitated the establishment of a reliable relationship between the current slope and flow velocity for the polyurethane nanocomposite materials under investigation. In fact, the maximum current slope measured in Figure 8 falls within the range of current slopes measured over a short period while varying the flow velocity, as shown in Figure 11. Schematic of the current versus time relationship typically observed in the jet impingement tests and the method of slope determination (Red dots).
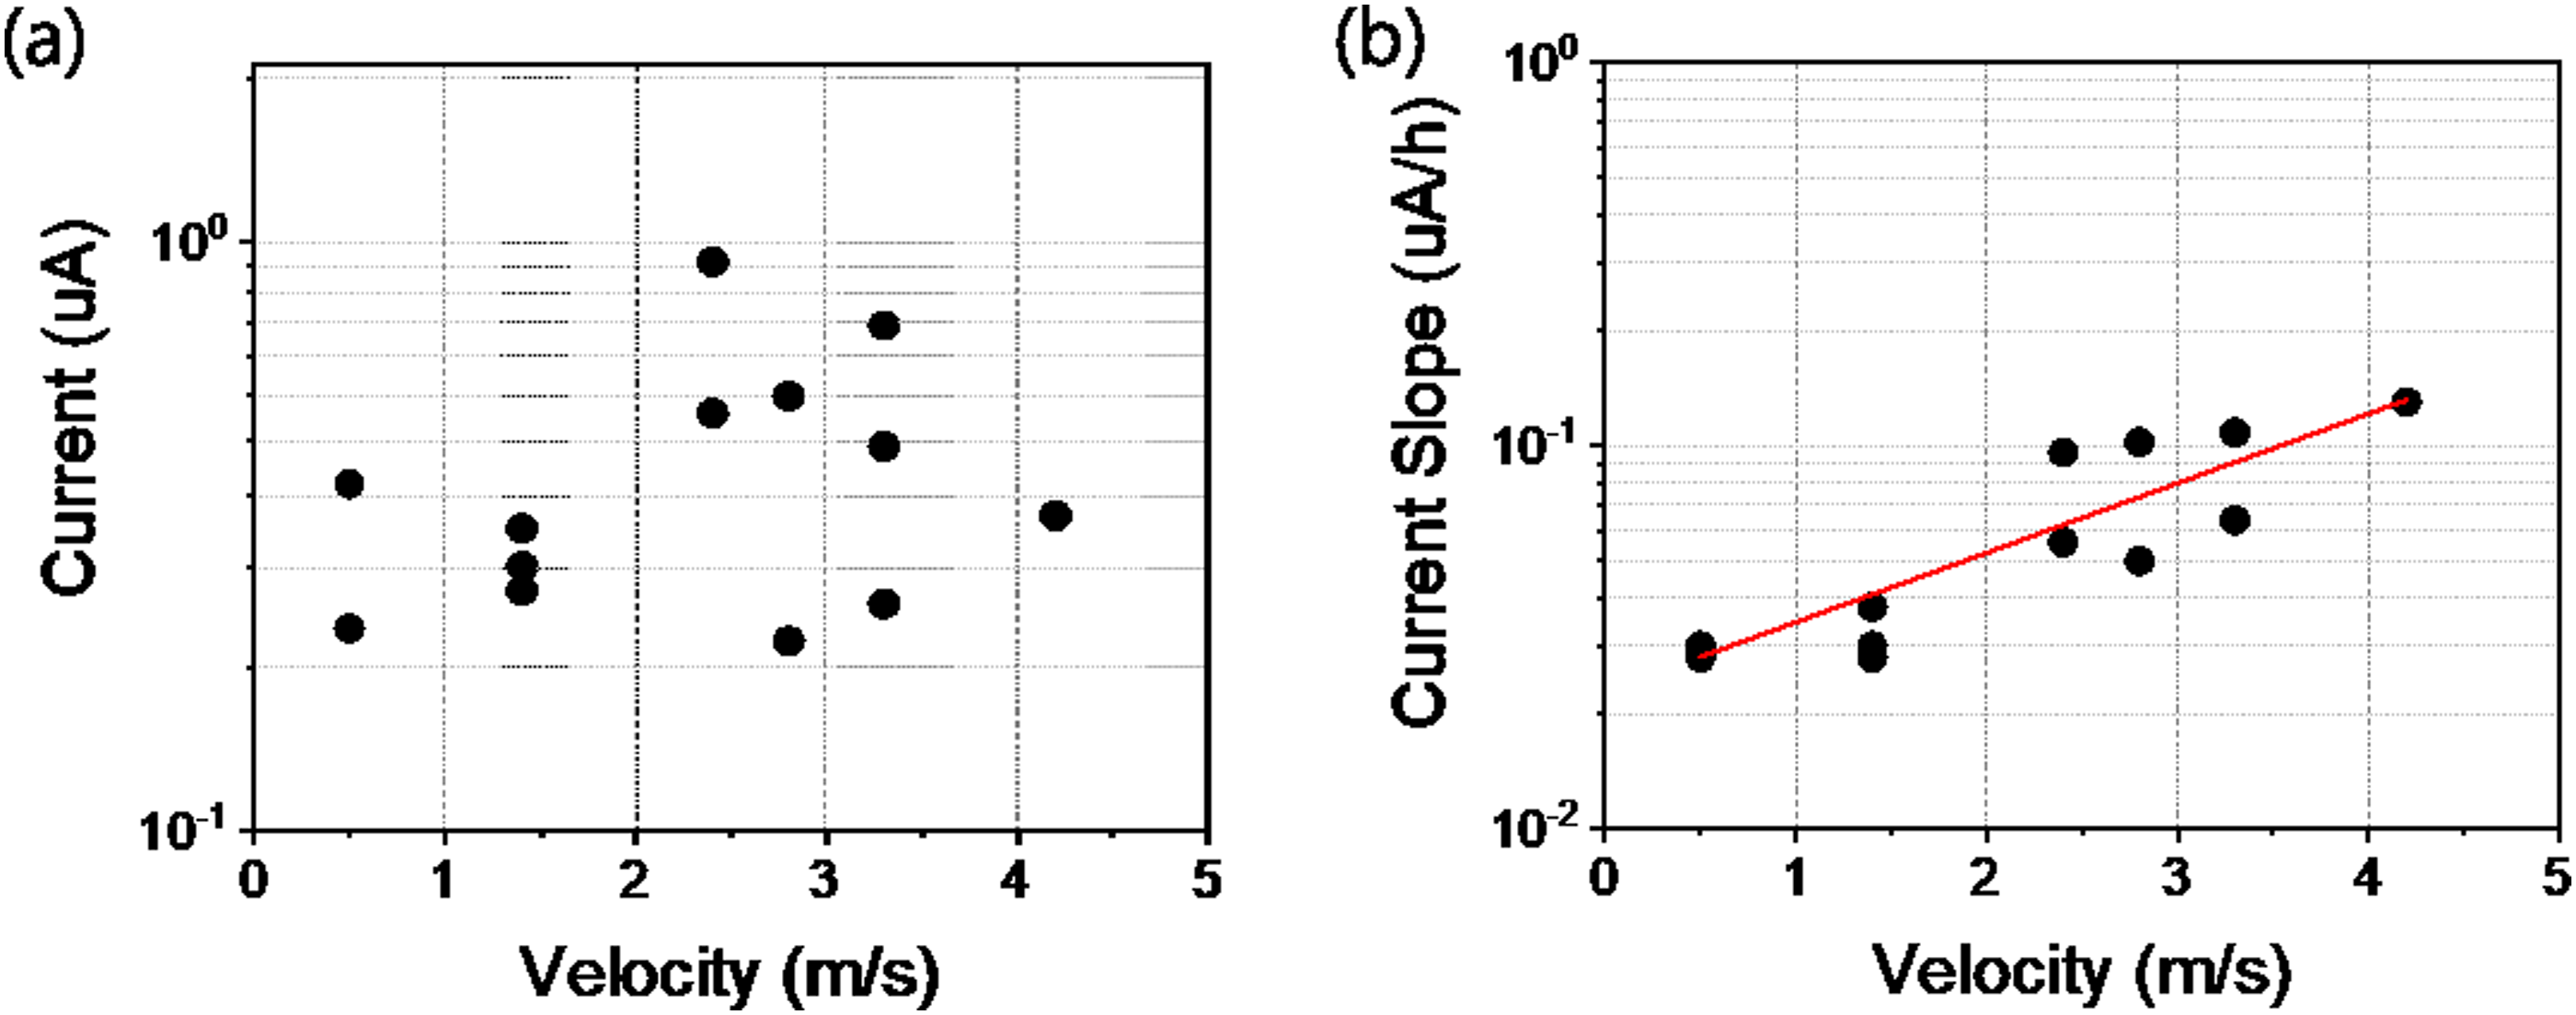
In Figure 7(a)‒7f, the potentiostatic polarization current maintained at 10 VSCE was monitored for 1 h during the jet impingement test and plotted against both flow velocity and time. The resultant current-velocity relationship is depicted in Figure 8(a). Across all specimens investigated, a notable phenomenon emerged: a significant inhibition characterized by a sharp decrease in current was observed within the initial 300 s. Subsequently, erosion damage commenced manifesting as an increase in current over time. This steady rise in current starting around the 300 s mark signifies the initiation and stable progression of erosion damage. Notably, no sporadic current spikes were observed during this phase of current increase for any of the test conditions. It is evident from the results that the absolute value of current remained consistently below 1 μA cm-2 across all flow velocities tested regardless of the erosive conditions. This observation is attributed to the relatively low conductivity of the polyurethane nanocomposite, approximately around 10-5 S m-1, which suggests that the current magnitude was not directly proportional to flow velocity as previously noted. For instance, at flow velocities of 0.5 m s-1 and 4.2 m s-1, current values in the range of 0.2–0.5 μA cm-2 and 0.4 μA cm-2 were recorded, respectively, demonstrating the non-linear relationship between the current and the flow velocity. Instead of focusing solely on the absolute value of current, the study identified the slope of current with time as a more relevant parameter for assessing erosion dynamics. As shown in Figure 8(b), the current exhibited a consistent increase over time after the initial 300 s with the current slope showing a direct correlation with flow velocity. This increasing trend indicates that erosive wear damage escalates proportionally with flow velocity. Indeed, the current slope rose by an order of magnitude ranging from 0.03 to 0.13 μA h-1 with an increase in flow velocity from 0.5 to 4.2 m s-1. Representative current-time curves of the polyurethane nanocomposite with 1 wt% nano-fillers obtained by the jet impingement tests at various velocities: (a) 0.5 m s-1, (b) 1.4 m s-1, (c) 2.4 m s-1, (d) 2.8 m s-1, (e) 3.3 m s-1, (f) 4.2 m s-1. At least two measurements were carried out for each flow velocities and their data set are included in Figure 9. Relationship between the (a) flow velocity (m s-1) and absolute current (μA), (b) flow velocity (m s-1) and current slope (μA h-1) calculated from Figure 8. Absolute current values are that after the jet impingement tests for 3600 s and current slope values are calculated between the 500 and 1500 s.
Considering a hypothetical design thickness of 200 μm for the erosion-resistive polyurethane coating on wind power blades, the erosion life under various flow velocities was estimated. As shown in Figure 9, at flow velocities of 3.3, 4.2, and 5.2 m s-1, the erosion lives were calculated to be 13.7, 2.7, and 1.3 h, respectively. These estimates underscore the relatively short erosion lives of the polyurethane nanocomposite attributed to accelerated erosive wear damage induced by the presence of a high concentration of erodent particles (10 wt%). To predict erosion life at an unknown flow velocity, plotting an erosion life versus flow velocity curve would be an effective approach. Changes in erosion depth with jet impingement time of the polyurethane nanocomposite containing 1 wt% nano-filler as a function of flow velocity. Cross-sectional FE-SEM image of the specimens after the jet impingement tests are included. Dots in the FE-SEM images indicate original surface before the jet impingement tests.
The erosion of the polyurethane nanocomposite surface due to erosive wear is influenced by several factors including the properties of the target surface, flow velocity, characteristics of the erodent particles (such as material, size, and impact angle), among others. In this study, both the target surface and erodent particles were held constant to isolate the effect of flow velocity on the potentiostatic mode current response during the jet impingement test. Under conditions where erodent particles impact the ductile polyurethane surface at a high angle of 90°, erosive wear occurs primarily due to micro-forging and deformation mechanisms. 34 As particles collide with the surface, they cause the formation of chips through deformation. Subsequent impacts may detach these chips from the surface, leading to the progressive formation of erosion pits. This phenomenon is exacerbated by the accumulation of residual strain, further facilitating the detachment of material from the surface. 35 Following the jet impingement test, erosion pits were observed on the polyurethane surface, as depicted in Figure 9 (refer to the included FE-SEM images). With increasing flow velocity and testing time, the depth and width of these erosion pits gradually increased, resulting in a corresponding decrease in erosion life. Depending on the specific test conditions, extrapolation or interpolation techniques can be employed to estimate the erosion life required to reach the design thickness based on the erosion pits observed at the given flow velocities. Ultimately, the erosion life can be reliably predicted using the calculation of the current slope. By monitoring the current response over time and assessing the relationship between current slope and flow velocity, it becomes feasible to forecast erosion life accurately. This approach offers valuable insights into erosion dynamics and facilitates the development of strategies to mitigate erosion damage, thereby enhancing the durability and longevity of polyurethane nanocomposite materials in practical applications.
For industrial-scale implementation in wind turbine blade applications, the scalability of nanocomposite processing and sensor integration remains a challenge. The CNT/rGO hybrid slurry used in this study is based on commercially available formulations that are already utilized in large-scale secondary battery production, suggesting some level of scalability. However, adapting the casting, curing, and electrode integration processes for continuous or large-area coating on turbine blades will require further engineering development. Cost-wise, while CNT and rGO were once considered high-cost nanomaterials, recent advances in mass production have significantly reduced their price to levels compatible with industrial coatings, particularly when used in small weight percentages (≤1.5 wt%). Nevertheless, a comprehensive techno-economic assessment including lifecycle durability and integration cost should be the subject of future work.
Prediction of flow velocity using individual-dataset-based ensemble model
The dataset for predicting flow velocity comprises velocity-current slope graphs from 32 experiments, as depicted in Figure 10, illustrating the increasing current slope with velocity. Datasets are categorized based on experimental conditions: dataset-up for velocity increase (Figure 11(a)) and dataset-down for velocity decrease (Figure 11(b)). Each dataset was further divided into training and validation subsets. Predicting flow velocity from the current slope involves constructing a model using all data points from experiments. However, considering potential variations in sample preparation and measurement, each experimental results are better regarded as data from an uncalibrated sensor. To address this variability, an individual dataset-based ensemble model was employed. This approach involves constructing several individual models using data from each experiment and then amalgamating them. This ensemble model strategy acknowledges the inherent variability in experimental data, as seen in Figure 12, where the current slope, fitted with a linear model for each experimental case, displays substantial variation in individual data points yet consistent trends across fitted models. Effect of changes in flow velocities on the current response and its slope of the polyurethane nanocomposite containing 1 wt% nano-fillers obtained during the jet impingement tests. Abbreviations of VEL and SL means velocity (m/s) and current slope (uA/h) for each section divided by dots, respectively. Only six measurements were included in Figure 10, whereas 32 measurements were carried out. Inserted photos are of the samples after the tests. Relationship between the flow velocity (m s-1) and current slope (uA h-1) when the flow velocity (a) increased and (b) decreased calculated from Figure 11. These data set are from 32 measurements. Linear models for individual experimental cases.


For the base prediction model, both linear regression and support vector regression (SVR) with various kernels were employed. Given the limited data points in each experimental case (3 to 7), more complex machine learning techniques like deep neural nets or boosting-based models risk overfitting. The individual dataset-based ensemble model was obtained by training models on individual datasets and then averaging predictions while assessing prediction variation. Figure 13(a) and (b) illustrate the ensemble model using linear regression, showcasing the predicted 1-sigma and 2-sigma regions and their alignment with the test data. Linear model based ensemble model (a) using dataset with increasing velocity, (b) using dataset with decreasing velocity.
Additionally, SVR models—SVR-poly and SVR-RBF, with specified kernel functions—are employed to capture the non-linear nature of the data.

Hyper parameters for SVR model selection.


SVR-based ensemble model and grid search for parameter selection for dataset-up (a) with polynomial kernel, (b) with RBF kernel, and for dataset-down (c) with polynomial kernel, (d) with RBF kernel.
In summary, the individual dataset-based ensemble model provided a robust framework for predicting flow velocity while considering the uncertainty inherent in individual experiments. Both linear models and SVR yielded reasonable inference results, highlighting the importance of choosing appropriate base models. However, when using non-linear base models, careful parameter tuning is essential to mitigate overfitting risks and ensure accurate predictions.
Conclusions
This study delved into the impact of flow velocity on the current response, stemming from erosion damage on a nanocomposite material composed of polyurethane, CNT, and rGO. Through the integration of CNT/rGO hybrid liquid with an NMP organic base, proper dispersion of the nano-fillers into the polyurethane matrix was achieved, resulting in an observed transition from insulator to conductor. Erosion tests conducted in a 3.5% NaCl solution, supplemented with 5 wt% sand particles, revealed that higher flow velocities led to increased surface damage due to elevated collision energy from the sand particles. Unlike metallic materials, where the absolute current response correlates directly with flow velocity, polyurethane materials exhibited a closer relationship between current slope and flow velocity. The upward trend in current slope over time indicated a proportional increase in erosive wear damage with escalating flow velocities. To predict flow velocity, an innovative individual dataset-based ensemble model was devised, considering the variability inherent in uncalibrated sensor data. Leveraging linear regression and support vector regression (SVR) with various kernel functions as base prediction models, the ensemble approach effectively mitigated overfitting concerns arising from limited data points in each experimental case. By averaging predictions from multiple trained models and assessing their variation, the ensemble model demonstrated superior performance, notably yielding R2 values as high as 0.93 across both increasing and decreasing velocity scenarios. This study demonstrates the potential of polyurethane as a sensor material by utilizing its current response characteristics to monitor erosion damage progression. This novel approach highlights the expanded functionality of polyurethane beyond its conventional protective role, offering new insights into its application as an effective sensing material.
Footnotes
Funding
The author(s) disclosed receipt of the following financial support for the research, authorship, and/or publication of this article: The authors gratefully acknowledge the support of the Technology Innovation Program (Alchemist Project, 20012196, AI-based Supercritical Materials Discovery) funded by the Ministry of Trade, Industry & Energy and the National Research Foundation of Korea (NRF) grant funded by the Korea government (MSIT) (2022R1F1A1076146).
Declaration of conflicting interests
The author(s) declared no potential conflicts of interest with respect to the research, authorship, and/or publication of this article.
Data Availability Statement
The authors declare that all data supporting the findings of this study are included in the article.