
Abstract
Chitosan (CS)-based nanocomposite films were successfully fabricated by incorporating hematite (Fe2O3) nanoparticles (HNPs) as reinforcing fillers at varying weight percentages (x = 0, 1, 3, and 10) using the solution casting method. The HNPs were synthesized through a chemical route utilizing naturally occurring ferruginous laterites. Fourier-transform infrared spectroscopy (FTIR) confirmed the effective integration of HNPs into the CS matrix, while differential scanning calorimetry (DSC) revealed an increase in the glass transition temperature (T g ) from 121°C for pure CS to 132°C for the x = 3 nanocomposites. Mechanical testing demonstrated a threefold increase in tensile strength and a significant improvement in elastic modulus from 1.67 GPa for pure CS to 2.34 GPa for x = 3 nanocomposites. Electrical properties, including capacitance, impedance, and AC conductivity, were evaluated across a frequency range of 50 Hz–100 kHz and temperatures from 300 K to 390 K. The results for x = 3 sample exhibited an increased dielectric constant and the smallest semicircular arc in the Nyquist plot, signifying the lowest resistance and highest ionic conductivity. The AC conductivity analysis, modeled using Jonscher’s universal power law and the Arrhenius equation, demonstrated that incorporating HNPs reduced activation energy from 0.99 eV for pure CS to 0.53 eV for the x = 3 nanocomposites. Additionally, the correlated barrier hopping (CBH) mechanism was confirmed through S parameter analysis, with the maximum barrier height decreasing from 0.42 eV to 0.13 eV for x = 3. These findings highlight the substantial improvements in the thermal, mechanical, and electrical properties of CS-based nanocomposites, particularly at x = 3, making them promising candidates for advanced applications requiring superior thermal stability, mechanical strength, and ionic conductivity.
Keywords
Introduction
The growing demand for nanoparticles across various applications has positioned nanotechnology and nanomaterials as crucial research areas. 1 The quantum size effect enhances the electrical properties of materials. At the same time, the higher surface area of nanoparticles, compared to their volume, facilitates improved transport and chemical interactions, resulting in unique physical properties. 2 Nanocomposites, created by integrating nanoparticles into biopolymers, are utilized in diverse applications, including biosensors, solar cells, supercapacitors, and drug delivery systems. 3 The structural, dielectric permittivity, thermal, optical, electrical, and antibacterial properties of polymer nanocomposite films significantly differ from those of pure mixtures.4,5,6 This variation arises from the role of nanomaterials in providing a connecting network between the components of the polymer blend alongside the foundational function of polymer composites as matrices.
Under standard conditions, polycrystalline hematite (α-Fe2O3) is recognized as the most stable iron oxide phase from a thermodynamic perspective. Its stability and electrical conductivity make it a valuable electrode material in electrochemical sensing applications for substances such as folic acid, 7 glucose, 8 and deferoxamine. 9 Additionally, hematite serves various purposes, including lithium-ion batteries, water purification, anticorrosion agents, pigments, gas sensors, and catalysis.10,11,12,13 Iron oxide nanoparticles attract the interest of physicists, medical researchers, and materials scientists14–16 due to their superparamagnetic properties, versatility, and non-toxicity.
CS is a linear polysaccharide composed of β-(1→4)-linked D-glucosamine and N-acetyl-D-glucosamine units. Its chemical structure is derived from chitin, where the acetyl groups of the N-acetylglucosamine units are partially or entirely removed, giving rise to the amino groups (–NH2) on the glucosamine units. The primary structure can be represented as: [-(C6H11NO4)n-]. CS is valued for its biocompatibility, biodegradability, and non-toxic nature, making it ideal for applications in biomedical, environmental, and food packaging technologies. However, its inherent limitations, such as low mechanical strength, poor thermal stability, and limited electrical conductivity, restrict its broader use in advanced technologies. Improving CS through nanocomposite formation, like incorporating nanoparticles, enhances its mechanical, thermal, and electrical properties, expanding its potential for high-performance applications, including sensors, energy storage devices, and bioplastics. CS is a crucial functional material utilized in biosensors, separation membranes, tissue engineering, and wastewater treatment. 17 CS has amino group chelation sites that can bind metal ions by ion exchange and complexation processes. 18 Chemically increasing the amine group content may enhance selectivity and adsorption. However, CS possesses poor physical characterizations.
As our previous study 19 outlined, the optical and dynamic mechanical properties of HNPs incorporated with CS were enhanced. CS supplemented with CuS nanoparticles also improved thermal stability, dielectric constant, AC conductivity, and mechanical characteristics. 20 Furthermore, the introduction of ZrCeO4 nanoparticles into CS significantly improved the resulting nanocomposites’ thermal degradation properties and mechanical qualities. 21 Additionally, doping CS composites with C60 led to a notable enhancement in their optical constants and the optical energy bandgap. 22
HNPs/CS nanocomposites are hybrid materials that merge the biocompatibility and biodegradability of CS with the magnetic and dielectric properties of HNPs. These nanocomposites demonstrate exceptional mechanical strength, thermal stability, and magnetic responsiveness, making them suitable for various applications, including drug delivery, environmental remediation, and electromagnetic shielding. Including HNPs enhances electrical conductivity and introduces interfacial polarization, influencing the dielectric properties and energy dissipation behavior. Additionally, the ferrimagnetic properties of Fe2O3 contribute to the nanocomposite’s magnetic characteristics, rendering it valuable for uses in magnetic hyperthermia and targeted drug delivery.23–26 At the nanoscale, the elevated surface area of HNPs enhances interfacial interactions, thereby improving dispersion stability within the CS matrix. The concentration, particle size, and distribution of HNPs within the CS matrix influence these characteristics, allowing for customization for specific applications. The resulting nanocomposites are promising for electromagnetic shielding and drug delivery systems.27,28
Incorporating hematite nanoparticles (HNPs) into chitosan (CS) matrices enhances mechanical strength and ionic conductivity, with optimal improvements around 3 wt.% HNPs. However, exceeding this threshold can lead to diminishing returns due to several factors. High concentrations causes nanoparticle agglomeration, forming clusters that act as defects and weaken the composite. The polymer matrix also has limited capacity to accommodate nanoparticles; beyond this point, saturation leads to phase separation or voids, reducing load transfer. Additionally, higher nanoparticle loading increases viscosity, hindering proper mixing and dispersion. Excessive HNP content can also compromise optical clarity and electrical properties, limiting the material’s effectiveness.29–31 This study uniquely combines thermal, mechanical, and electrical analyses to demonstrate the synergistic effects of hematite nanoparticle reinforcement on chitosan films, with a focus on improved ionic conductivity and mechanical properties for HNPs/CS nanocomposites with HNP contents of x wt.% (x = 0, 1, 3, 10).
Materials and methods
Materials preparation
Preparation of Fe2O3 nanoparticles
The synthesis of Fe2O3 nanoparticles was carried out following the procedure described by Mehdizadeh et al. 31 Initially, 3.0 g of ferric nitrate (Fe(NO3_3)3_3·9H2_2O) was dissolved in 200 mL of distilled water under constant stirring. Subsequently, 15 g of NaOH was gradually added to the solution, resulting in the formation of a ferric hydroxide suspension. This suspension was transferred into a 300-mL Teflon-lined stainless-steel autoclave and heated at 170°C for 20 h with magnetic stirring at 180 rpm. Following the reaction, the nanoparticles were washed several times with distilled water to ensure purity and dried at 100°C for 24 h.
Preparation of Fe2O3 NPs/CS nanocomposites
High molecular weight CS, with the formula (C6H11NO4)n, was procured from Acros Organics in New Jersey, USA. To prepare the CS solution, 50 mL of distilled water, 2% acetic acid, and the desired amount of CS were combined and magnetically stirred for 3 h at 25°C. Subsequently, varying amounts of HNPs (x = 1, 3, 10 wt%), which had been sonicated for 30 min in 20 mL of distilled water, were gradually incorporated into the mixture, followed by stirring for 2 h. The prepared solution was poured into leveled hydrophobic polystyrene Petri dishes (10 cm in diameter) and left to dry at 40°C for 24 h, forming the desired films. Once dried, the thin films were carefully removed from the dishes and stored in sealed containers to prevent moisture exchange. Filler concentrations of 1, 3, and 10 wt.% were selected to investigate the effect of varying filler content, with 10 wt.% set as the upper limit to minimize potential agglomeration.
Experimental methods
Fourier-transform infrared (FTIR) spectroscopy
FTIR spectra of the HNPs/CS nanocomposites were recorded using a JASCO FTIR-300 E spectrophotometer. Samples with a thickness of approximately 0.1 mm and dimensions of 10 mm × 10 mm were prepared from three separate batches to verify reproducibility. The measurements were conducted in the spectral range of 400–4000 cm−1 with a resolution of 4 cm−1.
FTIR spectra from three independently fabricated samples for each composition were compared. The consistency of peak positions and intensities across batches confirmed reproducibility. A low variation (<2%) in characteristic peak intensities was observed, indicating reliable sample preparation and measurement.
Differential scanning calorimetry (DSC)
DSC analysis was performed using a NETZCH DSC 204 F1 Phoenix system under a nitrogen flow rate of 50 ml/min. Rectangular samples with a weight of 4 mg were used. The samples were placed in open platinum crucibles (6 mm diameter, 3 mm height). To eliminate moisture, an initial heating cycle to 110°C was followed by cooling to 30°C. The second heating cycle was conducted from 30°C to 200°C at a rate of 20°C/min, with a sensitivity of 0.1 mg. This procedure assessed the glass transition temperature (T g ) of the HNPs/CS nanocomposites. Three samples from each composition were analyzed to assess consistency in thermal properties. The T g values were consistent across batches, with variations below ±1°C. This result demonstrated reproducibility in both sample preparation and thermal analysis.
Tensile strength
The tensile strength and elastic modulus of the HNPs/CS nanocomposites were measured using a calibrated bench-top tensile test setup. 21 Dog-bone-shaped samples with dimensions of 50 mm (length) × 2 mm (width) × 0.1 mm (thickness) were prepared according to ASTM D882 standards. The testing system featured a directly controlled drive linear motor XY stage and a Lorenz Messtechnik K-100 tension force sensor with a measuring range of 1–100 kN. Tests were conducted at a strain rate of 10 mm/min. Tensile tests were performed on three specimens for each composition. Variations in tensile strength and elastic modulus across batches were below ±3%, demonstrating consistent mechanical properties and reliable produce-ability.
Dielectric and electrical properties
Dielectric properties of the HNPs/CS nanocomposites were measured using an MCP (BR2827) LCR meter over the temperature range of 300 K to 390 K and frequencies between 50 and 100 kHz. Circular disc-shaped samples with a diameter of 20 mm and a thickness of 0.1 mm were prepared from three independent batches. Capacitance C(ω) and impedance Z(ω) were measured to derive the dielectric constant (ε′) and dielectric loss (ε″) under varying thermal and frequency conditions. The complex permittivity (ε) was determined using the following relationship:

The real Z′(ω) and imaginary (Z″(ω)) components of the complex impedance were calculated using the following equations:

Results and discussions
FTIR analysis
The FTIR spectra for x = 0 and x = 3 were selected to demonstrate the structural enhancement achieved by incorporating hematite nanoparticles into CS (Figure 1(a)). The overlapping stretching vibrations of O-H and N-H groups appear at 3199 cm−1 for x = 0 while they shift to 3203 cm−1 for x = 3. This shift refers to the formation of stronger hydrogen bonds facilitated by the incorporation of HNPs. Similarly, CH2 and CH3 group bands exhibit a minor shift from 2919 cm−1 to 2922 cm−1. The carbonyl (C=O) stretching band at 1634 cm−1 for x = 0 shifts slightly to 1630 cm−1 for x = 3. Furthermore, distinct peaks at 555 cm−1 and 463 cm−1 correspond to Fe-O absorption bands, which confirm the presence of hematite nanoparticles within the composite.
21
FTIR (a) and DSC (b) signals for HNPs/CS nanocomposites with HNP concentrations of x = 0, 1 wt.%, with the position of the glass transition temperature (Tg) marked by arrows.
These spectral shifts collectively demonstrate that the incorporation of HNPs enhances the chemical structure of the composite by facilitating stronger interactions between functional groups, particularly hydroxyl, amine, and carbonyl groups. These interactions not only improve the stability of the matrix but also suggest improved physical properties, such as increased thermal and mechanical stability, which are further discussed in subsequent sections.
DSC analysis
The DSC spectra for x = 0 and x = 3 were selected to emphasize the thermal enhancements resulting from the incorporation of HNPs into the CS matrix. This incorporation significantly affects the thermal behavior of CS, as evidenced by the glass transition temperature (T g ) shown in Figure 1(b). For the pure CS sample (x = 0), T g is approximately 121°C. However, with the addition of HNPs (x = 3), T g increases to 132°C. This substantial shift indicates that HNPs restrict the mobility of CS chains, likely due to electrostatic interactions and hydrogen bonding between the nanoparticles and the polymer matrix. 32
The increase in T g indicates enhanced thermal stability of the composite. This behavior reflects stronger interactions within the material, as HNPs form coordination bonds with the functional groups of CS. The improved thermal stability is further supported by the increased rigidity of the composite, which results from the homogeneous dispersion of nanoparticles and the resulting interfacial interactions. 33
The observed increase in the glass transition temperature (T g ) upon incorporating HNPs can be attributed to several mechanisms. Firstly, HNPs strongly interact with the polymer chains of the chitosan (CS) matrix through hydrogen bonding and electrostatic interactions. These interactions limit the mobility of polymer chains near the nanoparticle interface, resulting in a higher T g . Additionally, HNPs serve as physical cross-linkers within the CS matrix, creating a more constrained polymer network. This increased structural rigidity requires greater thermal energy to transition the matrix from a glassy to a rubbery state.33–35 These findings underscore the role of HNPs in improving the thermal performance of CS-based nanocomposites, aligning with similar reports in the literature.34–37
Tensile strength and elastic modulus analysis
The stress-strain curve for the HNPs/CS nanocomposite demonstrates distinct mechanical behavior influenced by incorporating HNPs within the CS matrix, as shown in Figure 2. In the initial linear portion of the curve, the stress increases proportionally with strain, representing the elastic region. The HNPs/CS nanocomposite exhibits a steeper slope in this region than pure CS, indicating that incorporating HNPs enhances the stiffness and elastic modulus of the nanocomposite. The nanocomposite shows a higher Young’s modulus due to the reinforcement effect of the HNPs, meaning it is more resistant to deformation under stress than pure CS.38–40 As the stress increases, the nanocomposite reaches its yield point, where the linear relationship between stress and strain ends, and plastic deformation begins. The yield strength is higher than that of pure CS due to adequate interfacial bonding between HNPs and the CS matrix. The improved yield strength suggests that the nanocomposite can withstand a higher load before undergoing permanent deformation. The ultimate tensile strength (UTS), the maximum stress the material can endure, is higher in the HNPs/CS nanocomposite than in pure CS. This is due to the reinforcing effect of the HNPs, which help distribute the applied load more effectively, improving the material’s tensile strength.41,42 The higher UTS indicates that the nanocomposite can handle significant tensile loads before the onset of necking. The stress-strain curve of HNPs/CS nanocomposites shows an apparent enhancement in mechanical properties compared to pure CS—incorporating HNPs results in increased stiffness, higher yield strength, and improved ultimate tensile strength. Although the ductility is slightly reduced due to the nanoparticles’ reinforcing effect, the overall mechanical performance is greatly enhanced, making the HNPs/CS nanocomposite suitable for applications requiring high strength and moderate flexibility. Incorporating HNPs into the CS matrix enhances tensile strength and elastic modulus, as seen in the figure’s parts (a) and (b). Notably, the x = 3 nanocomposite exhibits the highest tensile strength and elastic modulus. In contrast, the x = 10 sample shows a marked decrease in strength and modulus, with values approaching those of the x = 0 sample. The strength of the HNPs/CS nanocomposites is enhanced nearly threefold in the x = 3 sample compared to the x = 0 sample. Furthermore, the elastic modulus increases from 1.67 GPa in the x = 0 sample to 2.34 GPa in the x = 3 nanocomposite. This improvement can be attributed to the uniform distribution of HNPs within the host matrix. However, at higher concentrations, such as in the x = 10 nanocomposite, HNPs tend to agglomerate, resulting in a decline in performance. Tensile stress-strain curves, tensile strength (the onset a), and elastic modulus (the onset b) for HNPs/CS nanocomposites with HNPs concentrations of x = 0, 1, 3, and 10 wt.%.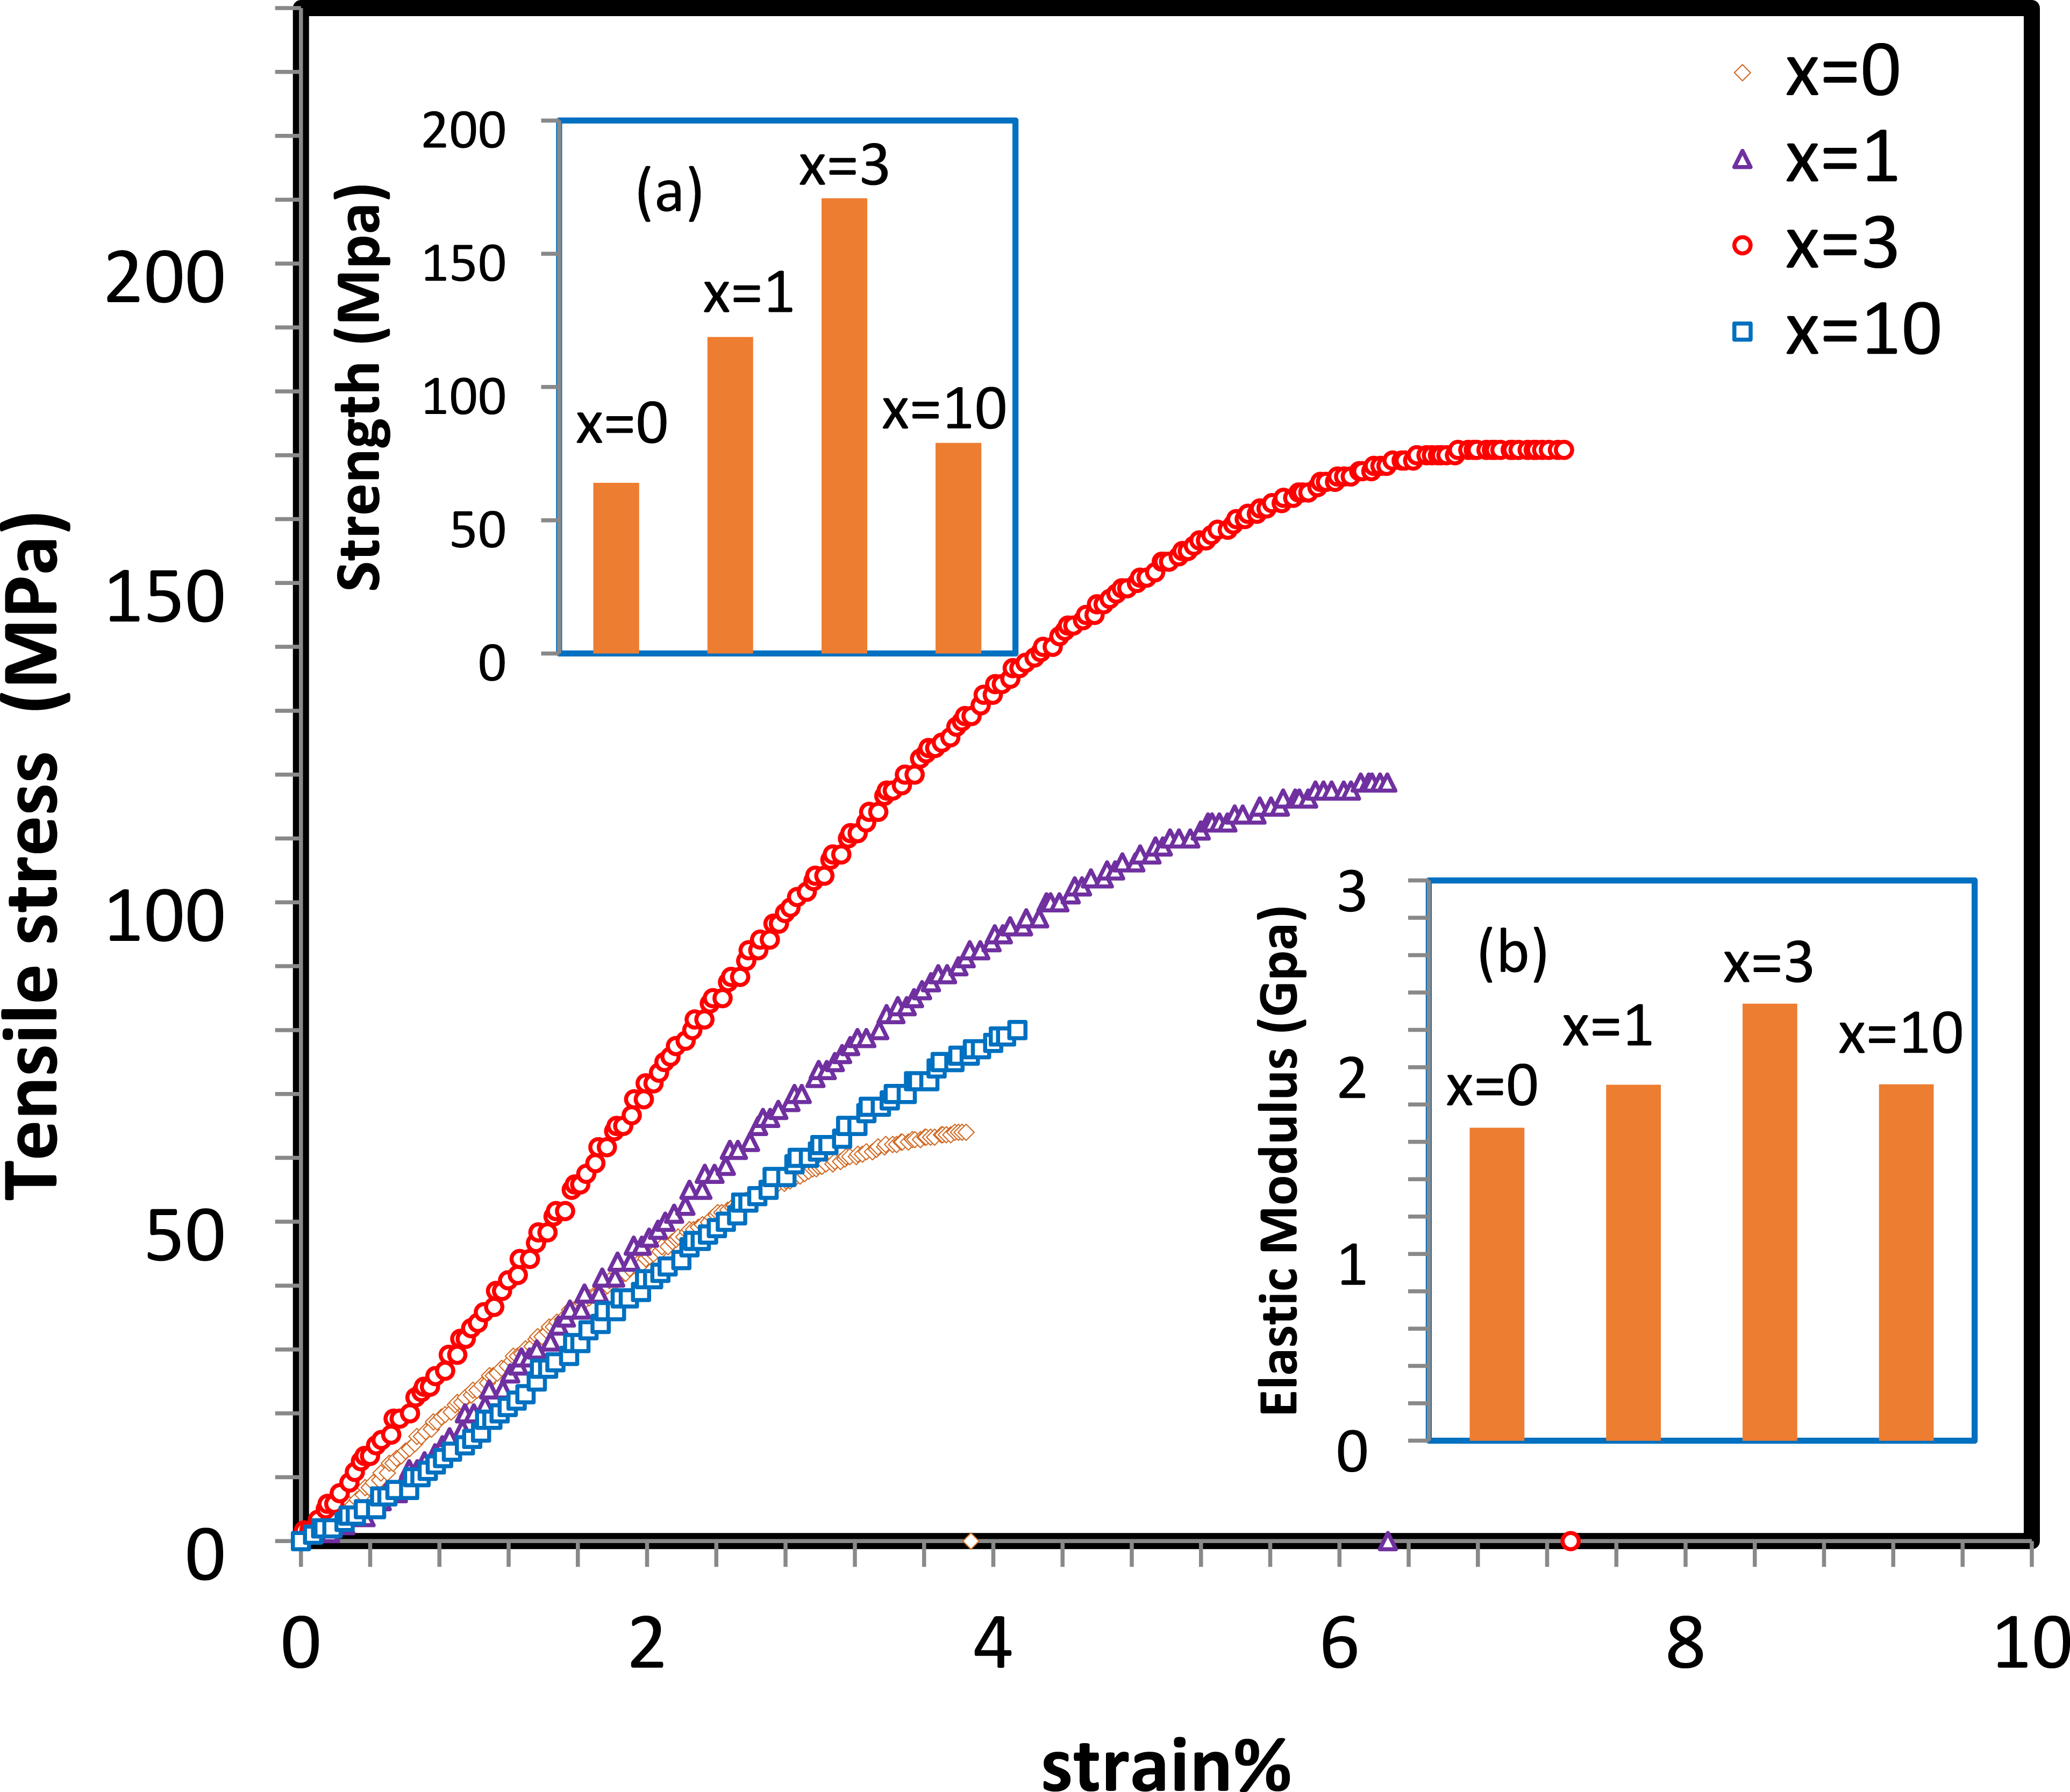
The enhanced mechanical properties of the composite can be attributed to several factors. The high intrinsic strength and stiffness of HNPs enable efficient stress transfer from the weaker CS matrix to the stronger HNPs when they are well-dispersed. Uniform dispersion of HNPs ensures a homogeneous reinforcement effect, reducing weak points and improving the structural integrity of the composite. Additionally, strong interfacial adhesion between HNPs and CS chains, facilitated by hydrogen bonding and potential ionic interactions, ensures effective stress distribution throughout the material, enhancing tensile strength and modulus. Furthermore, the incorporation of HNPs restricts the mobility of polymer chains, contributing to the composite’s ability to resist deformation under mechanical stress.43,44 CS has been reinforced with various types of nanoparticles, creating CS-based nanocomposites that exhibit improved stiffness and strength. These nanoparticles include nano-clay, nano-metal oxides, and graphene oxide. The enhancement is mainly due to the formation of interfacial hydrogen bonds between the metal oxides and the amino and hydroxyl groups of CS.45–48
Frequency and temperature dependence of dielectric properties
Figures 3 and 4 illustrate the frequency dependence of the real (ε′) and imaginary (ε″) parts of the dielectric constant for HNPs/CS nanocomposites with compositions x = 0, 1, 3, and 10 at various temperatures. The behavior of ε′ and ε″ is strongly influenced by the interplay of frequency, temperature, and composition. Frequency dependence of the real part of the dielectric constant (ε′) at various temperatures for HNPs/CS nanocomposites with HNP concentrations of x = 0, 1, 3, and 10 wt.%. Frequency dependence of the imaginary part of the dielectric constant (ε″) at various temperatures for HNPs/CS nanocomposites with HNP concentrations of x = 0, 1, 3, and 10 wt.%.

Frequency dependence
At lower frequencies, the real part of the dielectric constant (ε′) is significantly higher. This is attributed to the ability of dipoles within the material to align with the slowly oscillating electric field. Polarization mechanisms, such as ionic, dipolar, and space charge polarization, dominate at these frequencies, resulting in enhanced ε′. The incorporation of HNPs amplifies this effect by introducing interfaces between the nanoparticles and the CS matrix, which promote interfacial polarization due to charge accumulation at the boundaries.
As the frequency increases, ε′ decreases. At higher frequencies, dipoles cannot reorient quickly enough to keep pace with the rapidly changing electric field. Consequently, the contribution from slower polarization mechanisms diminishes, leaving only the faster electronic and atomic polarizations to sustain ε′, causing it to plateau. 49
The imaginary part (ε″), representing dielectric losses due to charge carrier movement and lagging dipole orientation, follows a similar trend. At lower frequencies, ε″ is higher due to substantial energy dissipation from dipole relaxation and charge carrier movement. Charge carriers accumulate at the HNP-CS interfaces, contributing to these losses. However, as frequency increases, the dipoles and charge carriers can no longer respond effectively to the field, resulting in a sharp reduction in ε″. Beyond a specific frequency, energy losses become minimal, reflecting the limited contribution of dipole relaxation and charge migration. This behavior aligns with Jonscher’s universal power law, which describes frequency-dependent dielectric responses influenced by the polymer matrix and embedded nanoparticles.50,51
Increasing the HNP content enhances both ε′ and ε″. The higher polarizability of HNPs and their interaction with the CS matrix introduce additional polarization mechanisms, thereby increasing the dielectric constant’s real and imaginary parts. The rise in HNP concentration from x = 0 to x = 10 amplifies these effects, particularly at lower frequencies.
Temperature dependence
Figures 5 and 6 show how ε′ and ε″ vary with temperature at different frequencies for the nanocomposites. The behavior is characterized by two distinct stages, each dominated by specific polarization and conduction mechanisms. Temperature dependence of the real part of the dielectric constant (ε′) at various frequencies for HNPs/CS nanocomposites with HNP concentrations of x = 0, 1, 3, and 10 wt.%. Temperature dependence of the real part of the dielectric constant (ε″) at various frequencies for HNPs/CS nanocomposites with HNP concentrations of x = 0, 1, 3, and 10 wt.%.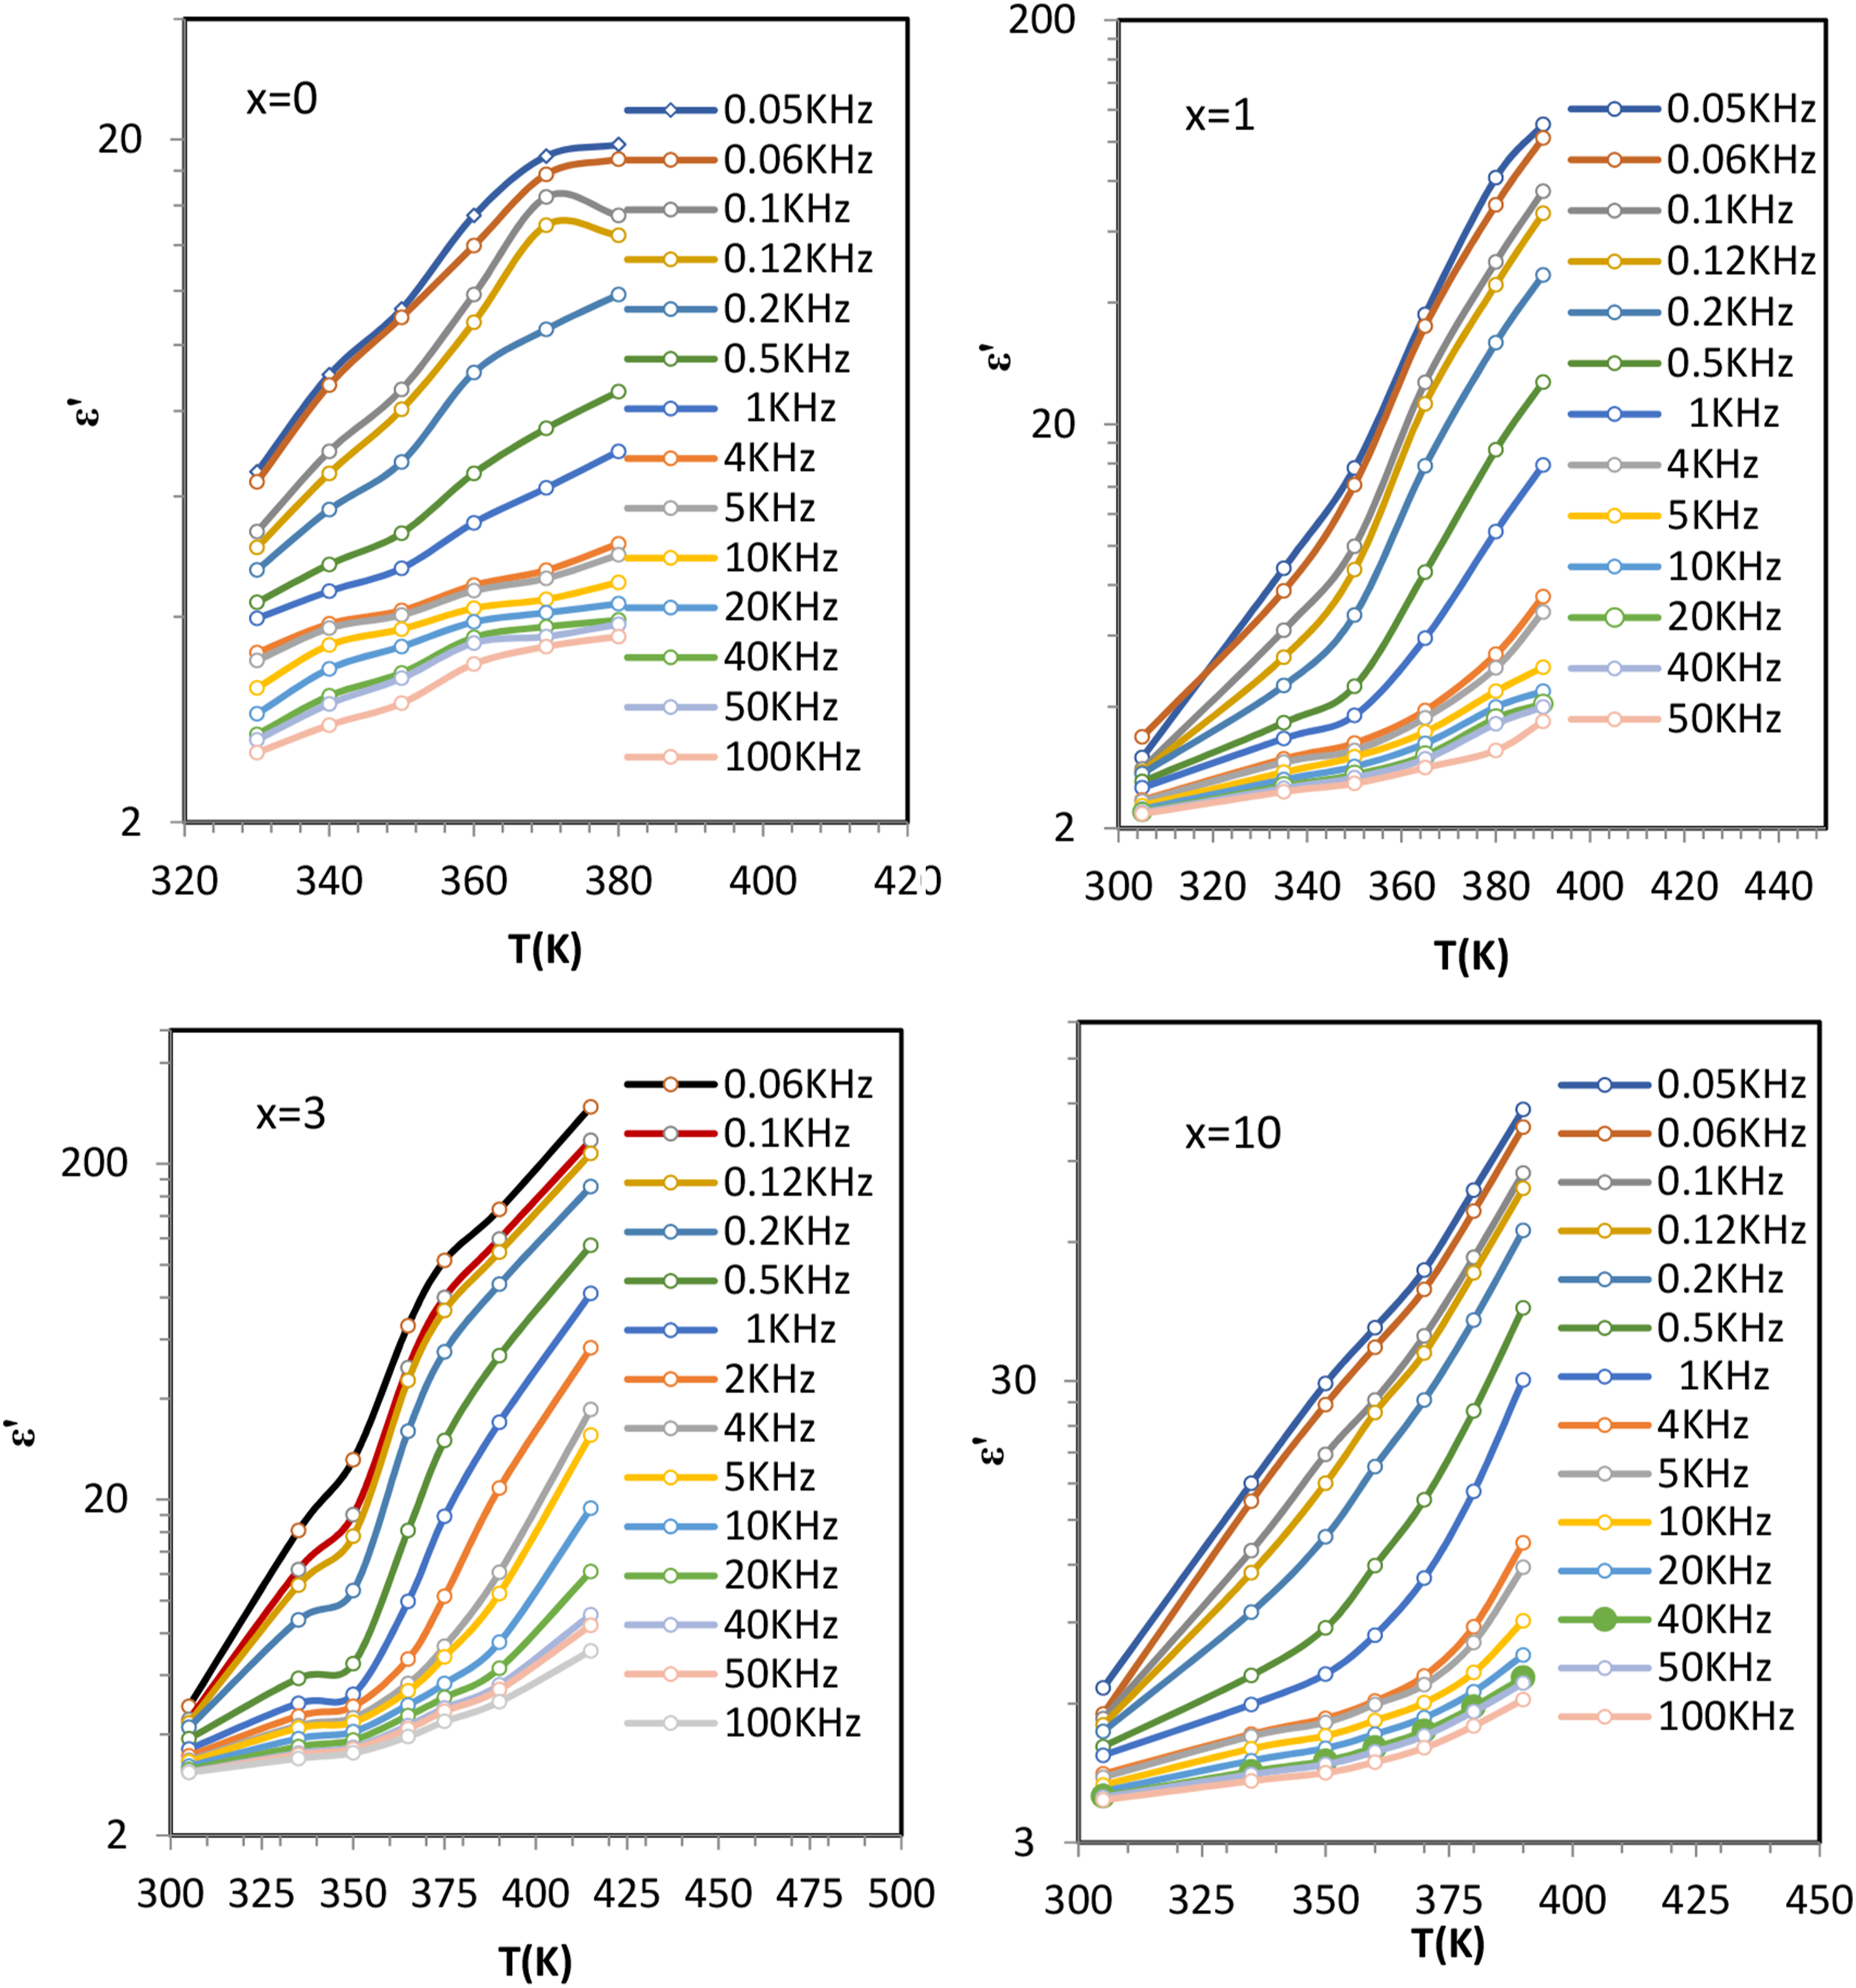

At lower to moderate temperatures, the increase in ε′ and ε″ is primarily governed by dipolar polarization within the CS matrix and interfacial polarization (Maxwell-Wagner polarization) at the boundaries between HNPs and the polymer matrix.
The material’s ability to store electrical energy increases as temperature rises. At lower temperatures, the mobility of dipoles within the CS matrix is restricted. With increasing temperature, thermal energy allows these dipoles to reorient more freely in response to the applied electric field. The introduction of HNPs creates heterogeneous interfaces, where charge accumulation contributes to enhanced polarization. This results in a pronounced increase in ε′ at elevated temperatures. Energy losses increase due to dipole relaxation and interfacial polarization. The accumulation of charges at the HNP-CS interfaces causes delays in response to the electric field, leading to higher energy dissipation. The effect is more significant at lower frequencies, where the field oscillates slowly enough to allow extensive polarization and charge movement.
At higher temperatures, ionic conduction and hopping mechanisms dominate the dielectric response. In case of real Part (ε′), thermal energy enables mobile ions in the CS matrix, such as protons, to move freely under the influence of the electric field, contributing to increased polarization. In addition, electron hopping between Fe2+ and Fe3+ ions within the HNPs becomes more pronounced, further enhancing the dielectric constant. These effects are particularly evident at lower frequencies, where the slower-changing electric field allows more substantial ionic and hopping contributions.
In case of Imaginary Part (ε″), the movement of mobile ions and electrons leads to conduction losses, appearing as an increase in ε″. The dissipation of energy due to collisions and resistance within the material contributes to this effect. Electron hopping between Fe2+ and Fe3+ adds to these losses, particularly at elevated temperatures.
At higher frequencies, the rapid oscillations of the electric field limit the ability of ions and hopping electrons to respond effectively, reducing the contributions to ε′ and ε″. Conversely, at lower frequencies, these mechanisms dominate, resulting in larger increases in both dielectric components.
The combined effects of frequency, temperature, and composition reveal the complex dielectric behavior of HNPs/CS nanocomposites: At low frequencies, the real and imaginary parts of the dielectric constant are strongly influenced by dipolar and interfacial polarization, with higher values for composites with greater HNP content. At high frequencies, these contributions diminish, leaving only fast polarization mechanisms (electronic and atomic) to sustain the dielectric response. At low to moderate temperatures, dipolar and interfacial polarization dominate, enhanced by the introduction of HNPs. At high temperatures, ionic conduction and electron hopping become significant contributors, particularly for composites with higher HNP concentrations. The two-stage behavior of ε′ and ε″ reflects the transition from dipolar-dominated polarization at lower temperatures to conduction and hopping mechanisms at higher temperatures. The frequency of the applied field further modulates these processes, highlighting the interplay between the polymer matrix, embedded HNPs, and external conditions. 52
Tangent loss tan (δ)
The tangent loss tan(δ) of HNPs/CS nanocomposites quantifies the energy dissipation that occurs when the material is subjected to an oscillating electric field. It is represented as tan(δ), where δ is the phase angle between the applied electric field and the resulting polarization. This parameter provides insight into the balance between the composite’s ability to store electrical energy and dissipate it as heat during dielectric relaxation processes. Higher tan(δ) values indicate greater energy dissipation, often manifesting as heat.
Frequency dependence of tangent loss
Figure 7 shows the frequency dependence of tan(δ) for HNPs/CS nanocomposites with compositions x = 0, 1, 3, and 10. At low frequencies, polarization mechanisms such as dipole orientation dominate, leading to higher energy dissipation. As the frequency increases, interfacial polarization and ionic conduction mechanisms become more significant, altering the tangent loss behavior. The inclusion of HNPs in the CS matrix changes the polarization dynamics by introducing additional dipole moments or charge carriers, which significantly influence the material’s response to the applied electric field. At a critical frequency, tan(δ) reaches a maximum, satisfying the relationship ωmax τ = 1, where ωmax is the angular frequency, and τ is the Debye relaxation time. At this frequency, the oscillation of dipoles synchronizes with the external electric field, causing maximum energy dissipation, often appearing as heat. The peaks in tan(δ) shift to higher frequencies with increasing temperature and HNP concentration, indicating a reduction in relaxation time. This behavior supports the Debye model and highlights the ionic nature of AC conductivity. A lower relaxation time (τ) corresponds to enhanced ionic conductivity, demonstrating that HNPs improve the composite’s AC conductivity.
53
Frequency dependence of the tangent loss (Tan (δ)) at various frequencies for HNPs/CS nanocomposites with HNP concentrations of x = 0 (a), 1 (b), 3 (c), and 10 (d) wt.%.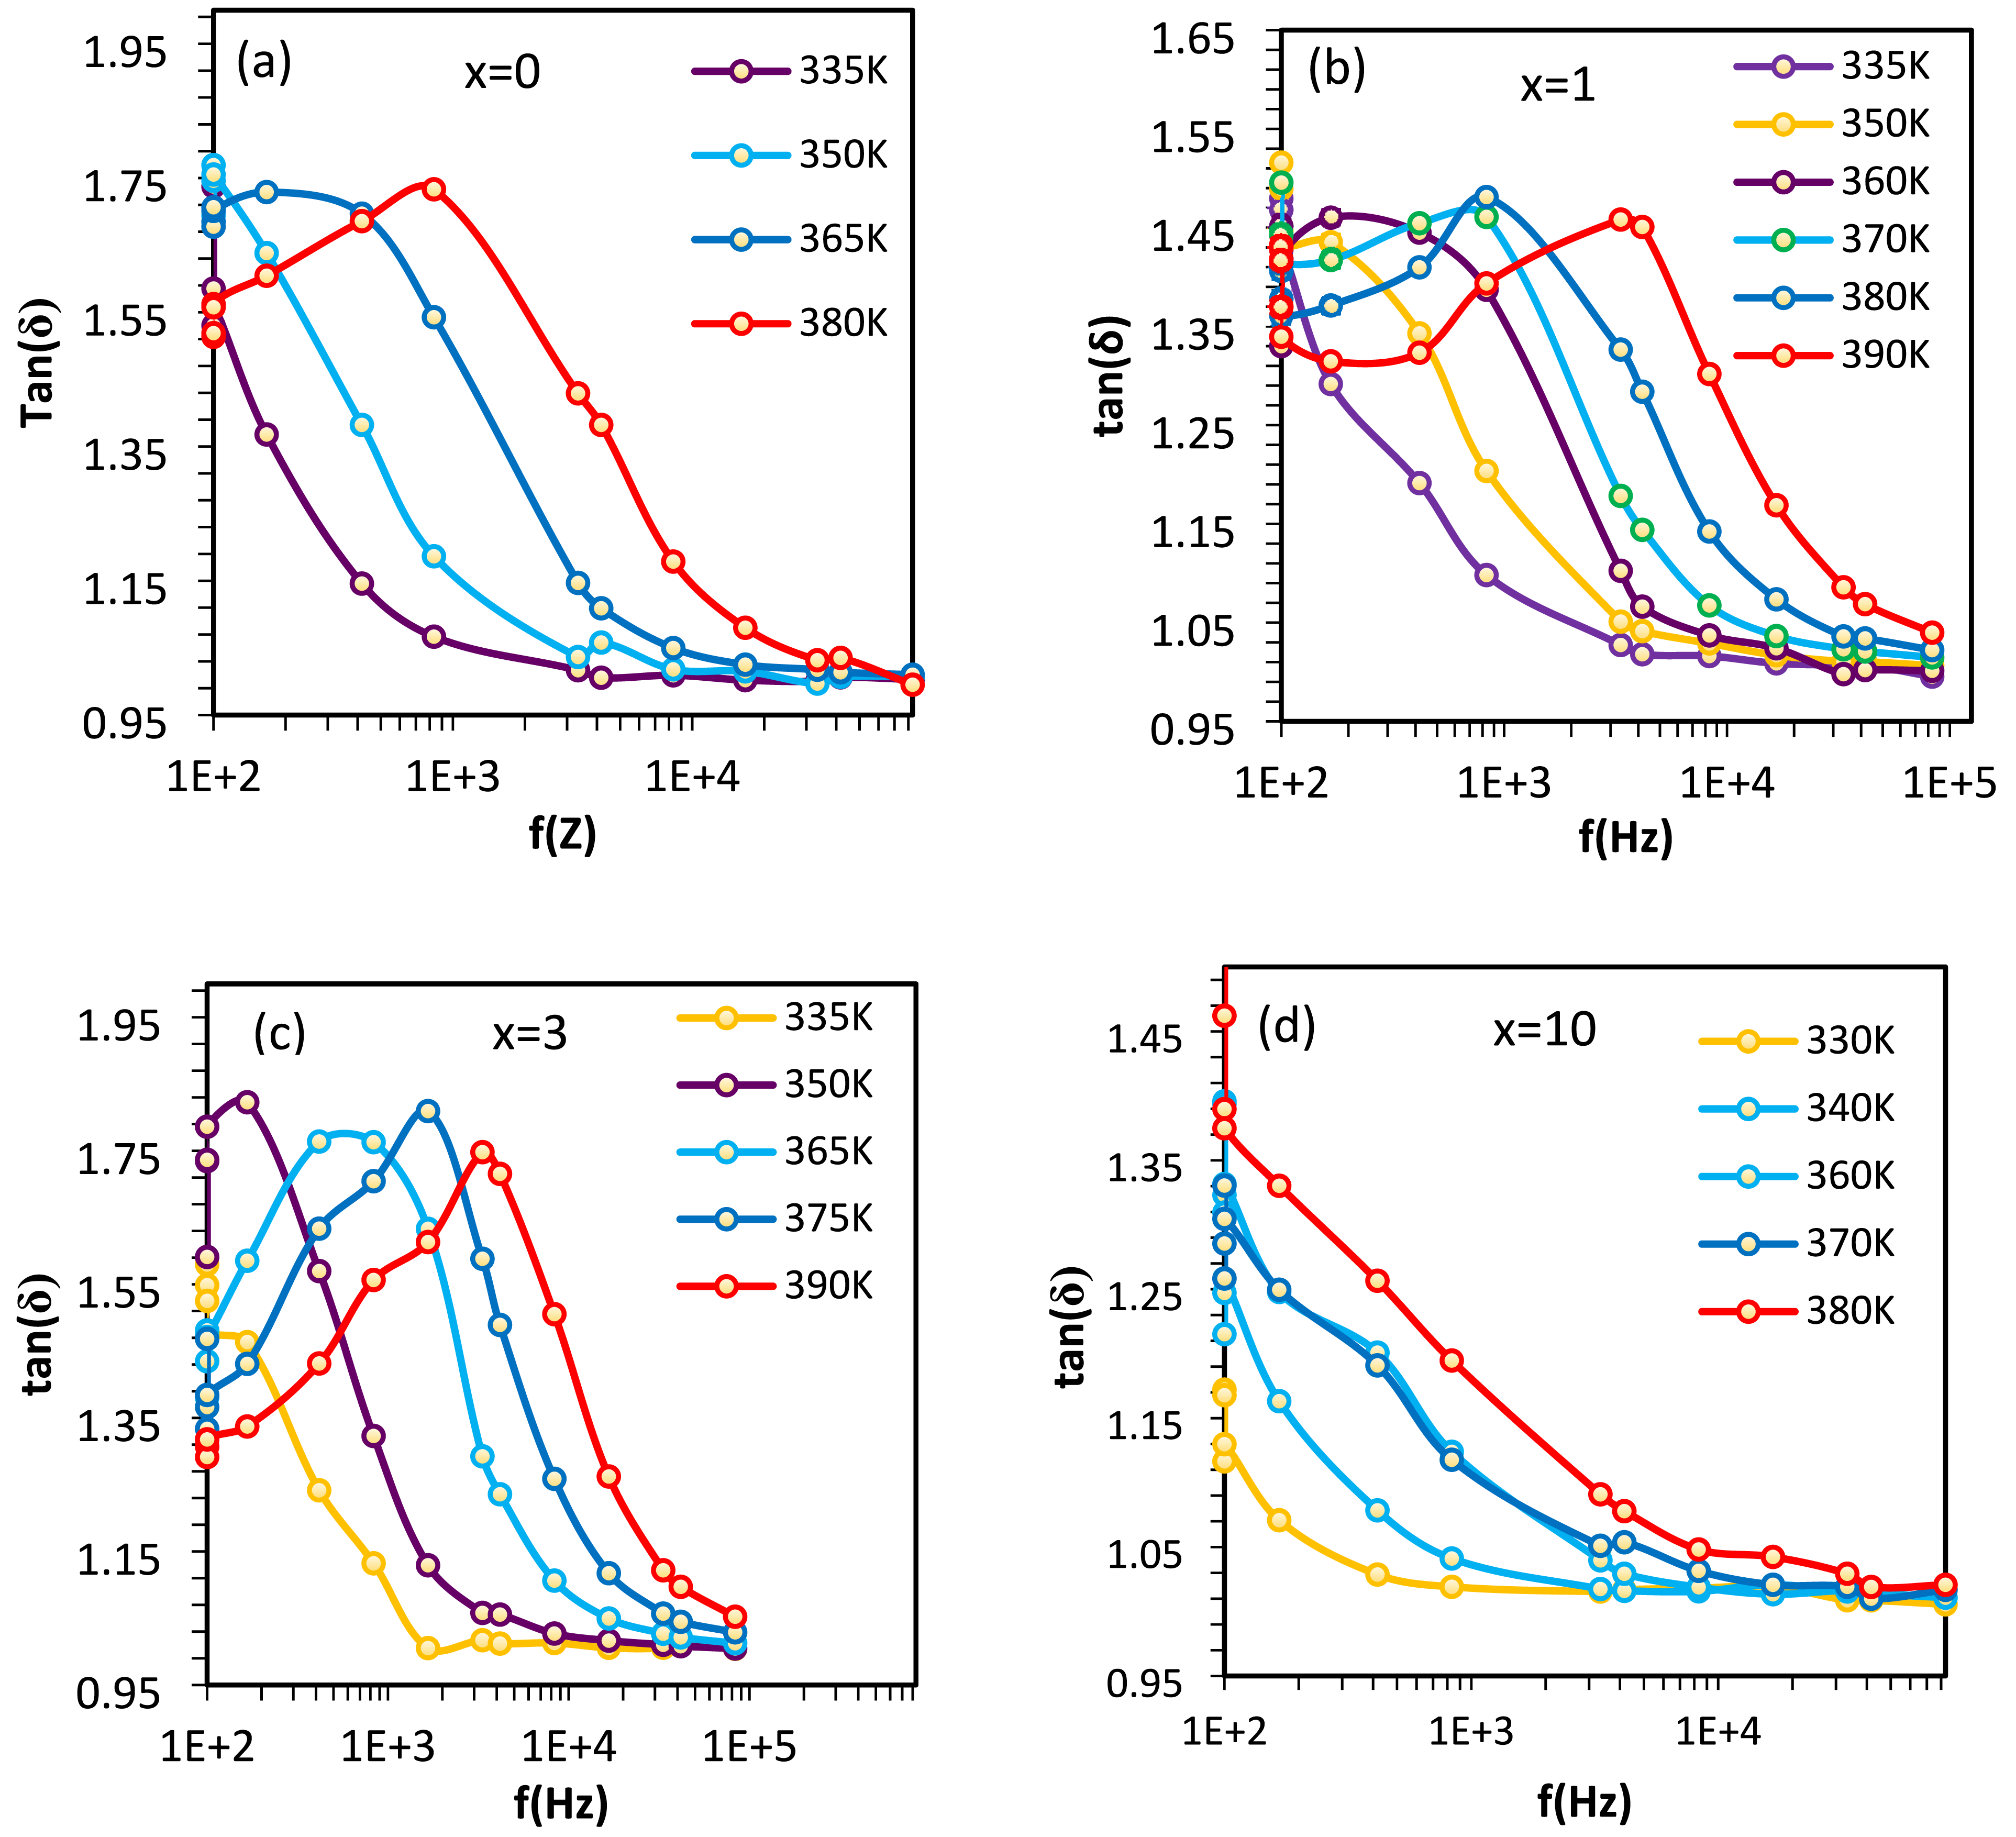
Temperature dependence of tangent loss
The tangent loss is also influenced by temperature, as molecular motion within the CS matrix and charge transport through the HNPs depend on thermal energy. As temperature increases, molecular and ionic mobility within the composite is enhanced, leading to higher tan(δ). This temperature-dependent increase occurs because thermal energy facilitates charge carrier movement and dipole reorientation, intensifying polarization mechanisms and energy dissipation.
Mechanisms contributing to tangent loss
Incorporating HNPs into the CS matrix introduces several mechanisms that contribute to tan(δ); first is the Interfacial Polarization with which the significant difference in conductivity between HNPs (semiconducting) and CS (insulating) creates charge accumulation at the interfaces when subjected to an alternating electric field. This interfacial polarization leads to increased dielectric losses, particularly at low frequencies, where the slower field oscillation allows more time for charge accumulation. The larger the mismatch in conductivity between the two phases, the greater the interfacial polarization and the resulting energy dissipation. 54 Second is the Conduction Losses with which HNPs introduce mobile charge carriers, such as electrons or ions, into the composite. These charge carriers contribute to conduction mechanisms, particularly at lower frequencies, where their movement through the matrix leads to increased energy dissipation. Higher HNP concentrations amplify this effect, as more charge carriers interact with the matrix, increasing the overall tangent loss. Third is the Dipole Relaxation Loss since the incorporation of HNPs creates additional dipole moments through interactions with the CS matrix. When subjected to an alternating electric field, the delayed response of these dipoles to the field oscillation causes relaxation losses. This effect is pronounced at lower frequencies, where dipoles have sufficient time to align with the electric field, resulting in higher energy dissipation. At higher frequencies, the dipoles cannot fully reorient within the rapid oscillations of the field, leading to a decrease in tan(δ).
Role of HNP concentration
The concentration of HNPs significantly affects the magnitude of the tangent loss. At low HNPs concentrations, the impact on polarization and energy dissipation is minimal. However, as the HNPs content increases, the likelihood of charge build-up at interfaces and dipole-dipole interactions grows, leading to higher tan(δ). Interfacial polarization and conduction losses dominate at lower frequencies due to the extended time available for charge migration and dipole alignment. Conversely, at higher frequencies, dipole relaxation becomes the primary mechanism, but the inability of dipoles to fully reorient results in a reduction in tangent loss. 55 The combined effects of these factors demonstrate that HNPs significantly enhance the dielectric response and AC conductivity of the composite, making them a critical component in tuning the dielectric properties of HNPs/CS nanocomposites.
Impedance characteristics and conductivity
Figures 8 and 9 illustrate the frequency dependence of the real (Z′) and imaginary (Z″) parts of impedance for HNPs/CS nanocomposites with varying concentrations of HNPs (x = 0, 1, 3, 10) across different temperatures. These results reveal the intricate interplay between frequency, temperature, and the concentration of HNPs, providing valuable insights into the electrical and dielectric behavior of the composites. Frequency dependence of the real part of the impedance (Z′ (ω)) at various temperatures for HNPs/CS nanocomposites with HNP concentrations of x = 0, 1, 3, and 10 wt.%. Frequency dependence of the imaginary part of the impedance (Z″ (ω)) at various temperatures for HNPs/CS nanocomposites with HNP concentrations of x = 0, 1, 3, and 10 wt.%.

Impact of HNP concentration and temperature on impedance
Pure CS (x = 0) exhibits remarkable impedance stability, with minimal variation across temperature changes. This behavior reflects the intrinsic insulating nature of CS, which resists environmental influences. However, the incorporation of HNPs (x = 1, 3, 10) significantly alters the impedance characteristics. The nanocomposites show pronounced sensitivity to temperature, where both Z′ and Z″ decrease with increasing temperature and HNP concentration. This trend indicates enhanced electrical conductivity due to the introduction of HNPs, which create additional conductive pathways within the CS matrix.
The observed decrease in Z′ and Z″ at elevated temperatures and higher HNP concentrations highlights the synergy between the polymer matrix and the nanoparticles. Enhanced charge mobility and reduced interfacial polarization contribute to this behavior, demonstrating the potential of these nanocomposites for applications requiring improved conductivity and dielectric performance.
Frequency dependence of impedance
At lower frequencies, Z′ and Z″ exhibit complex behaviors, reflecting the interplay of resistive and capacitive effects. The introduction of HNPs enhances the conductive properties of the material, leading to lower impedance values compared to pure CS. In this range, Z″ often displays a peak, signifying a characteristic relaxation frequency. This peak occurs where capacitive and resistive effects balance, indicating the material’s dielectric relaxation process.
As the frequency increases, Z′ decreases, reflecting the enhanced conductivity of the composite materials. The nanoparticles facilitate charge transport, reducing resistance and improving dielectric relaxation. Concurrently, Z″ also declines due to reduced energy dissipation associated with faster relaxation processes at higher frequencies. On a log-log scale, both Z′ and Z″ exhibit negative slopes at high frequencies, indicating the diminishing influence of interfacial polarization and the dominance of intrinsic conductivity mechanisms.56,57,58,59,60,61,62
Nyquist Plot analysis
The relationship between Z′ and Z″ is effectively visualized in the Nyquist plot (Figure 10), where the x-axis represents Z′ and the y-axis represents Z″. For HNPs/CS nanocomposites, the Nyquist plot features incomplete semicircles, indicating a combination of resistive and capacitive behaviors. This non-ideal behavior deviates from a simple resistor-capacitor (RC) circuit model, reflecting the complexity of charge transport and relaxation processes in these materials. Nyquist plot illustrating the complex impedance behavior of HNPs/CS nanocomposites with varying HNP concentrations x = 0, 1, 3, and 10 wt.% at different temperatures.
The size of the semicircular arcs provides key information about the charge transfer resistance at the HNP-CS interface. A smaller semicircle corresponds to lower resistance, signifying more efficient charge transport. Among the nanocomposites, the x = 3 sample shows the smallest semicircular arc, indicating the lowest resistance and the highest ionic conductivity. This behavior underscores the role of HNPs in facilitating electron transfer and reducing bulk resistance, which is crucial for applications in energy storage and electrochemical sensing. 63
DC conductivity
The DC conductivity (σdc) of the nanocomposites is calculated using the equation: σdc = t/RB⋅A, where t is the thickness of the polymer film, A is the electrode area (m2), and RB is the bulk resistance obtained from the Nyquist plot. At 350 K, the calculated ionic conductivities (σdc) for x = 0, 1, 3, and 10 nanocomposites are 6.16 × 10⁻⁸, 8.49 × 10⁻⁸, 1.82 × 10⁻⁸, and 1.37 × 10⁻⁷ respectively. These results reveal a clear trend where pure CS (x = 0) exhibits the lowest ionic conductivity, while the x = 3 sample achieves the highest conductivity. The improved conductivity for x = 3 is directly attributed to its lowest bulk resistance value, reflecting optimal nanoparticle dispersion and interaction within the matrix.64–66 The incorporation of HNPs into CS significantly enhances the impedance and conductivity properties of the nanocomposites. The decrease in Z′ and Z″ with increasing HNP concentration and temperature reflects improved charge mobility and reduced resistance, particularly in the x = 3 sample. The Nyquist plot analysis further highlights the interplay between resistive and capacitive behaviors, emphasizing the role of HNPs in reducing interfacial resistance and enhancing dielectric performance. These findings demonstrate the potential of HNPs/CS nanocomposites for advanced applications in energy storage, sensing, and other fields requiring optimized electrical properties.
Figure 11 demonstrates the relationship between AC conductivity (σ
AC
) and angular frequency, along with the corresponding curves fitted to Jonscher’s law for various temperatures and weight percentages for HNPs/CS nanocomposites, x = 0, 1, 3, and 10. The data clearly show that adding HNP to CS significantly impacts the frequency and temperature dependence of σAC. A notable increase in σ
AC
is observed, particularly for the x = 3 nanocomposites. At lower frequencies, the σ
AC
curves exhibit a slight rise in conductivity, which can be attributed to electrode polarization caused by charge accumulation at the electrode/sample interfaces (first domain). As the frequency increases, this effect diminishes, resulting in a relatively constant σ
AC
, corresponding to the long-range motion of charge carriers.67–69 The frequency dependence of AC conductivity of HNPs/CS nanocomposites with varying HNP concentrations x = 0, 1, 3, and 10 wt.% at different temperatures.
According to Jonscher’s law, represented by the power law (Aωs) (eq. (3)),
70
σAC increases significantly as the frequency continues to rise, marking the third domain.

Here, ω represents the angular frequency, T is the absolute temperature, σDC denotes the DC conductivity, A is the proportionality coefficient, and s is the power law exponent. The σDC values were obtained as fitting parameters and plotted as a function of temperature, as shown in Figure 12(a). In Jonscher’s law, the parameter s represents a material’s static or high-frequency dielectric constant. It’s crucial because it quantifies how well a material can store electrical energy when subjected to an electric field. This parameter is particularly significant in understanding the electrical behavior of materials, especially in applications involving capacitors, dielectrics, and electronic components where the storage and transmission of electrical energy are critical. Plotting the relationship between ln(σ
DC
) and ln(ω) provides the estimated exponent s for all samples as a function of temperature. The observation that s is less than one and decreases with increasing temperature (Figure 12(b)) suggests that the conduction mechanism in the studied nanocomposites follows the correlated barrier hopping (CBH) model.
71
Temperature dependence of the DC conductivity (σDC) (a), the exponent parameter S (b), and 1/T(K) versus Ln (σ
DC
) (c) of HNPs/CS nanocomposites with varying HNPs concentrations (x = 0, 1, 3, and 10 wt.%).
To estimate the activation energy of DC conductivity, ln (σDC) was plotted against (1/T) following the Arrhenius equation, as illustrated in Figure 12(c):

Ea is the activation energy, kB = 8.62 × 10⁻⁵ eV/K is the Boltzmann constant, T is the absolute temperature, and σ0 is the pre-exponential factor. The activation energy of DC conductivity is 0.99, 0.58, 0.53, and 0.58 eV for the HNP/CS nanocomposites with x = 0, 1, 3, and 10, respectively, which aligns with the activation energy for ionic conduction. 34 The incorporation of HNPs lowers the activation energy and enhances ionic conductivity. This improvement is attributed to HNPs reducing the crystallinity of the CS matrix, thereby increasing the free volume and facilitating greater charge carrier mobility. 72
The Guintini model is widely used to calculate the maximum barrier height (Wm) from dielectric measurements, linking dielectric properties to the energy required for charge carriers to overcome potential barriers. The model is expressed as:

Incorporating hematite nanoparticles (HNPs) into the CS matrix significantly reduces (Wm), particularly at (x = 3), where the barrier height drops to 0.13 eV, compared to 0.42 eV for pure CS. This reduction is attributed to the disruption of the CS crystalline structure, enhancing conductivity. These findings highlight (x = 3) as the optimal concentration for superior electrical performance, reinforcing the role of HNPs in improving CS-based nanocomposites’ conductivity.73–78
Conclusions
The successful incorporation of hematite nanoparticles (HNPs) into the chitosan (CS) matrix at varying weight percentages (x = 0, 1, 3, and 10) has led to significant enhancements in the nanocomposites’ mechanical, and electrical properties. Fourier-transform infrared spectroscopy (FTIR) confirmed effective integration of HNPs, while differential scanning calorimetry (DSC) revealed a notable increase in glass transition temperature (T g ) from 121°C for pure CS to 132°C for x = 3 nanocomposites. Mechanical testing showed a substantial improvement in elastic modulus, increasing from 1.67 GPa to 2.34 GPa, and a threefold rise in tensile strength for x = 3 nanocomposites. Dielectric properties demonstrated enhanced ionic conductivity, particularly at x = 1 and 3, as evidenced by increased dielectric constants and reduced Nyquist plot diameters. Impedance spectroscopy revealed improved ionic transport, with activation energy decreasing from 0.99 eV for pure CS to 0.53 eV for x = 3 nanocomposites. Furthermore, the maximum barrier height dropped from 0.42 eV to 0.13 eV, and conduction aligned with the correlated barrier hopping (CBH) model, supported by S parameter analysis. These improvements are attributed to the strategic incorporation of HNPs, which facilitate ion dissociation and create efficient conducting channels within the matrix. The exceptional performance of the x = 3 nanocomposite demonstrates its potential for applications demanding high thermal stability, enhanced mechanical strength, and superior ionic conductivity, marking it as a promising material for advanced technological applications.
Footnotes
Acknowledgements
The authors thank Taif University, Saudi Arabia, for supporting this work through project number (TU-DSPP-2024-90).
Author contributions
Emad M Ahmed: Supervise, Validate, Conceptualize, prepare materials, collect and analyze data, Write, review, and Edit. Nasser Y Mustafa: Material preparations.
Declaration of conflicting interests
The author(s) declared no potential conflicts of interest with respect to the research, authorship, and/or publication of this article.
Funding
The author(s) disclosed receipt of the following financial support for the research, authorship, and/or publication of this article: This research was funded by Taif University, Saudi Arabia, Project No. (TU-DSPP-2024-90).
Data availability statement
Data will be available upon the author’s request.