
Abstract
Polyurethane elastomers (PU) are used in various applications, such as wind turbine blades, to safeguard structural integrity, maintain shape, and enhance survivability under repeated impact loading from rain droplets and sand particles. This study investigates the impact of individual and combination of additive carbon nanotubes, graphene, and fumed nanosilica nanomaterials, totalling 0.3 wt% loading to PU, on water uptake capacity and any adverse effect on mechanical properties after exposure to saturation. Alongside the control pure PU, five types of PUs with varying additive nanomaterial types and contents are examined. Experimental measurements of the temperature-dependent moisture absorption, diffusion coefficients and permeabilities for the pure PU and its nanocomposites are conducted at 22°C, 32°C, and 45°C. In addition, uniaxial tensile tests were conducted on both dry and water-saturated coatings, and their mechanical properties were compared. Physicochemical characterisation of the coating materials is performed using the Fourier-transform infrared spectroscopy (FTIR), thermogravimetric analysis (TGA), and dynamic mechanical analysis (DMA) techniques. Water contact angle (WCA) and surface free energy measured. Morphological features of fracture surfaces are studied by scanning electron microscopy (SEM) and optical microscopy.
Introduction
Polyurethanes (PU) serve as protective coating materials due to their numerous advantages, such as high impact strength, high elasticity, elongation before failure, abrasion resistance, and tear resistance. 1 This study focuses on investigating the performance of nanomodified polyurethane coatings when exposed to water. Previous research has examined the protective performance of polyurethane coatings subjected to water diffusion and analysed the causes of failure.2–5
Polyurethanes are typically synthesized by the reacting of a polyol with a diisocyanate, resulting in a structure containing soft block segments (polyols) and hard segment (diisocyanate). The elastomeric behaviour of PU arises from the microphase separation of these segments. The soft segment provides high ductility, while the hard segments reinforce the elastomeric matrix. Consequently, the properties of PU are influenced by the chemical composition and relative sizes of these segments. 6 PUs exhibit outstanding corrosion and abrasion resistance, strong adhesion, and excellent flexibility.
Polyurethane coatings are exposed to water in various applications, such as wind turbine blades, leading edges of aircrafts wings, food packaging, pharmaceuticals, and polymeric multilayer films for the encapsulation of flexible electronics. Water diffusion in these coatings is particularly concerning because it can lead to delamination from substrates such as glass fibre reinforced polymer (GFRP) in wind turbine blades and aluminium alloys in aircraft. Furthermore, understanding the kinetics of water diffusion and the distribution of water within the polymer coating is crucial for predicting the long-term mechanical behaviour of the coatings. Water uptake can deteriorate the mechanical performance of the polymer coating as well as increase the weight of the structure, potentially affecting its structural integrity.
The mechanical properties of PU 7 and modified PU elastomers with carbon nanotubes (CNTs) and graphene have been extensively investigated by researchers, such as referenced in4,5,8. Guo, et al. 9 conducted a study where multiwalled carbon nanotube (MWNT)/polyurethane nanocomposites have been prepared by the combination of in situ polymerization and solution-casting approach. Similarly, Nguyen et al. 10 modified thermoplastic polyurethane (TPU) with functionalised graphene sheet by an in situ polymerisation method. They observed that there were significant enhancements in modulus and deterioration in tensile strength and elongation at break as a result of incorporating graphene sheets. In addition, efforts have been made to comprehend the influence of water on the mechanical properties of PU elastomers. 11 Moreland et al. 12 reported that exposure of PU coatings to water leads to water acting as a plasticizer by forming hydrogen bonding sites with soft segments, consequently deteriorating mechanical properties. They also investigated the effects of temperature and moisture on the stress relaxation behaviour of PU elastomer foams, revealing that water molecules act as a plasticizer, facilitating local chain slippage. Haddar, et al., 13 investigated the effects of weight fraction of natural waste fibre obtained from marine biomass such as Posidonia oceanica (POF) and matrix type on the mechanical properties and water absorption behaviour of the produced composites. Their findings indicated that all composites exhibited a Fickian diffusion mechanism, initially linear and reaching saturation level after a prolonged time. Furthermore, attempts have been made to enhance the self-healing capability of PU under water in low-temperature environments by introducing multi-strength hydrogen bonds into the hard segment of the polyurethane and incorporating dynamic disulfide bonds. 14 Therefore, understanding the effect of water absorption on the microstructures and macroscopic properties of PU holds significant practical importance.
In this study, we present the detailed methodology for determining the water diffusion coefficient of the polyurethane (PU) and PU nanocomposites modified with graphene, carbon nanotubes, and fumed nanosilica, either as individual additive nanomaterials or a combination of additive nanomaterials, at three different temperatures: 22°C, 32°C, and 45°C. The time-dependent concentration of water in the coatings was predicted using a Fickian diffusion modelling approach. The experimental results were analysed using the Fickian diffusion law to calculate the diffusion coefficients and permeabilities of PU and various nanomodified PU at the three temperatures. In addition, uniaxial tensile tests were conducted on both dry and water-saturated materials, and their mechanical properties were compared. Physicochemical characterisation of the coating materials is performed using the Fourier-transform infrared spectroscopy (FTIR), thermogravimetric analysis (TGA), and dynamic mechanical analysis (DMA) techniques. Water contact angle (WCA) and surface free energy measured. Morphological features of fracture surfaces are studied by scanning electron microscopy (SEM) and optical microscopy.
Materials and methods
Materials
The manufacture of PU was conducted using polyether polyol (BAYTEC CG9 9005 60A MF) and diphenylmethane isocyanate (MDI) with trade name DESMODUR B9M10 both supplied by Covestro Company. The graphene nanoplatelets (GNP) were functionalised HDPlasTM GNP-COOH provided by Haydale Graphene Indus with average lateral dimensions between 1 and 3 μm and an average of 6 to 8 layers per flake. The GNP particles contained surface carboxyl groups generated by a “split plasma functionalization process in oxygen” and hereafter it will be referred to as GNP. 15 The GNPs utilised were commercial and in our previous work, 16 the results of X-ray diffraction (XRD), Raman spectra, and X-ray Photoelectron Spectroscopy (XPS) analysis for this GNP was reported. It should be mentioned that the XRD analysis showed the primary (002) peak occurring at ∼26.70°, corresponding to an interlayer spacing of ∼0.34 nm, and the (004) peak occurring at 54.60°. NC7000TM multi-walled carbon nanotubes (MWCNT) are produced via the Catalytic Chemical Vapor Deposition (CCVD) process with an average diameter of 9.5 nm and an average length of 1.5 μm with surface area of 250-300 m2/g were provided by NANOCYL and hereafter are referred to as CNT. Amorphous fumed nanosilica, with specific area of 130-170 m2/g, density of 2.2 g/mL and molecular weight of 60.08 g/mol was supplied by Alfa Aesar. All materials were used as received.
Compounding of polyurethane and polyurethane nanocomposites
The processing of PU and PU nanocomposites are described below.
Processing of base polymer PU
The polyether polyol was mixed with diphenylmethane isocyanate (MDI) at 100:37 weight ratio. The mixture was stirred at 200 rpm using a mixing pad rotating inside an MK Technology MK-Mini vacuum chamber for 3 min which was equipped with a Leybold single stage oil sealed rotary vane vacuum pump SOGEVAC SV25 with nominal pumping speed of 25 m3.h−1 and ultimate total pressure of
Processing of PU nanocomposites with individual additive nanomaterial
PU + GNP and PU + SiO2: polyether polyol (100 g) was stirred with GNP (0.41 g) or SiO2 (0.41 g) for 18 minutes at 8000 rpm using a homogeniser, MDI (37 g) was added to the mixture inside MK-Mini vacuum chamber and stirred for another 3 min with a mechanical mixing pad at 200 rpm to give 0.3 wt% GNP or 0.3 wt% SiO2 polyurethane nanocomposite.
Processing of PU nanocomposites with a combination of additive nanomaterials
PU + GNP + CNT: polyether polyol (100 g) was stirred with GNP (0.21 g) or CNT (0.21 g) for 18 minutes at 8000 rpm using a homogeniser, MDI (37 g) was added to the mixture inside MK-Mini vacuum chamber and stirred for another 3 min with a mechanical mixing pad at 200 rpm to give 0.15 wt% GNP +.15 wt% CNT PU nanocomposite.
PU + GNP + SiO2 and PU + CNT + SiO2
polyether polyol (100 g) was mixed with SiO2 (0.21 g) and GNP (0.21 g) or CNT (0.21 g) for 18 minutes at 8000 rpm using a homogeniser, then MDI (37g) was added to the mixture inside MK-Mini vacuum chamber and stirred for another 3 min with a mechanical mixing pad at 200 rpm to give 0.15 wt% SiO2 + 0.15 wt% GNP or 0.15 wt% SiO2 + 0.15 wt% CNT PU nanocomposites.
Tensile testing
Tensile tests were conducted on dry and water-saturated pure PU and PU nanocomposites at a speed of 30 mm/min using an HTE Hounsfield universal testing machine equipped with a 10 kN load cell and equipped with a built-in extensometer. The dimension of the specimen was according to ASTM D412 standard C-type with gauge length of 25 mm, a width of 6 mm in the gauge interval and thickness of 3 mm. The tests were conducted until the specimens ruptured.
Characterisation methods
Thermogravimetric analysis (TGA)
A TA 550™ Thermogravimetric analyser (TGA) was used for thermal stability and weight loss studies. The experimental conditions were 3.5-5.5 mg sample size, 10°C/min heating rate from 20°C to 600°C.
Fourier-transform infrared spectroscopy analysis
ATR-FTIR spectroscopy of PU and PU nanocomposites was performed in the wavenumber range from 4000 to 500 cm−1 at a resolution of 4 cm−1 using a Thermo Nicolet iS5 FTIR spectrophotometer at room temperature. The Attenuated Total Reflectance (ATR) unit attached to the spectrometer was cleaned with ethanol and a cloth. Both pure PU and modified PU specimens were exposed to IR radiation in the FTIR spectrometer to analyse their chemical properties and various types of bonding within their structure.
Dynamic mechanical analysis
Mettler Toledo DMA 1 Dynamic Mechanical Analysis (DMA) was used in dual cantilever mode at a fixed frequency of 1 Hz and a heating rate of 3°C/min to evaluate the impact of various nanofillers on the viscoelastic properties, such as storage modulus, loss modulus, and loss factor, of PU nanocomposites over a temperature range from −80°C to 50°C. The glass transition temperature (Tg) and damping factor of each PU nanocomposite were determined. Liquid nitrogen was used for cooling the specimens, and the tests were performed in an air environment. The measurement point for Tg was taken from the peak of the
Scanning electron microscopy (SEM)
The surface morphology of the fracture surfaces of tensile specimens after rupture was observed using a ZEISS Crossbeam 550 Scanning Electron Microscope (SEM). The SEM specimens were obtained by cutting samples from the fractured area, and pressurised air and ethanol were used to remove debris or unwanted external objects from the fracture surfaces. The fracture surface side of the specimens was coated with a thin layer (10-15 nm) of carbon to prevent electrical charge accumulation and to enhance contrast, as the surfaces were non-conductive. All the SEM specimens were mounted on stubs using carbon tape, and the images were taken at an accelerating voltage of 25 kV and at different magnifications.
Water contact angle and surface free energy
Water contact angle (WCA) provide valuable information on the wettability of a surface. To study the change in the surface amphiphilicity, the static deionised (DI) water contact angle (WCA) for PU and PU nanocomposites were measured using DSA30 Kruss drop shape analyser. The measurements were taken 2s after a 5 μL DI water droplet, ejected from a micro syringe, touched the surface of the material.
Accelerated water aging tests
Accelerated water ageing of pure PU, and various PU nanocomposites was performed in a water bath at room temperatures 22°C and at elevated temperatures of 32°C and 45°C.
Water absorption specimens were prepared according to ASTM standard D570 using an aluminium mould manufactured by CNC machining of an aluminium plate. This allowed the manufacture of cylindrical specimens with a diameter of 50.8 mm and a thickness of 3.2 mm. The processed PU and modified PU, which were mixed in MK-Mini vacuum chamber, were then cast in a preheated aluminium mould at 50°C.
To study the effect of mixing polyol, MDI, and nanomaterials inside the vacuum chamber on the water absorption rate, samples were prepared by mixing under ambient atmosphere conditions and under vacuum within the MK-Mini vacuum chamber. After preparation, samples were conditioned in an oven at 50°C for 24 h, allowed to cool to room temperature for 30 minutes in a desiccator and the specimen’s dry mass was recorded (
The water absorption tests were carried out over a month at three temperatures: 22°C (room temperature, RT), 32°C, and 45°C. For the room temperature tests, three degassed and three undegassed specimens were placed in a plastic container of water. The water temperature was maintained at 22°C using an aquarium heater equipped with a temperature sensor. For the tests at 32°C and 45°C, six specimens from each material (three degassed and three undegassed, except for the PU+GNP+SiO2 and PU+CNT+SiO2 materials, for which only three degassed samples were prepared) were immersed in glass bottles filled with water. These bottles were then placed in an electric urn tank, partially filled with water. The urn’s thermostat could control the temperature in the range of 20°C to 110°C. For safety, an external thermostat was also used to automatically cut off electricity to the urn if the temperature exceeded the set upper limit. Figure 1(a) and (b) shows this setup. (a) The stainless-steel urn tank with internal temperature controller and the external thermostat for cutting off electricity, (b) Glass bottles with the water submerged specimens inside the urn tank.
To measure the water uptake of each specimen at any time interval, the specimen was taken out of the tank, gently dried using a fabric cloth, and weighed in order to calculate water uptake per gram of the specimen.
Water diffusion in polyurethane
The diffusion of water in polymers has been widely studied and was mathematically described by Fick in 1855
17
According to Fick’s theory, the driving force for diffusion is the difference in water concentration, with water diffusing solely through the micro-pores of polymers. Fick used the heat conduction equations and developed the one-dimensional diffusion equation
18


For a polymer submerged at


The water uptake concentration at any time

The water concentration

Shen and Springer
18
simplified equation (5) for two scenarios: short and long immersion times. Assuming a dry sample at

Therefore

In the second scenario, when

For Fickian diffusion, the variation of
The sorption coefficient can be calculated using equation (9)

The permeability coefficient can be expressed as in equation (10).
25

The above equations can be used for accelerated ageing tests, allowing determination of the Fickian diffusion constant, D, for polyurethane in several months rather for a long-term aged state of several years or decades. The water aging at higher temperature accompanies activation of other degradation mechanisms that will not occur at lower temperatures.
Results and discussion
Thermogravimetric results
Thermogravimetric analysis (TGA) was performed to investigate the thermal stability of polyurethane nanocomposites. Figure 2 shows TGA and the corresponding first derivative of the weight loss (DTG) thermogram of the PU and the nanomodified PU nanocomposites. The TGA curve demonstrates two distinct regions of weight loss, which correspond to the two decomposition peaks in the DTG thermogram. At early stages of thermal degradation, up to 280°C, the initial weight loss observed in the TGA curve is related to the loss of volatiles and the breakup of weaker bonds before the main thermal decomposition of the polymer matrix begins. These volatiles include adsorbed water (around 100°C), low molecular weight volatile such as solvents, and small molecular fragments that were not fully reacted during the polymerisation process (around 200°C). In addition, the breakup of weaker bonds such as hydrogen bonds and low-energy chemical bonds between phases of segmented polyurethane contribute to this initial weight loss. The weight loss between 280°C and 410°C can be attributed to the thermal degradation of the polyurethane and the decomposition of chemically bonded groups such as hydroxyl, ethoxy groups, and polyether segments on the surfaces. TGA and DGA curves for pure PU and PU nanocomposites.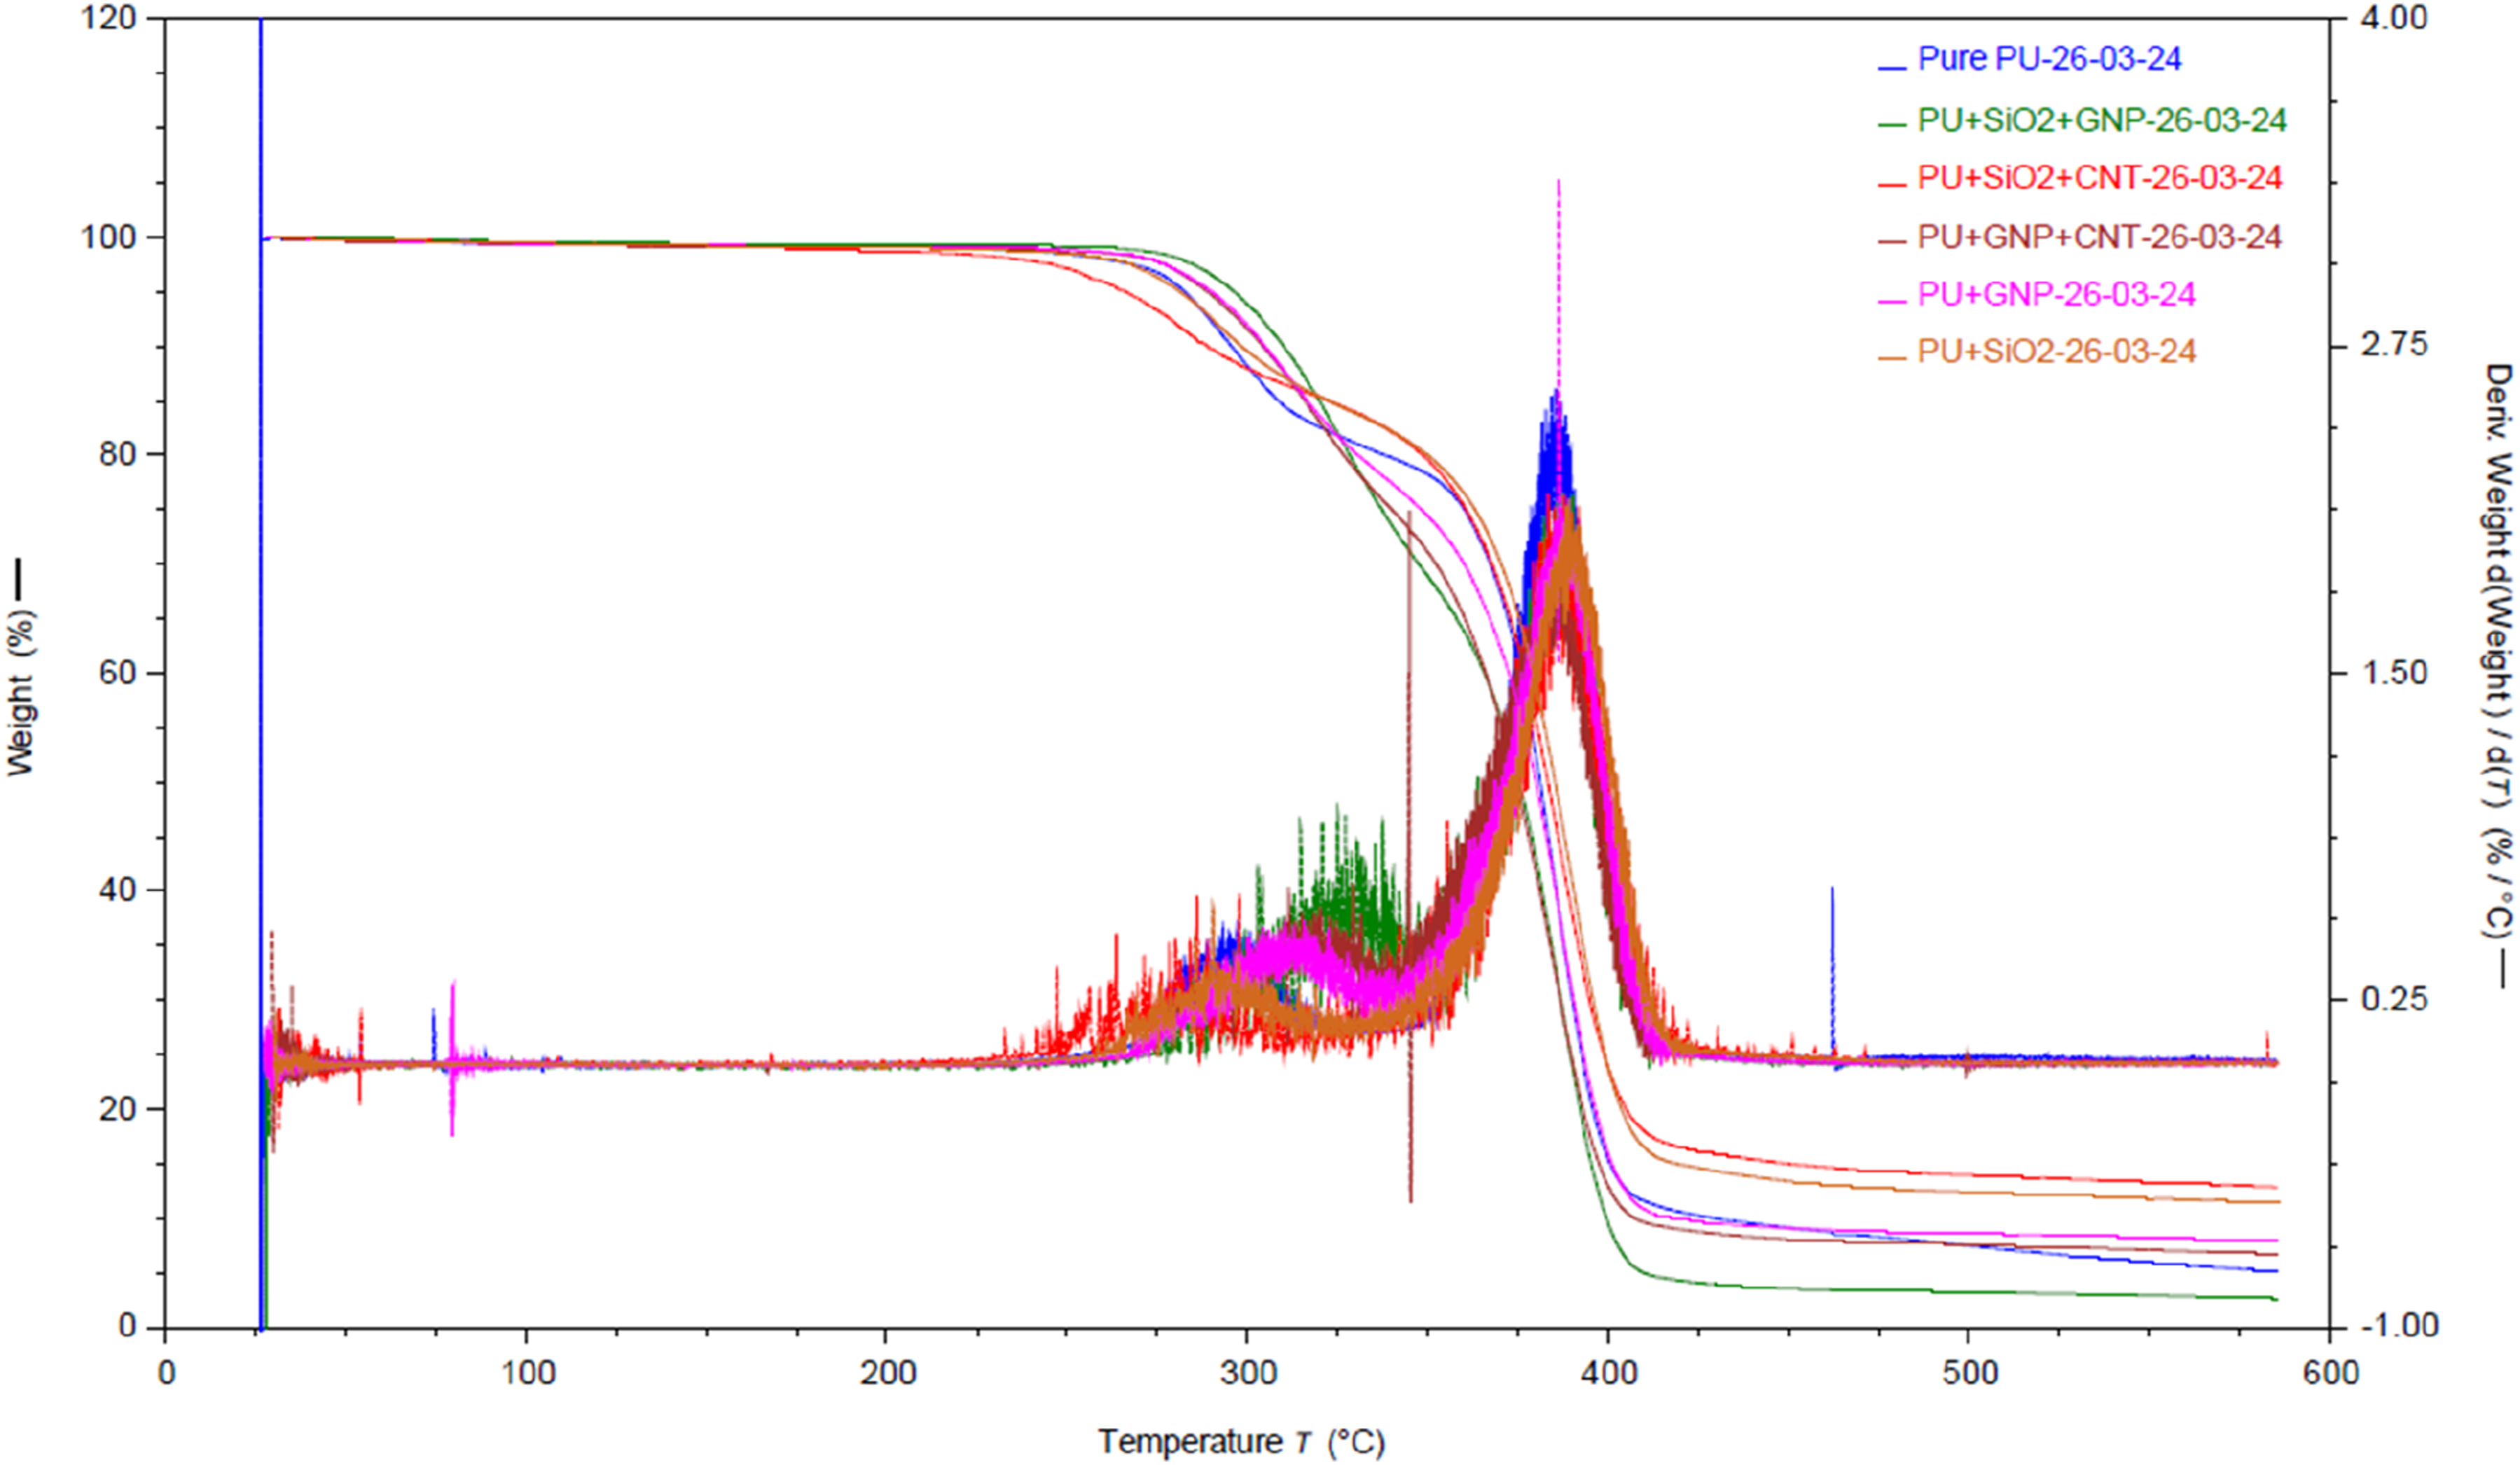
Polyurethane elastomers are composed of alternately dispersed hard and soft segments, the hard segments are degraded first, followed by the decomposition of the soft segment as temperature rises similar to what reported by. 26 The soft segments of the pure PU and five types of nanomodified PU are composed of high percentage of polyether polyols. 27 Therefore, the discrepancies in the degradation temperature of the soft segment are small and this is caused as all nanomodifed PU are structurally close and have the same soft segment structure.
Characteristic parameters of PU determined by TGA and DTG.

T5, T15, and T50 are temperature at 5%, 15% and 50% weight loss.
Fourier-transform infrared spectroscopy results
Figure 3 show the FTIR spectra results for pure PU and all PU nanocomposites. The results show that there is no noticeable difference in spectra among pure PU and PU nanocomposites. This consistent behaviour across all materials is due to the high percentages of PU in the nanocomposite structures (99.7 wt%). This is also an evidence suggesting effective incorporation and homogenous dispersion of GNP, CNT, and SiO2 within the PU matrix. However, PU+GNP+CNT showed a noticeable deviation in the fingerprint region (500-750 cm−1), distinguishing it from other PU nanocomposites. This deviation might be attributed to incomplete incorporation of GNP and/or CNT into the PU matrix. Characteristic vibration peaks attributed to key functional group of PU and its modified nanocomposites are: those related to N-H stretching and O-H stretching at 3200-3400 cm⁻1, C-H stretching at 2800-3000 cm⁻1, N-H bending at 1530 cm⁻1, C = O stretching at 1700-1750 cm⁻1, and C-O stretching at 1000-1300 cm⁻1. These characteristic peaks in the FTIR spectrums confirm the presence of polyurethane and its functional groups in the examined PU and PU nanocomposites. Shifted overlay of ATR-FTIR spectral for pure PU and all PU nanocomposites.
Dynamics mechanical analysis results
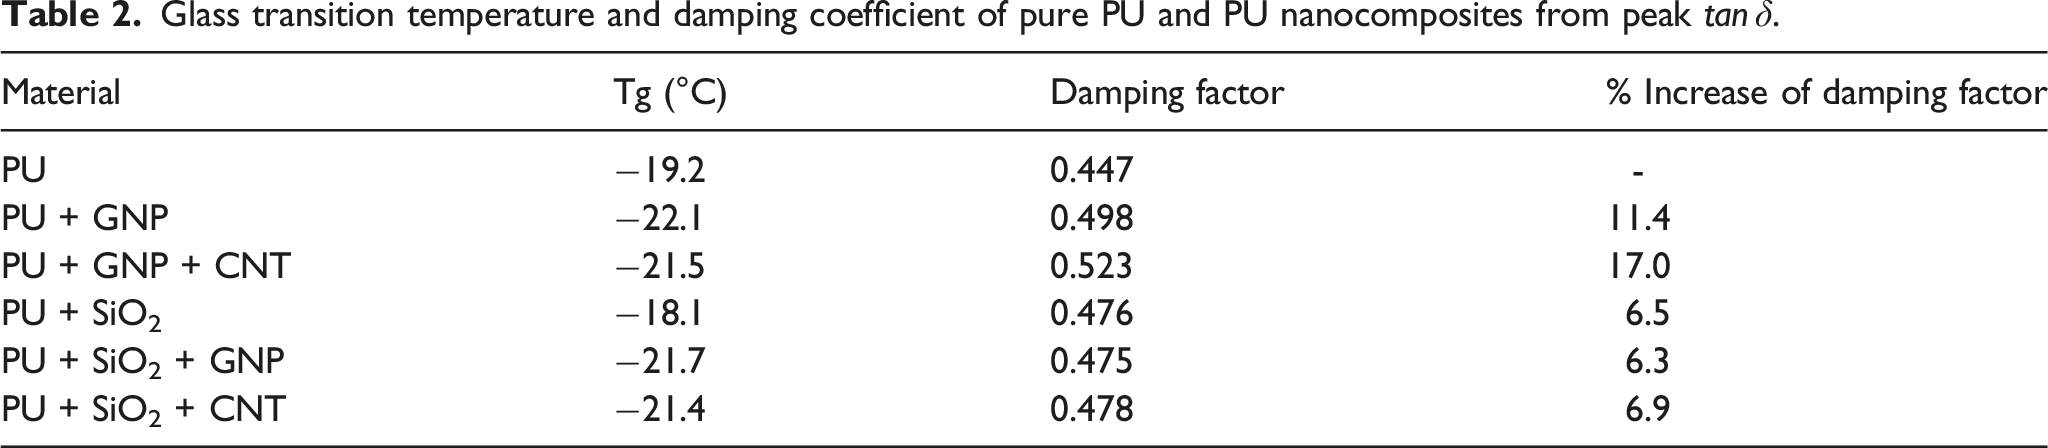
The results of storage modulus and Variation of storage modulus versus temperature for all PU nanocomposites. Variation of Glass transition temperature and damping coefficient of pure PU and PU nanocomposites from peak 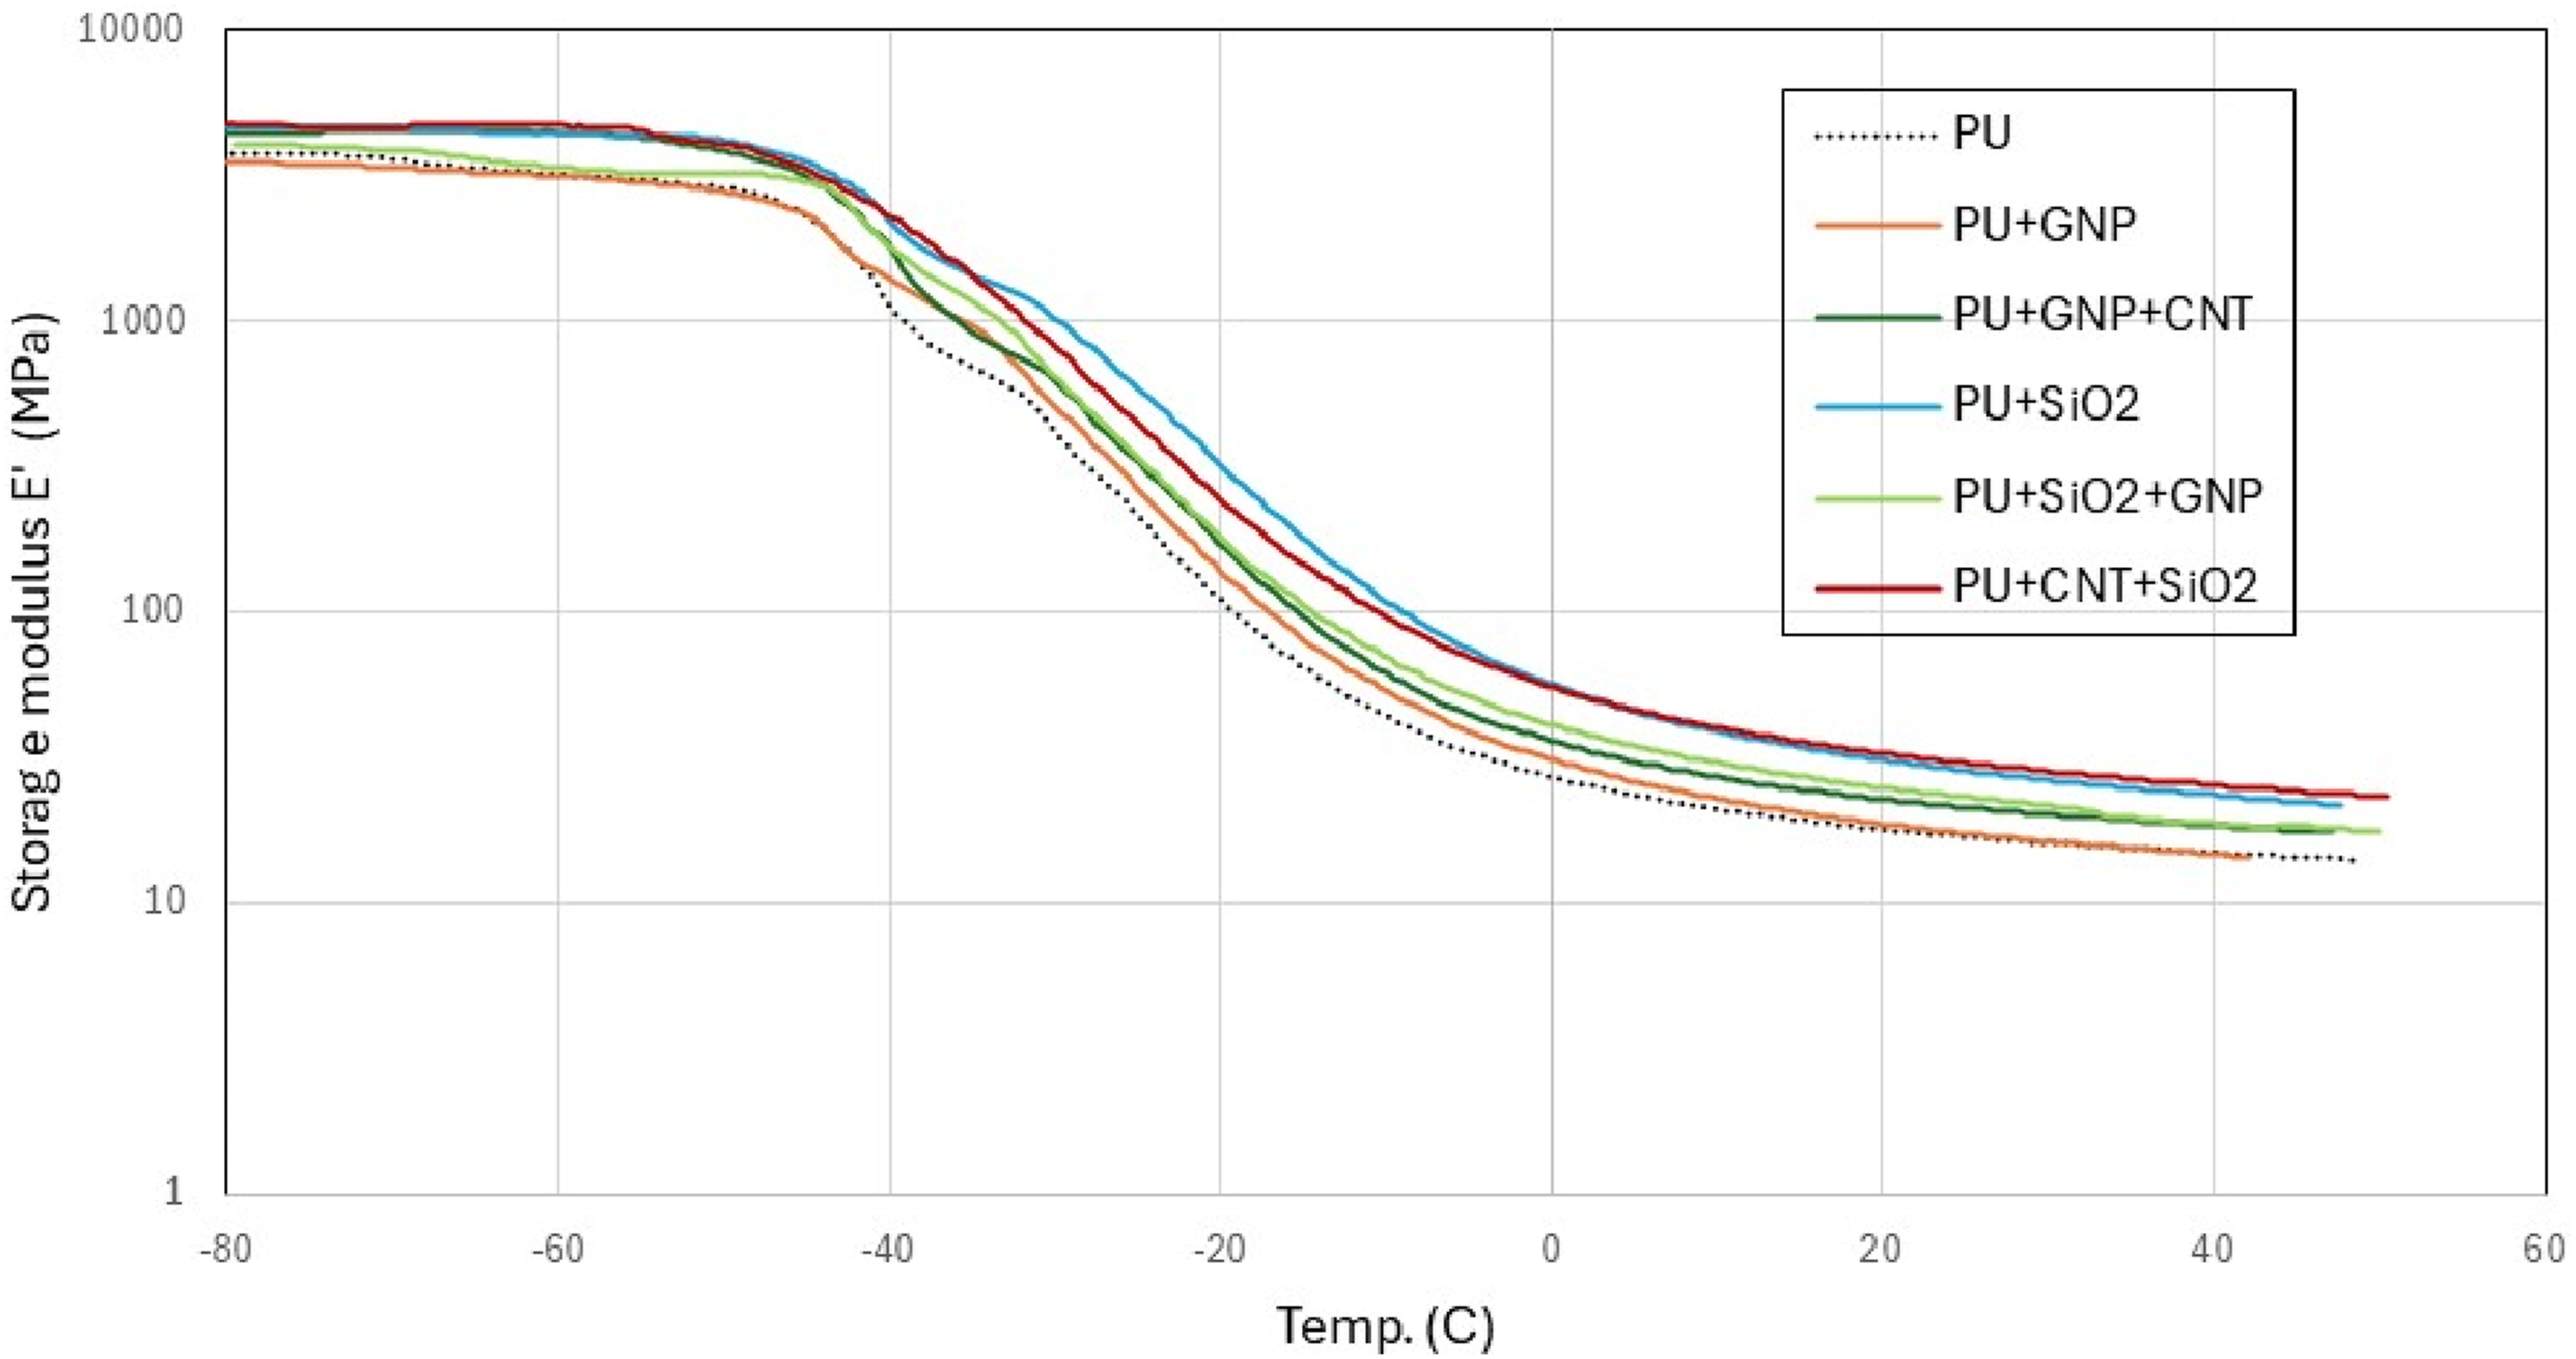

Water contact angle and surface free energy
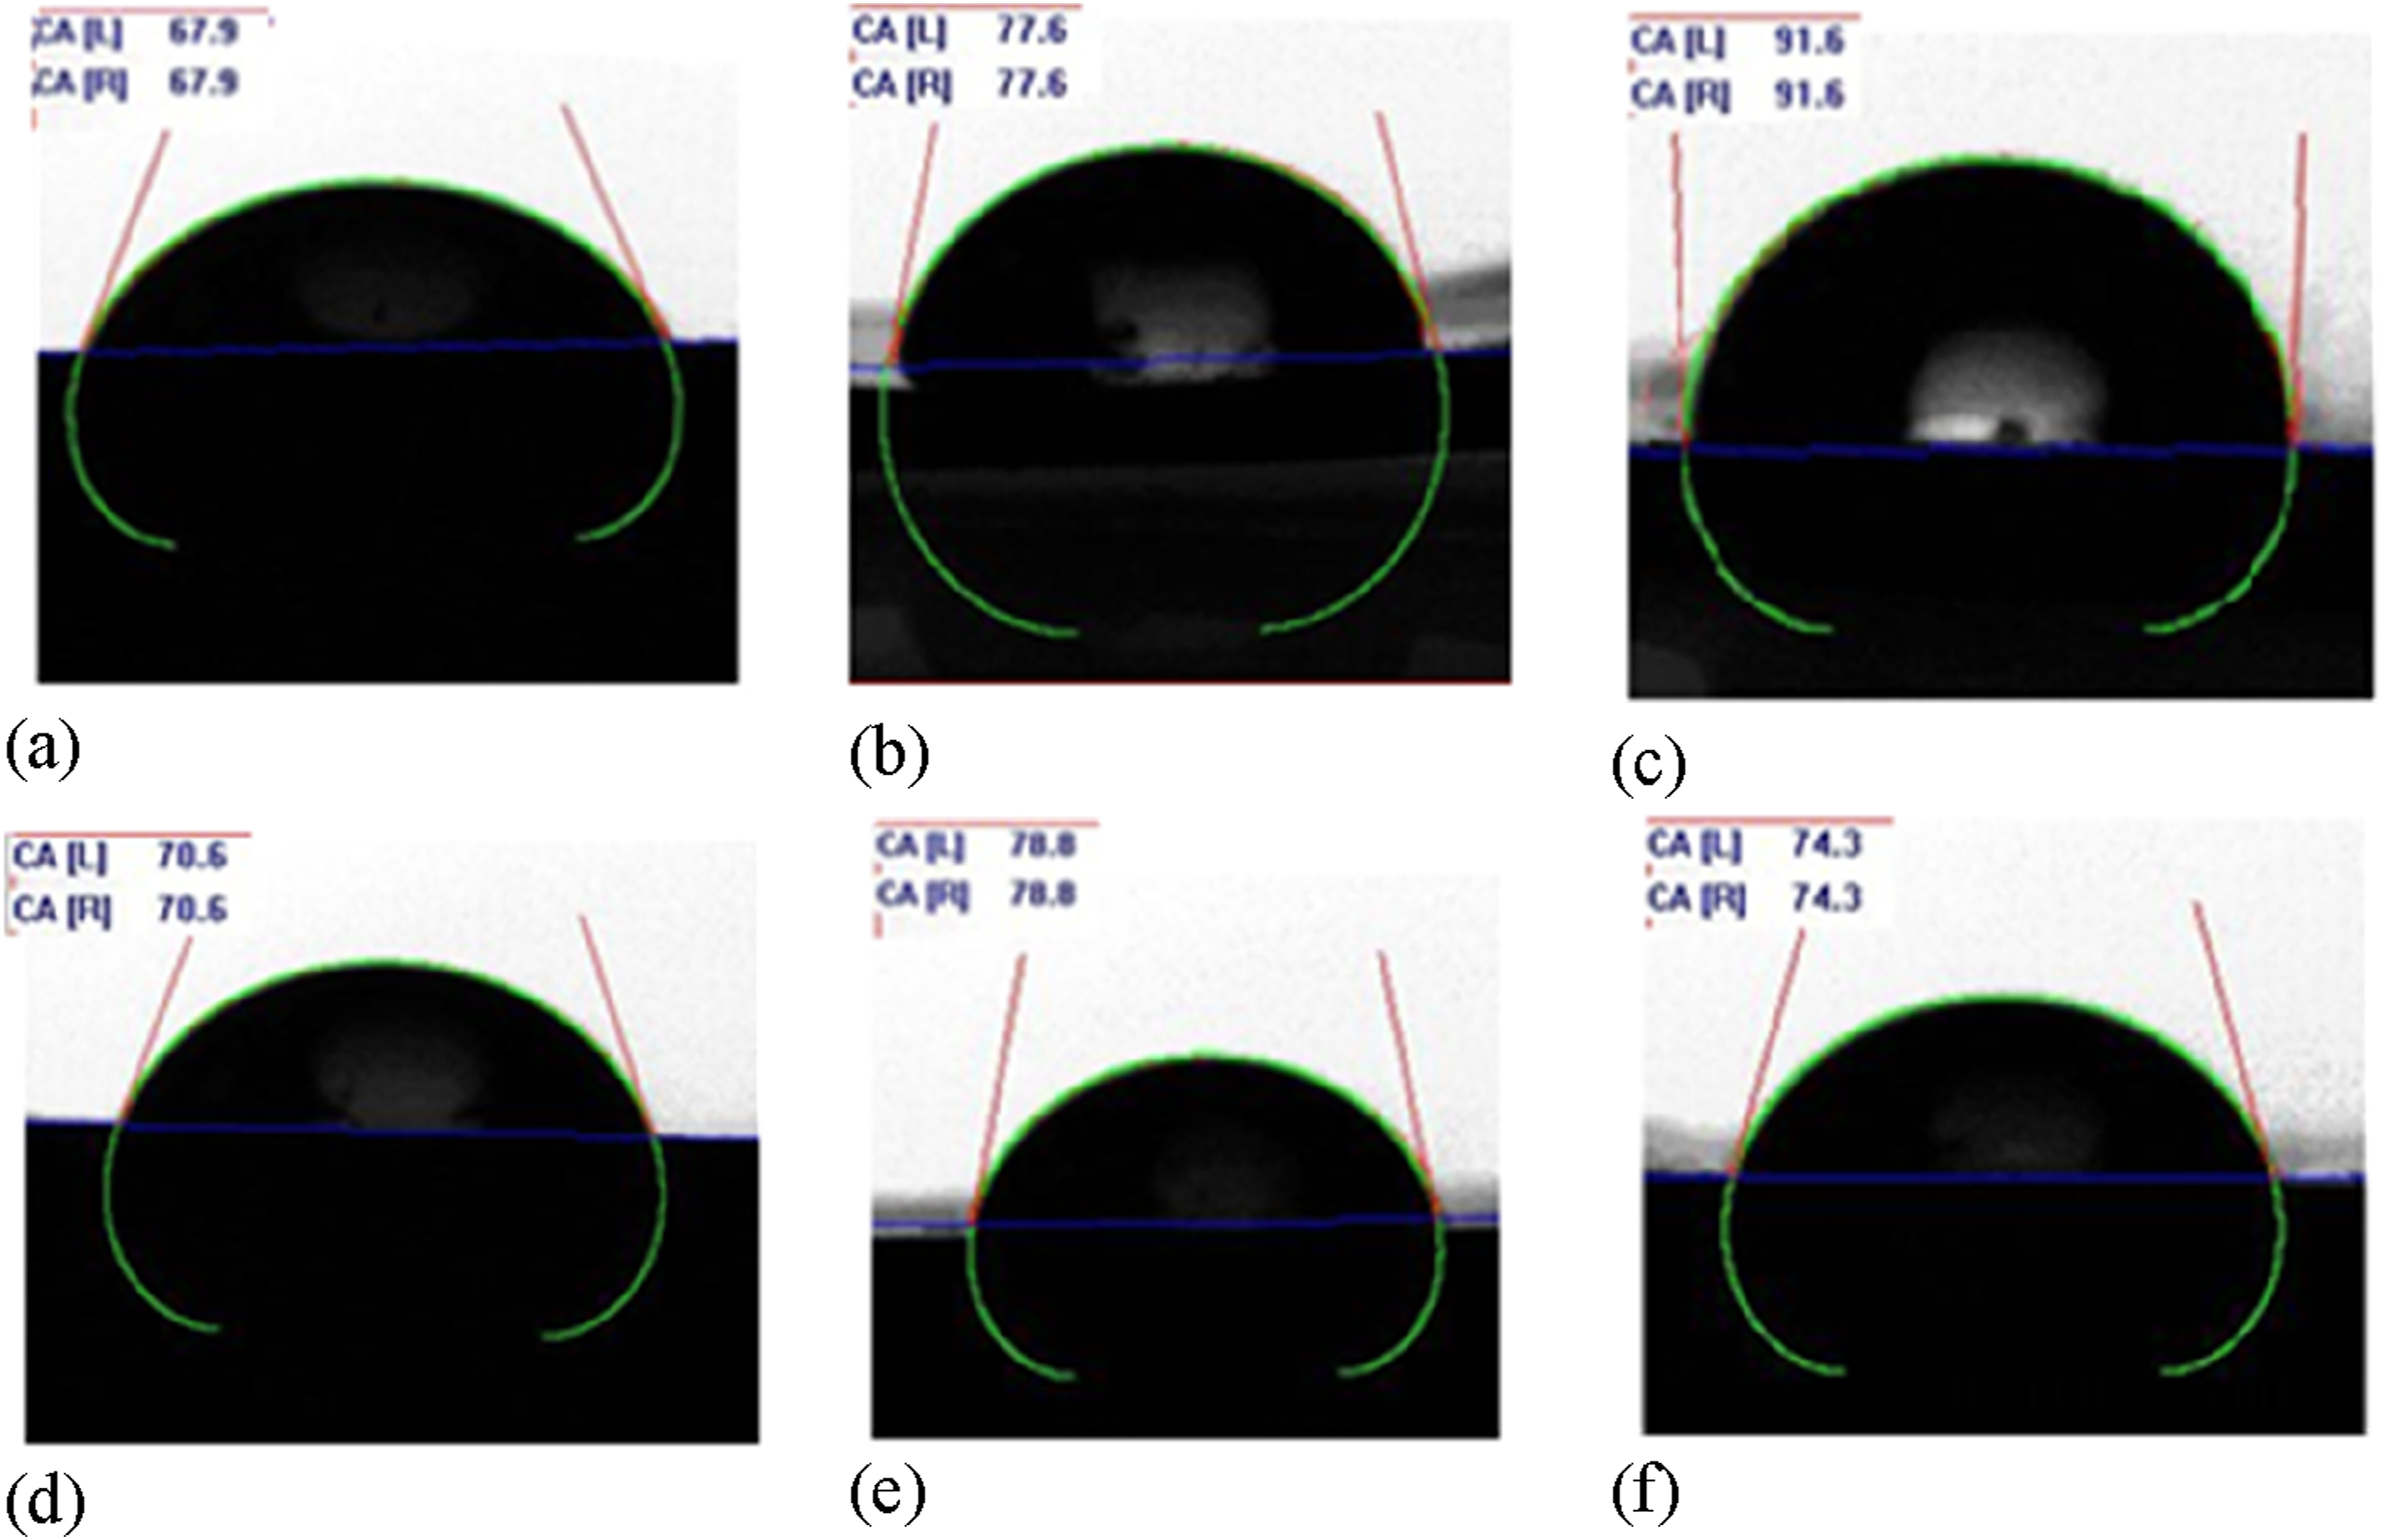
The results of water contact angle (WCA) measurement are shown in Figure 6. The surface free energies ( Water contact angle for (a) Pure PU, (b) PU + GNP, (c) PU+GNP+CNT, (d) PU + SiO2, (e) PU+GNP+SiO2, and (f) PU+CNT+SiO2 measured after 2 s of droplet touching the surface.
Water contact angle and surface free energy (SFE) for PU and nanomodified PUs.

The surface free energy of pristine graphene is approximately 44.8 ± 14.7 mJ.m−2, 30 while for CNTs, it varies depending on their type (single-walled or multi-walled) and functionalization, typically ranging from 27 to 45.3 mJ.m−2. 31 The surface free energy of fumed silica also varies significantly depending on its surface treatment, typically around 46-54 mJ.m−2. 32 Adding GNP, CNT, and SiO2 nanoparticles, either individually or in combination, to the PU matrix reduces the surface free energy of resultant nanocomposite.
According to the Wenzel 33 and Cassie-Baxter 34 model, rougher surfaces can amplify the intrinsic hydrophobicity of a material, resulting in a larger contact angle between the liquid and the surface. Incorporation of GNP, CNT, and SiO2 increases the surface roughness of the nanocomposites. In addition, the presence of nanoparticles within the PU matrix creates a more tortuous path for water molecules, acting as barriers to their penetration into the PU matrix.
Finally, the polarity of a material’s surface affects its surface free energy, with more polar surfaces generally exhibiting higher surface free energy. Adding CNTs or graphene to a polymer matrix reduces the overall polarity of the composite due to their inherent apolar characteristics. These factors contribute to the decrease in surface free energy of modified PU matrices, leading to improved water repellency relative to the pure PU coatings. This improvement can enhance the water resistance of wind turbine blades exposed to rain.
Water uptake test results
Water uptake test results of pure PU
Figure 7(a) illustrates the variation of the experimental fractional water uptake Water uptake for pure PU specimens (a) 
Figure 7(b) shows the water uptake for the undegassed specimens at 22°C and at 32°C. The specimens that were not degassed during preparation did not reach a saturation point after one month. This is caused by the presence of numerous air bubbles within the specimens, as the material processing was not conducted in a vacuum chamber. Optical images taken from the cross sections of PU specimens before submersion in water are shown in Figure 8, showing extensive air bubbles entrapped in the specimen. This highlights the importance of the mixing the nanomodified polyol with MDI in a vacuum chamber during material processing. Similar behaviour was observed for other undegassed nanocomposites, and their results will not be discussed any further. Optical microscope image of cross sections of a pure PU specimen (a) Undegassed, (b) Degassed.
Diffusion coefficient (D) and Water Contact Angle for pure PU and PU nanocomposites.

Effect of GNP and CNT on water uptake of PU
PU + GNP specimens with a loading of 0.3 wt% GNP and PU+GNP+CNT specimens with loadings of 0.15 wt% GNP and 0.15 wt% CNT were submerged in a water tank for a month at 22°C (RT), 32°C and 45°C. The water uptake for each specimen was measured at periodic intervals. Figure 9 shows the variation of the experimental fractional water uptake Water uptake for (a) PU + GNP, and (b) PU+GNP+CNT specimens at 22°C, 32°C, and 45°C.
The diffusion coefficient for PU + GNP and PU+GNP+CNT at 22°C, 32°C and 45°C are measured from the slope of tangent lines to the linear sections of the curves shown in Figure 9 and using equation (7). The results are summarised in Table 4.
Effect of nanosilica, nanosilica/GNP and nanosilica/CNT on water uptake of PU
PU + SiO2 specimens at 0.3 wt% loading of SiO2, PU+SiO2+GNP specimens at 0.15 wt% loading of SiO2 and 0.15 wt% loading of GNP, and PU+SiO2+CNT specimens at 0.15 wt% loading of SiO2 and 0.15 wt% loading of CNT were submerged in a water tank for a month at 22°C (RT), 32°C and 45°C. The water uptake for each specimen was measured at periodic intervals. Figure 10 shows the variation of the experimental fractional water uptake Water uptake for (a) PU++SiO2, (b) PU++SiO2 + GNP, and (c) PU++SiO2 + CNT specimens at 22°C, 32°C, and 45°C.
Summary of the water uptake results
The diffusion coefficients
PU+SiO2+GNP exhibits water contact angle is 78.8°, 16% higher than PU and ranked as the second most hydrophobic nanocomposite after PU+GNP+CNT. In addition, PU+SiO2+CNT has a water contact angle of 74.3°, 9.4% higher than pure PU.
Kinetics of water absorption
The experimental data collected from the water absorption tests were used to determine the kinetic of diffusion mechanism by identifying exponent 

The values of kinetic parameters Determining diffusion coefficient n by curve fitting of PU and various PU nanocomposite: (a) PU, (b) PU + GNP, (c) PU+GNP+CNT, (d) PU + SiO2, (e) PU+SiO2+GNP, and (f) PU+SiO2+CNT.
From the results shown in Figure 11, it is evident that all values of the kinetic rate coefficient
Scanning electron microscopy study
Scanning electron microscopy (SEM) is used to examine the features on the fracture surfaces of dry and wet tensile specimens. Using FTIR, Wang et al. 39 found that the N-H and C = O groups of polyurethane are strongly affected by the water absorption process. The water molecule initially interacts with the free N-H and C = O groups, then with the hydrogen-bonded N-H and C = O groups in the PU chain segment. Furthermore, the water molecules interact sequentially with free carbonyl, hydrogen-bonded carbonyl group between hard and soft segments, and with the hydrogen-bonded carbonyl group in hard domains.
SEM images of fracture surfaces of dry and wet PU and PU-modified nanocomposites are shown in Figure 12. The dry PU surface exhibits a relatively smooth surface morphology, while the wet PU has a rugged surface with cavities. Dry PU + GNP has ridges on the fracture surface, while the wet PU + GNP surface is not smooth and contains many cavities. The SEM image of dry PU + SiO2 shows the SiO2 particles, and it contains a uniform distribution of cavities with diameters ranging from 1 to 5 μm. The image of fracture surface of wet PU + SiO2 is rough, and some cracks are visible on the fracture surface. The image for dry PU+GNP+CNT is wavy, showing crack deflection, while the wet PU+GNP+CNT surface contains many cracks, possibly formed from elongation of trapped air bubbles. The image for dry PU+SiO2+GNP is also corrugated, showing crack deflection during crack propagation, contributing to higher modulus of toughness. On the wet surface of PU+SiO2+GNP elongated holes are visible, indicating the presence of trapped air in the specimens. Finally, the SEM image of fracture surface for dry PU+ SiO2+CNT is wavy, and the wet one is also rough, with some visible cracks on the fracture surface. SEM images of fracture surfaces of dry and wet PU nanocomposites after rupture of tensile specimens.
Tensile test of water saturated specimens
The effect of water absorption on the mechanical properties of both pure PU and various PU nanocomposites was examined. Tensile specimens were saturated with water by submerging them for a month. Subsequently, the specimens were carefully dried using a cloth before conducting tensile tests to obtain true stress-true strain data and mechanical properties. These results were then compared to those of dry specimens to assess the effects of water absorption on stress-strain characteristic and the mechanical properties of the different nanocomposites.
Tensile test results of water saturated pure PU
The true stress-true strain results for water-saturated pure PU specimens (hereafter referred to as “wet”) are illustrated in Figure 13(a), along with a representative result of a dry pure PU specimen (shown as a dashed line in Figure 13(a)). The results indicate that all wet pure PU specimens exhibit consistent stress-strain behaviour up to the failure strain. Compared to the dry PU specimens (dashed line), the stiffness of all wet specimens is reduced due to moisture softening, while the strain to failure is increased. This increase can be attributed to the presence of water in the micro holes of PU, which acts as a plasticizer, leading to a higher strain to failure. This effect has also been reported by Moreland et al,
12
who studied the effects of temperature and moisture on the stress relaxation behaviour of PU elastomer foams. They demonstrated that water molecules act as a plasticizer, facilitating the occurrence of local chain slippage. True stress-strain curves for wet specimens of (a) PU, (b) PU + GNP, (c) PU+GMP+CNT, (d) PU + SiO2, (e) PU+ SiO2+GNP, and (f) PU+ SiO2 +CNT together with the results of a representative dry specimen for each case.
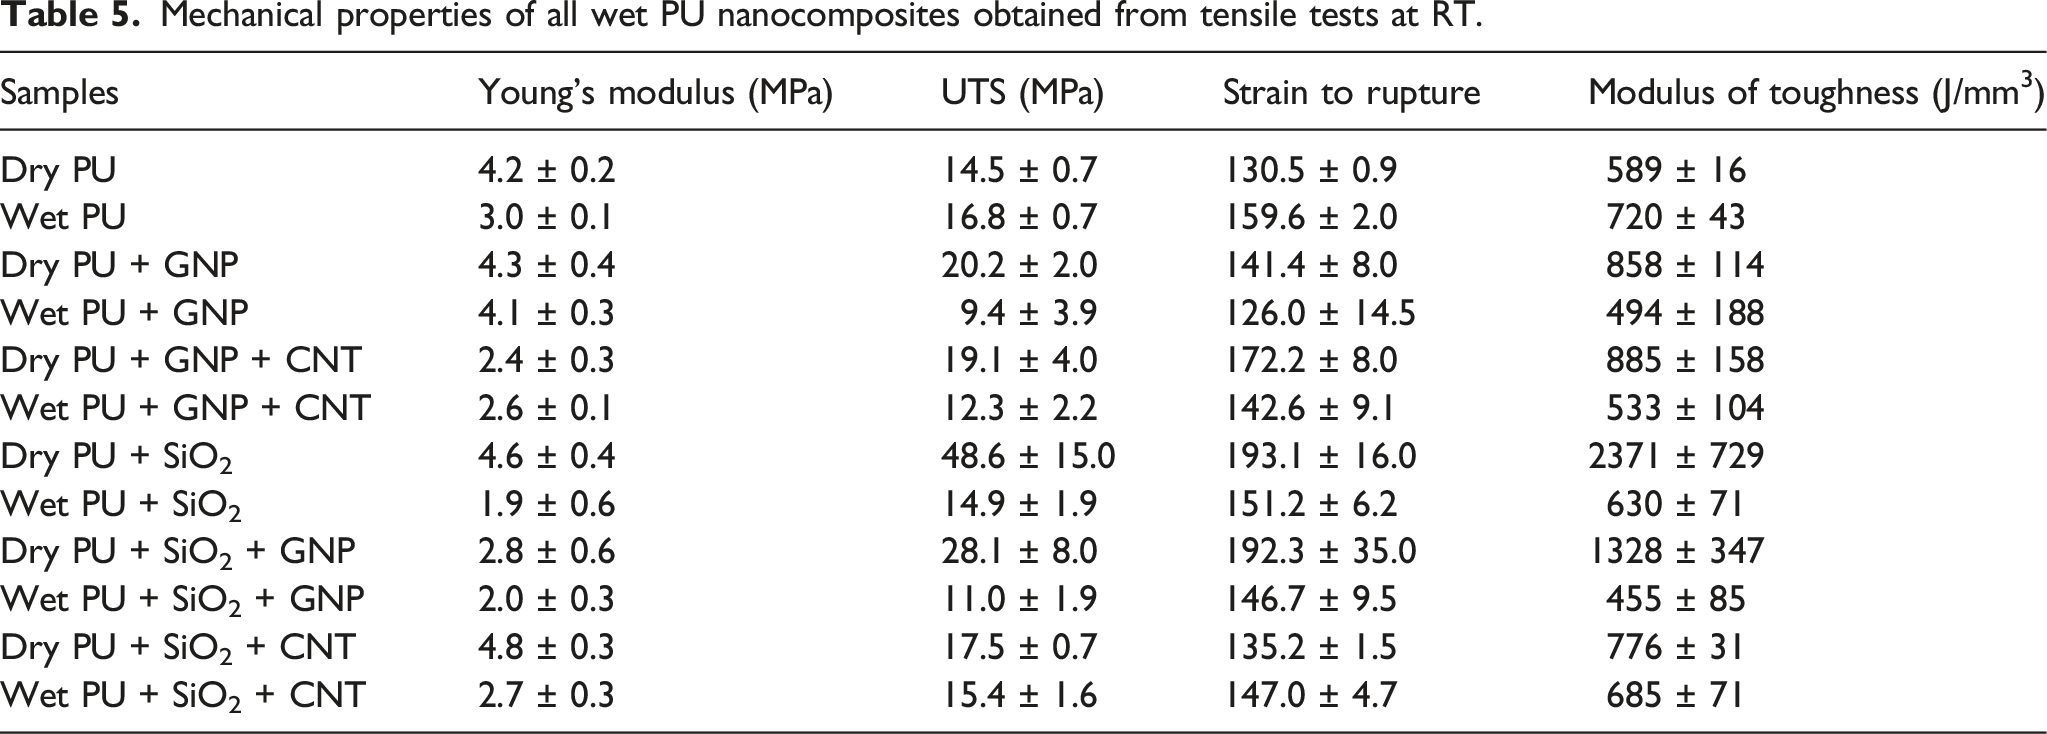
Mechanical properties of all wet PU nanocomposites obtained from tensile tests at RT.
Effect of GNP, and CNT on tensile properties of water saturated PU
Specimens of wet PU + GNP with GNP loading of 0.3 wt% and wet PU+GNP+CNT with 0.15 wt% GNP and 0.15 wt% CNT loadings were tested at a speed of 30 mm/min, and the tests continued until the specimens ruptured. The true stress-true strain results for wet PU + GNP specimens are illustrated in Figure 13(b), and for PU+GNP+CNT, the results are shown in Figure 13(c), along with the result of a representative dry specimen (dashed line) for each case.
The true stress-true strain results for wet PU + GNP show that moisture softening occurs for all the wet PU + GNP specimens, causing a small reduction in stiffness. However, the strain-to-failure values for the wet specimens are not consistent. GNPs tend to aggregate easily due to the strong van der Waals attraction and π-π stacking, making their dispersion in PU difficult. The most likely reason for this variation is the number and location of entrapped air bubbles and GNP agglomeration in the specimens. In comparison to their dry counterparts (dashed line in Figure 13(b)), the stiffness had deteriorated, and their strains to failure had decreased.
The true stress-true strain results for the wet PU+GNP+CNT show that, in comparison to their dry counterparts (the dashed line in Figure 13(c)), moisture softening was not noticeable for the wet specimens. However, both the strain to rupture and the tensile strength decreased relative to the averaged dry specimen. This could be either due to the presence of air bubbles trapping during the mixing of polyether polyol with isocyanates, and/or high stress concentration at various locations inside the specimens due to presence of GNP and CNT nanoparticles agglomeration.
The measured mechanical properties of dry and wet PU + GNP and PU+GNP+CNT specimens are summarised in Table 5. The results show that the average Young’s modulus of the wet PU + GNP specimens was decreased by 4.7% compared to the dry ones. Also, the UTS, strain to rupture, and modulus of toughness were decreased by 53%, 10.9% and 42.4%, respectively.
For PU+GNP+CNT nanocomposite, the average Young’s modulus is almost unaffected, and the difference is within experimental variation. However, the UTS, strain to rupture, and modulus of toughness have decreased by 36.6%, 17.2% and 39.8%, respectively.
Effect of silica, silica with GNP, or CNT on tensile properties of water saturated PU
Wet specimens of PU + SiO2 with SiO2 loading of 0.3 wt%, and PU+SiO2+GNP with SiO2 loading of 0.15 wt%, and GNP loading of 0.15 wt% and PU+SiO2+CNT with SiO2 loading of 0.15 wt%, and CNT loading of 0.15 wt% underwent the tensile test at a speed of 30 mm/min, and the tests were continued until the specimens ruptured. The true stress-true strain results for these specimens are illustrated in Figure 13, along with the true stress-true strain curve of a representative dry specimen from their counterpart for each PU nanocomposite (dashed line in the figures).
The true stress-true strain results for wet PU + SiO2 are shown in Figure 13(d). In comparison to their dry counterparts, moisture softening occurred for the wet specimens, resulting in deteriorated stiffness and lower strains to failure than the average dry specimens. This deterioration is partly caused by the hydrophilic nature of fumed nanosilica particles. Previous studies showed that SiO2 nanoparticles have high interface energy and a large surface area, making them more prone to intertwining and aggregation, which can decrease performance. 40 Saliba et al. 41 reported that nanosilica is hydrophilic and strongly interacts with water. In addition, Keskinen, et al. 2 demonstrated the presence of a few adsorbed water layers in subsaturated conditions for the smallest size nanosilica particles, as silica exhibits hydrophilic properties, with these water layers binding to silanol groups on its surface. Alvarez, et al. 42 highlighted the importance of acrylate monomers with carbon–carbon double covalent bond (C = C) anchor sites in the formation and stability of waterborne polyurethane film, facilitating the formation of different types of chemical bonds within the polymer structure. In our work silica nanoparticles were used as received and were not functionalised.
The results in Table 5 show that the average Young’s modulus of the wet PU + SiO2 specimens has decreased by 58.7% compared to the dry ones. In addition, UTS, strain to rupture, and modulus of toughness have all decreased by 69.3%, 21.7% and 73.4%, respectively. The decrease in Young’s modulus indicates that the moisture softening occurred in the wet specimens, leading to reduced stiffness.
The true stress-true strain results for the wet PU+SiO2+GNP specimens are shown in Figure 13(e). In comparison to their dry counterparts (represented by dashed line in Figure 13(e)), the stiffness of the wet specimens did not deteriorate, while their strain to rupture and UTS decreased. The mechanical properties of wet PU+SiO2+GNP are summarised in Table 4, reaviling that the average Young’s modulus of the wet PU+SiO2+GNP nanocomposite decreased by 28.6% compared to the dry ones. Furthermore, UTS, strain to rupture, and modulus of toughness decreased by 61.1%, 23.7% and 65.7%, respectively.
Finally, the true stress-true strain results of the wet PU+SiO2+CNT specimens are shown in Figure 13(f). In comparison to their dry counterpart (dashed line Figure 13(f)), the stiffness of the wet specimens deteriorated. This is caused by moisture softening of the nanocomposite as the absorbed water acted as a plasticizer, reducing stiffness, while leading to a higher strain to failure surpassing that of the dry specimens. This is in accordance with Wang, et al, 39 who found that the deterioration of mechanical properties of PU caused by water absorption was not only related to the damage of soft segments and the interface regions between soft domains and hard domains, but also caused by the plasticization of the microstructures of hard domains.
The results in Table 5 show that the average Young’s modulus, UTS, and modulus of toughness of the wet PU+SiO2+CNT specimens decreased by 43.8% 12%, and 11.7%, respectively, while strain to rupture increased by 8.7% compared to the dry ones.
Summary of tensile testing of dry and wet nanocomposites
A comparison of the mechanical properties of dry and wet PU and PU nanocomposites is shown in Figure 14. It is worth mentioning that Possart et al.
43
reported that within one day of exposure to water, water molecules break apart some of the weak hydrogen bonds between the urethane groups and replace them with H2O–urethane hydrogen bonds. Water molecules also weaken other physical interactions between network chains by solvating hydrophilic segments. Consequently, the average Young’s modulus, UTS, strain to rupture, and modulus of toughness for wet pure PU and PU nanocomposites deteriorate. Comparison of averaged Young’s modulus, UTS, strain to rupture, and modulus of toughness for dry and wet nanocomposites at 22°C.
Comparing various mechanical properties, water diffusivity coefficients, permeabilities, and water contact angles shows that fumed nanosilica improved the mechanical properties of the PU substantially in dry conditions. However, in wet environments, the mechanical properties deteriorated significantly. This is because having a very low water contact angle may lead to water spreading on the coating surface, resulting in significant water uptake. This issue is particularly important for coating applications in open environments such as wind turbine blades and airplane wings.
The PU+GNP+CNT nanocomposite demonstrated a high diffusion coefficient, implying rapid water molecule transfer within its structure. The high diffusivity is likely attributed to potential manufacturing inadequacies resulting in trapped air bubble voids capable of absorbing water molecules.
Both the PU+SiO2+GNP and PU+SiO2+CNT nanocomposites exhibited high water contact angles compared to other nanocomposites. They also had the lowest water diffusivity coefficient at both 22°C and 32°C temperatures, along with improvement in all mechanical properties in both dry and wet environments relative to pure PU.
Conclusion
In this paper, the effect of incorporating graphene, carbon nanotubes, and fumed nanosilica into polyurethane was investigated. Water uptake tests for both pure and modified PU were conducted at 22°C, 32°C and 45°C. The diffusion transport mechanism showed that pure PU and all PU nanocomposites exhibited a Fickian diffusion mechanism, characterised by linear water uptake at the early stage of submersion, followed by saturation after a long period. The diffusion coefficients of these materials were determined. The findings revealed that pure PU exhibited the highest water diffusion coefficient and the smallest water contact angle, indicating a shorter lifetime when exposed to rain. In contrast, the PU+SiO2+GNP and PU+SiO2+CNT nanocomposite demonstrated lower water uptake at tested temperatures. In addition, modified PU exhibited lower surface free energy compared to pure PU, making them relatively more hydrophobic. The PU+GNP+CNT nanocomposite showed the lowest surface free energy, measured at 70.8 mJ·m−2.
Damping coefficient was measured by DMA, and the results showed that all modified PU have higher damping relative to pure PU. The increase was 6.9% and 6.3% for PU+SiO2+CNT and PU+SiO2+GNP, respectively. The increase in damping factor improve the energy absorption by coating during rain droplet impact to wind turbine blades, elongating the blade life.
Tensile tests were conducted on the pure PU and all PU nanocomposites specimens immersed in water for a month to reach saturation. Their measured mechanical properties were compared with counterpart dry specimens at room temperature. Generally, the stiffness of all wet specimens was lower than their dry counterparts, while in most cases, the strain to rupture increased. These changes were attributed to the plasticising effect of absorbed water on PU and modified PUs. In addition, SEM studies on the fracture surface of wet specimens revealed existence of additional features such as rugged surfaces with cavities (wet PU, and wet PU + GNP), rough surfaces with cracks (wet PU + SiO2, wet PU+GNP+CNT, and wet PU+SiO2+CNT), and surface with elongated cracks (wet PU+SiO2+GNP), indicating deterioration of the PU and PU nanocomposites when exposed to water.
Upon comparing the mechanical properties, water diffusivities, damping factor, and water contact angles of pure PU and all PU nanocomposites, the PU+SiO2+GNP and PU+SiO2+CNT nanocomposites can protect the wind turbine blade better than unmodified polyurethane.
Footnotes
Declaration of conflicting interests
The author(s) declared no potential conflicts of interest with respect to the research, authorship, and/or publication of this article.
Funding
The author(s) received no financial support for the research, authorship, and/or publication of this article.