
Abstract
Multi-walled carbon nanotubes and high-density polyethylene (MWCNTs/HDPE) nanocomposite sheets with (1.0, 0.5, and 0.1) wt.% MWCNT were successfully prepared by coating the MWCNTs on the surface of the matrix particles (HDPE). The sample resistivities of the nanocomposites were investigated in relation to the temperature influence. Several findings could be drawn from these experiments: For instance, among all of the prepared MWCNT/HDPE nanocomposite sheets with (0.1, 0.5, and 1.0) wt. % MWCNT, the electrical resistivity of the 1.0 wt. % MWCNT/HDPE nanocomposite was 33.18 kΩ.m, demonstrating the best electrical conductivity. The resistivities of 0.1 wt. % and 0.5 wt. % samples were found to be 2594 and 372.23 kΩ.m respectively. Also, the measurements of temperature versus electrical conductivity revealed that the rise in temperature causes the electrical resistivity for the MWCNT/HDPE nanocomposites to increase due to the expansion of the distances between the conductive nanofillers (CNT), i.e., the sample resistivity increased under heating due to the thermal expansion of the polymer matrix. For example, the initial electrical resistivity for the 1.0 wt. % MWCNT/HDPE nanocomposite sheet decreased from 36.25 kΩ.m to 33.18 kΩ.m after the heat treatment. Besides, heat treatment could effectively improve the reproducibility of the MWCNT/HDPE nanocomposites. The reproducibility of the 1.0 wt. % MWCNT/HDPE nanocomposite was better than that of the 0.5 wt. % MWCNT/HDPE nanocomposite.
Introduction
An electrically conductive polymer composite contains a polymer and a conducting filler. Carbon nanotubes (CNT) are used to reinforce polymeric matrices such as polyethylene with an ultra-high molecular weight. This will enhance the electrical conductivity of nanocomposites as well as their strength, stiffness, thermal conductivity, and stability. The enhancement of oxidation stability is another benefit of having CNTs in polymer composites. The very high aspect ratio of some carbon nanotubes may also enable them to be aligned with one axis of the composite, which makes the fabrication of conducting polymers easier.1,2 Adding a small amount of CNT (as a conductive filler) to the polymer matrix can raise the electrically insulating polymer conductivity by 8–10 orders of magnitude in CNT-based composites.3–5 However, these composites’ performance depends on several aspects, such as the CNTs’ morphology, the structure, 6 the processing method, the matrix type,7,8 the dispersion of the CNTs within the matrix, and the interfacial interaction between them.9–11 Deagglomeration and dispersion are the main problems that may occur during the mixing of CNTs with polymers. Therefore, uniform dispersion of nano-sized CNT filler particles can produce an ultra-large interfacial area per volume between the nano element and polymer matrices. 2
Electrical conduction in a conductive polymer composite can be described by two important mechanisms: percolation theory, which is held in the matrix’s continuous conducting parts,12,13 and tunnelling between discontinuous conducting phases.14–16 The percolation theory is used to understand the conductive behaviour of the composites. It states that the formation of conductive pathways by the conductive fillers results in the insulating-to-conductive transition of composites. Such a transition required a critical amount of fillers, which is defined as the percolation threshold and leads to the conductive network formed in the matrix. Although the common method of achieving appropriate electrical conductivity is by adding more filler to the composite, some applications require a higher electrical conductivity of up to 104 S/m. 17 However, a large percentage of the filler will have an extremely undesirable influence on the mechanical integrity, fabrication, and costs of the conductive composites. Thus, according to percolation theory,18,19 using fillers with a high aspect ratio and intrinsic conductivity can lower the high loading of the fillers. Carbon nanotubes (CNTs) are used as a well-known superconductor with high aspect ratios. With proper dispersion, the percolation threshold for CNT-based nanocomposites is as low as less than 1.0 wt.%.20–22
The challenge of increasing the electrical conductivity in the composite, however, is greater than that of lowering the percolation threshold in the composite. Some percolation conductivity remains constant despite any increase in filler amount. For instance, the MWCNT/polyethylene nanocomposites’ maximum conductivity stopped at the level of 10 S/m as the CNT loading increased further than 10 wt. %. 23 According to previous research, the maximum conductivity in the conductive composite is two to four orders lower than the intrinsic conductivity of CNT nanofillers due to the contact resistance between MWCNT fillers and tunnelling resistance.24,25 Therefore, the reduction of this resistance leads the conductive fillers to work more efficiently.
In this paper, the effects of temperature on the electrical conductivity of the MWCNT/high-density polyethylene nanocomposites will be investigated. Although many efforts have been made in this field, the knowledge of the reproducibility of conductive polymer nanocomposites is still limited. Therefore, a study of the reproducibility of the MWCNT-based nanocomposites prepared by a coating method was highlighted.
Experimental details
Materials
The main materials used in this study were: Multi-walled carbon nanotubes (MWCNTs) with a purity rating of 95% were purchased from the Chengdu Institute of Organic Chemistry, Chinese Academy of Sciences. The length of the MWCNTs was 20–50 μm; the average outer diameter was 10–20 nm. High-density polyethylene (HDPE) (Density: 0.98 g.cm−3, MFI: 4.0 g/10 min) powder with a particle size of an average of 850 μm in length was supplied by Exxon Mobil Corporation, UK. All the materials were used as received.
Sample preparation
MWCNT/HDPE nanocomposites were prepared by dispersing the MWCNTs in the (HDPE) polymer matrix using a patented method, that allowed CNT particles to be coated on the surface of the individual polymer powder particles without any change to the morphology of the particle. This method includes two steps; first, “providing a mixture comprising a liquid, an additive, and a polymer, wherein the additive is dispersed in the liquid.” Secondly, heating the obtained mixture to soften the surface of the polymer so that the additive attaches to the polymer’. 26
Preparation of MWCNT solution
Starting with 100 mg MWCNTs immersed into 20 mL distilled water, which then was treated by ultrasound for 30 min. The sonic dismembrator (Fisher Scientific Model 500, 300 W) was used to get better dispersion by this ultra-sonication.
Preparation of MWCNT/HDPE nanocomposites
The MWCNT were added to the HDPE particles with constant and rapid manual stirring after dilution. Then, the MWCNT/HDPE nanocomposites were dried at 353.15 K for 24 h to remove residual water, which was the last step in the preparation of the MWCNT/HDPE composites. The MWCNT/HDPE nanocomposites with MWCNT weight fractions of 0.1 wt%, 0.5 wt%, and 1.0 wt% were produced as described in the next section. HDPE has a higher melting point than LDPE, a low resin cost, and easy formability. 27
Fabrication of MWCNT/HDPE
The MWCNT/HDPE nanocomposite films were prepared using melt mixing and hot pressing. The MWCNT/HDPE nanocomposite powders were compressed into sheets with a diameter of 50 mm and a thickness of 1 mm at 408.15 K using hot compression moulding. The relationship between temperature and electrical conductivity in these sheets is investigated. The whole procedure for preparing MWCNT/polymer nanocomposites is illustrated in Figure 1. Schematic procedure for preparation of MWCNT/the polymer nanocomposites.
Measurements
Electronic conductivity measurements
Electrical conductivity-temperature
The Fluke PM6306 Programmable Automatic RCL Meter was used to measure the electrical resistance of all samples. These samples, with a diameter of 50 mm and a thickness of 1 mm, were coated with silver paint to ensure good electrical contact and connect to the automatic RCL meter. Then, they were placed in an oven where the temperature could be adjusted and controlled. The electrical conductivity was recorded with an increment of 20 K from 293.15–373.15 K and then recorded with a decrease of 20 K from 373.15 K to 293.15 K. The heating and cooling processes were repeated twice for each sample. After two times of heating and cooling, half of the samples were left for 3 days, and then the process of heating and cooling was repeated with the recording of the electrical conductivity. Another half of the samples were then put in the oven, at a temperature of 353.15 K for 12 h. The heating and cooling process was then repeated on samples with recorded conductivity.
Characterization
Scanning Electron Microscopy (SEM)
The morphology and the dispersion of MWCNT fillers for both nanocomposite powders and sheet surfaces were studied using the field emission gun scanning electron microscopy (FEGSEM) LEO 1530VP instrument at a voltage of 5 kV.
Modulated Differential Scanning Calorimetry (MDSC) measurements
The thermal behaviour of pure HDPE was investigated by using a TA Instruments 2920 MDSC. The sample was weighed (about 10 mg) and sealed in an aluminium pan, then heated from room temperature (293.15 K) at a heating rate of 283.15 K/min.
Results and discussion
Morphology
HDPE and MWCNT powder
Figure 2(a) and (b) show the SEM images of HDPE and MWCNT, respectively, in the powder state. As can be seen from Figure 2, the morphologies of HDPE powder (part a) showed an irregular microstructure which might weaken the reinforcement.
28
In part (b), the bamboo-shaped MWNTs are clear. SEM images of HDPE and MWCNT powders micrographs.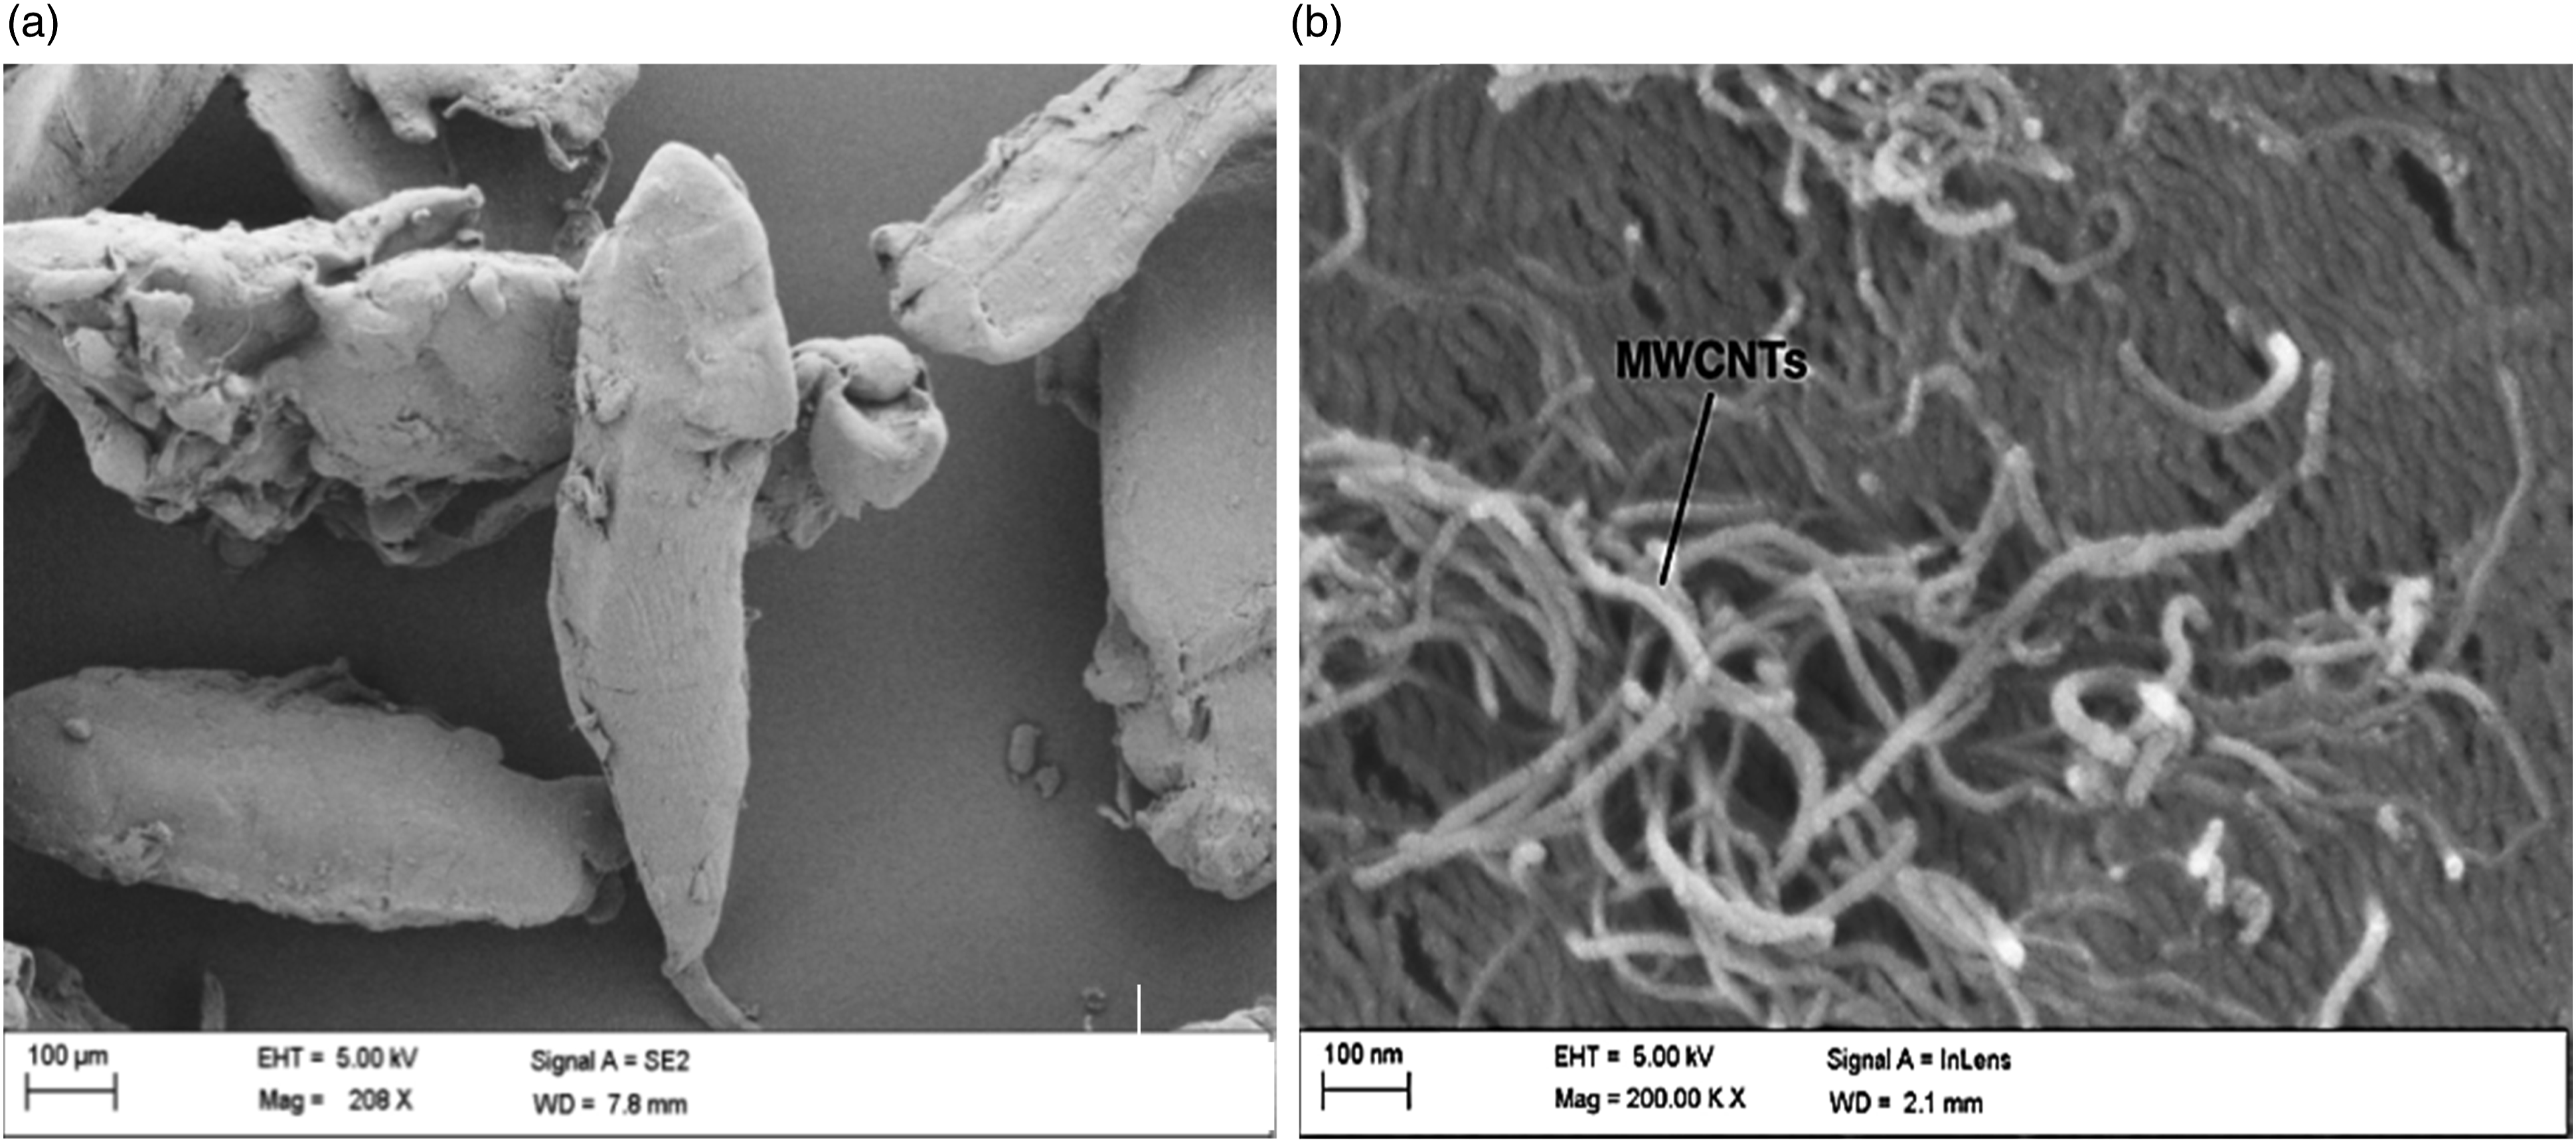
MWCNT/HDPE nanocomposites (powder)
Figure 3 shows the SEM images of the matrix of MWCNT/HDPE nanocomposite in the powder state with MWCNT weights of 0.1 wt%, 0.5 wt%, and 1.0 wt% MWCNT, respectively. In these images, the MWCNTs could be easily observed as white strands that almost covered the whole surface of the HDPE powder particles with only 1.0 wt.% of MWCNT. In addition, nanofillers usually tend to accumulate very easily, which can affect and weaken the mechanical properties of the final nanocomposite sheets. However, although the dispersions of the MWCNTs were uniform, a few agglomerates could still be detected. SEM images of (a) 0.1 wt.% MWCNT/HDPE nanocomposite powders (b) 0.5 wt.% MWCNT/HDPE nanocomposite powders (c) 1.0 wt.% MWCNT/HDPE nanocomposite powders.
It is clear that as the contents of MWCNT increased, the average area covered with MWCNT increased as well. Thus, the agglomeration of the MWCNT became more noticeable. However, these agglomerates could form conductive three-dimensional networks during the next stage of compression moulding. That is because of the hot pressing that may improve connections between adjacent agglomerates. 29 As mentioned before, the successful preparation of polymer nanocomposites strongly depends on the uniform dispersion of nanofillers in the polymer matrix. In this study, MWCNT/polymer nanocomposite powders were prepared by coating the MWCNTs on the surface of HDPE, which results in this uniform dispersion of the CNT in a different part of the HDPE surface.
MWCNT/HDPE nanocomposites sheets
The prepared nanocomposite powders were compressed into sheets at 408.15 K. The chosen temperatures were around the melting points of the polymer, which is in the range of 403.15–410.15 K for HDPE. 30 At these temperatures, the nanocomposite powders are not molten, which is good for forming conductive networks.
Figure 4 shows the SEM images of a surface fracture of the MWCNT/HDPE nanocomposite sheets with the MWCNT weight fractions of 0.1 wt.%, 0.5 wt.%, and 1.0 wt.%. It is clear from (a) to (c) that the content of the MWCNT increased, which resulted in the formation of a network of this connected MWCNT. This network became denser as the fraction of MWCNT increased. SEM images of surfaces fracture of (a) 0.1 wt.% MWCNT/HDPE nanocomposite sheet (b) 0.5 wt.% MWCNT/HDPE nanocomposite sheet (c) 1.0 wt.% MWCNT/HDPE nanocomposite sheet.
Conductivity of the MWCNT/HDPE sheets
The initial electrical resistivity of MWCNT/HDPE nanocomposites.
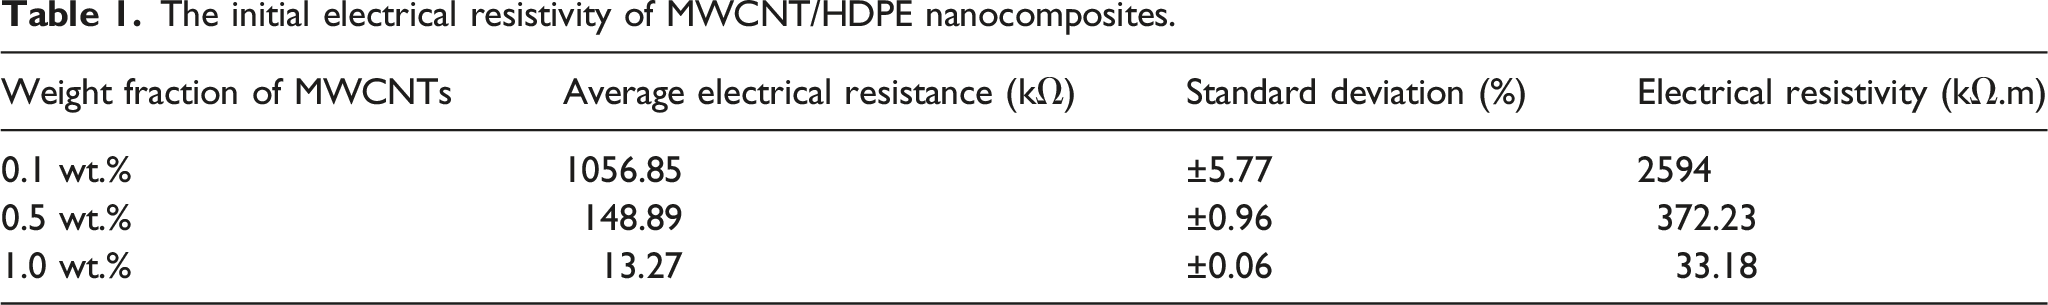
Table 1 and Figure 4(b) and (c) present the conductive networks with 0.5 wt.% and 1.0 wt.% of MWCNT/HDPE nanocomposites throughout the whole sample. With a 1.0 weight percent fraction of MWCNT, the composite’s resistivity decreased to 33.18 kΩ.m. Although the conductive networks in the 0.1 wt.% MWCNT/HDPE nanocomposite were not obvious in the SEM image (see Figure 4(a)), the electrical resistivity of the 0.1 wt.% MWCNT/HDPE nanocomposite, about 2594 kΩ.m, could be detected. The invisible conductive networks in the SEM image of the 0.1 wt.% MWCNT/HDPE nanocomposite are probably because most of the MWCNTs are enclosed in the HDPE matrix. 27
Figure 5 shows the electrical resistance of MWCNT/HDPE nanocomposites with different MWCNT contents. In this Figure, the percolation threshold was difficult to identify for only three different fractions of MWCNT. Though it is clear from the slope that the decreasing rate in electrical resistance is higher from 0.1 wt.% to 0.5 wt.% than from 0.5 wt.% to 1.0 wt.% in MWCNT/HDPE nanocomposite, the change in electrical resistance became nearly stable from 0.9 wt.% to 1.0 wt.%. As a result, when the nanocomposite resistance of 0.1, 0.5, and 1.0 wt.% MWCNTs were compared, the nanocomposite with 1.0 wt.% MWCNTs was closer to the percolation threshold. In addition, the standard deviation of their electrical resistance values was quite small and different for each fraction, as presented in Table 1. This is likely to be due to the different sensitivities of the electrical measurements for different nanotube contents, and greater electrical stability was shown in the nanocomposites with CNT contents around the percolation threshold.
31
Electrical resistances of MWCNT/HDPE nanocomposites with different MWCNTs contents.
Temperature-dependent electrical conductivity
In the temperature-electrical conductivity measurements, the MWCNT/HDPE nanocomposite sheets with the size of 50 mm × 50 mm × 1 mm were fabricated and tested. Figure 6 illustrates the graphs of resistance versus temperature for the M5WCNT/HDPE nanocomposites with three different percentages (1.0 wt.%, 0.5 wt.%, and 0.1 wt.%) of MWCNT in three measurement steps. There were three to four samples for each CNT fraction of the MWCNT/HDPE nanocomposite sheets. One sheet from each fraction has been tested to check its reproducibility. Graphs (a, c, and e) are without any heat treatment, but graphs (b, d, and f) have the last measurement steps after 12 h of heat treatment at 353.15 K. As expected, there is a monotonic relationship between the electrical resistivity and the temperature in every single sheet.
2
It has a steady increase as the temperature is raising from 293.15 K to 373.15 K and vice versa. This is because the increase in temperature caused the distance between the conductive nanofillers to increase, which led to an increase in electrical resistivity. However, the initial electrical resistivity for the MWCNT/HDPE nanocomposite sheets with the same filler fraction were different before and after the heat treatment, which can be summarised in Table 2. Plots of resistance versus temperature for the MWCNT/HDPE nanocomposites with the MWCNT contents of (a) 1.0 wt.% without heat treatment (b) 1.0 wt.% after 12 h of heat treatment (c) 0.5 wt.% without heat treatment (d) 0.5 wt.% after 12 h of heat treatment (e) 0.1 wt.% without heat treatment (f) 0.1 wt.% after 12 h of heat treatment. Initial electrical resistivity of the MWCNT/HDPE nanocomposites with different filler contents.
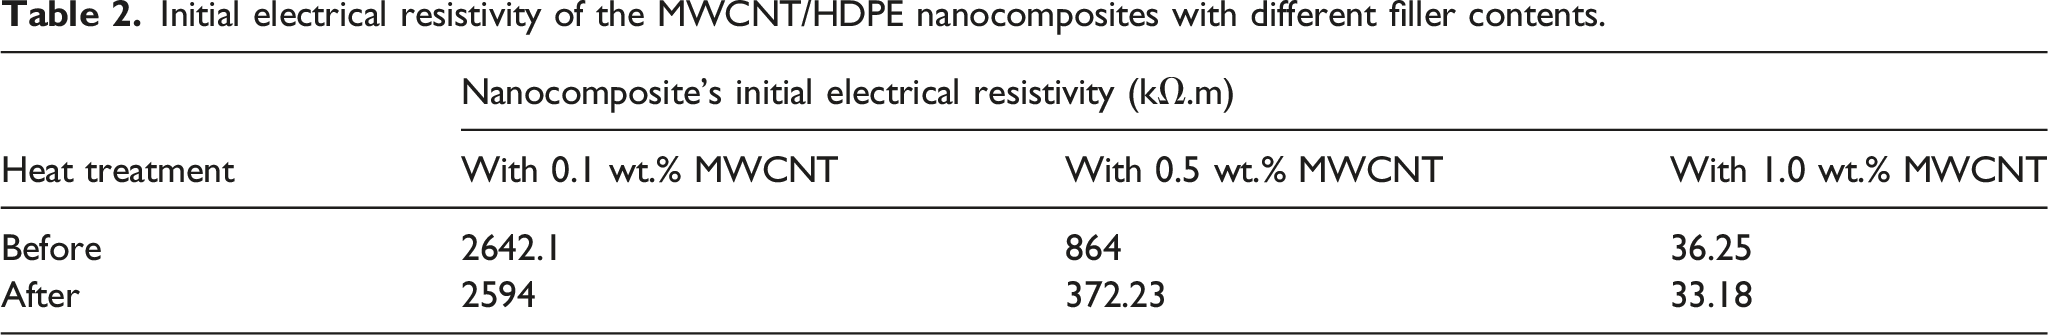
As is seen from Table 2, the initial electrical resistivity values for each MWCNT/HDPE nanocomposite with the same filler contents are smaller after the heat treatment. This can be related to the heat influence on the nanocomposite structure, which makes it much more homogenous, which decreased the resistivity of the whole sheet.
As shown in Figure 6, when the temperature increased, the electrical resistance of the MWCNT/HDPE nanocomposite with different filler contents rose dramatically. This is because the increase in temperature caused the distance between the conductive nanofillers to increase, which led to an increase in electrical resistivity. Similarly, when the temperature decreases, the distance between the conductive nanofillers accordingly drops, resulting in a reduction of the electrical resistivity.
During these tests, each sample experienced two processes of heating and cooling. It was interesting that the electrical resistance of the MWCNT/HDPE nanocomposites during each process of cooling was smaller than that during the same process of heating. This indicates that the electrical conductivity during the process of cooling was better than during the same process of heating. During the cooling process, the conductive nanofillers retain their original structure very slowly. Thus, connections between the nanofiller particles may be formed slowly but strongly. In other words, the distances between the conductive nanofillers are adjusted to be smaller, leading to better electrical conductivities during the cooling process.
Additionally, the electrical resistance for the second process of heating and cooling were smaller than those for the first process of heating and cooling. These results are most likely because the heating induced some movement of the polymer chains, which resulted in a rearrangement of the conductive nanofillers in the first process, resulting in a smaller resistance in the next measurements.
Reproducibility of electrical conductivity in MWCNT/HDPE nanocomposites
Figure 6 showed that the gaps between the electrical resistance graphs in the first process of heating and cooling were bigger than those in the second process of heating and cooling, which indicated that the reproducibility of the electrical conductivity of the second process of heating and cooling was better than that of the first process.
The reason behind that is that, since the MWCNT/HDPE nanocomposite sheets used in this study were made from nanocomposite powders, there are probably some cavities left inside the samples after the compression molding. These voids lead to an increase in the distances between the conductive nanofillers and, further, make the electrical conductivity decrease. Thus, each process of heating can decrease the size and number of voids. The effect of the voids on electrical conductivity can be gradually excluded with each process of heating, which results in an improvement in reproducibility.
Figure 7 shows the MDSC curve of pure HDPE, which indicates that the melting point of pure HDPE could be identified as 133.57°C, which is 406.72 K in S.I. units. Thus, the heat treatment temperature of 353.15 K could be suggested as a “safe-side” temperature because, at 353.15 K, the nanocomposites cannot further fuse, so no new distribution of the MWCNTs can establish itself.
32
MDSC curve of pure HDPE.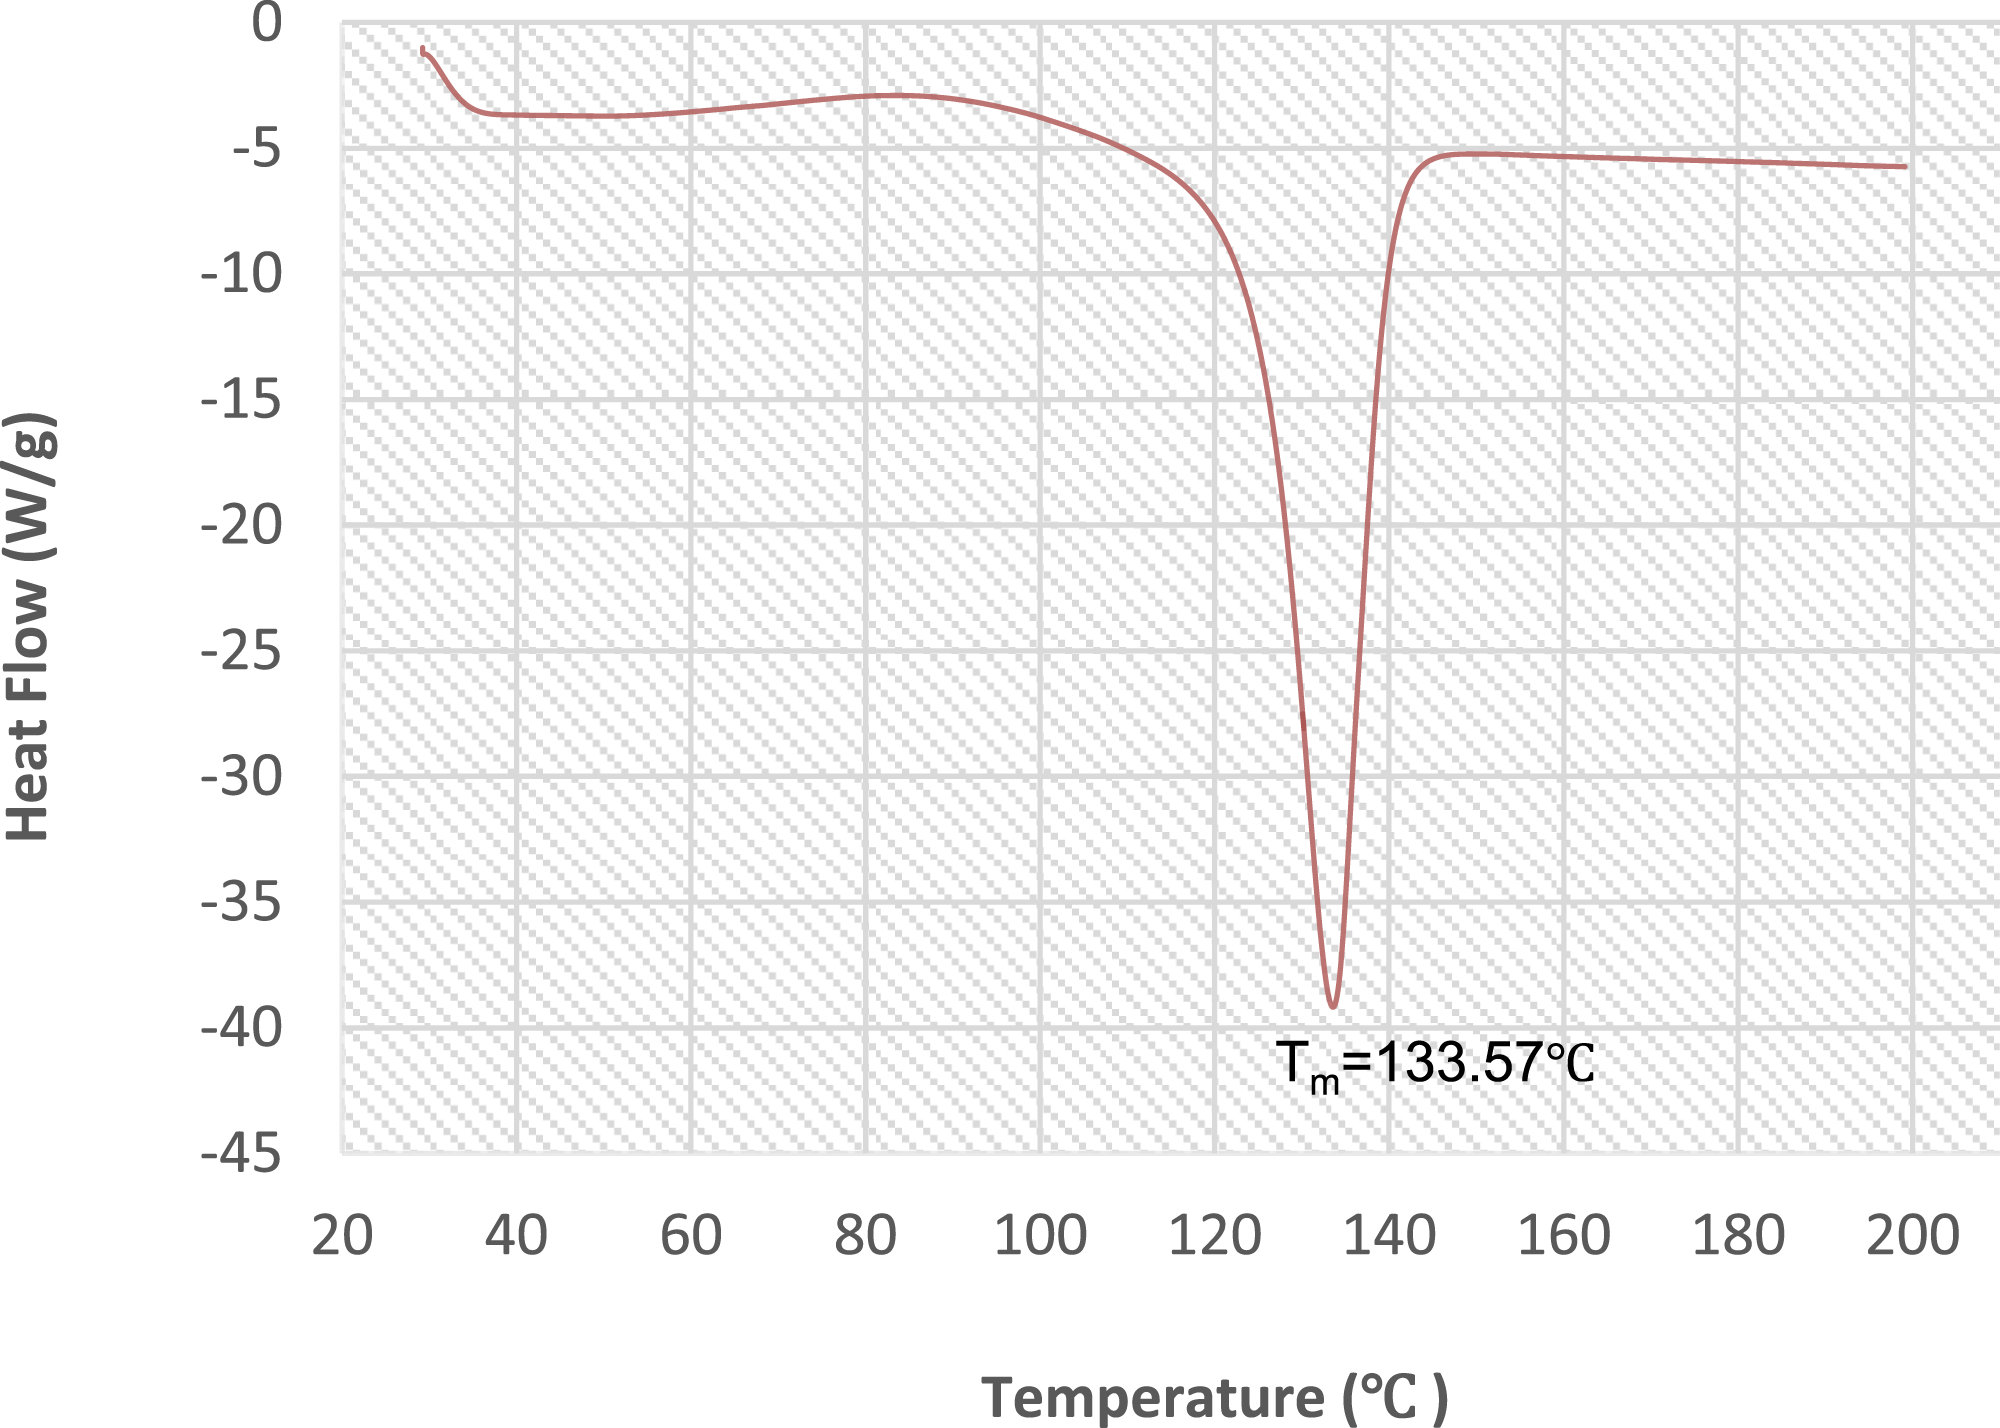
As for the reproducibility of the 0.1 wt% MWCNT/HDPE nanocomposites (Figure 6(e) and (f)), the heat treatment did not have an obvious effect on the reproducibility of the MWCNT/HDPE nanocomposite with the MWCNT content of 0.1 wt. %. This is probably due to the low conductive filler content in the MWCNT/HDPE nanocomposites. The two processes of heating before the heat treatment have created voids in the nanocomposite sheets, which leaves the heating treatment without any further influence on the nanocomposite structure. Besides, the conductive nanofillers’ rearrangement is almost complete during the two processes of heating and cooling. Therefore, heat treatment has only a small effect on reproducibility.
Apart from the 0.1 wt.% MWCNT/HDPE nanocomposite, the heat treatment had apparent effects on the reproducibility of the rest of the tested fractions of the nanocomposites; especially for the 1.0 wt.% MWCNT/HDPE nanocomposites (Figure 6(a)–(d)). Without using the heat treatment, there was still a large gap in the electrical resistance path between the processes of heating and cooling after 3 days, as shown in Figure 6(a). However, Figure 6(b) indicates that heat treatment results in a significant decrease in this gap between the electrical resistance of the heating and cooling process paths, and effectively improved reproducibility.
Furthermore, another temperature-electrical conductivity measurement has been taken for each sample in the return path after 2 weeks of heat treatment, as shown in Figure 8 for 0.5 wt.% and 1 wt.% MWCNT. Although the resistance increased as the temperature rose, it is clear from these results that each sample has a different starting resistance value, even if they contain the same MWCNT fraction. Plots of resistance versus temperature for four samples of MWCNT/HDPE nanocomposites with the MWCNT contents of 0.5 wt.%/1 wt.% MWCNT.
The difference in the electrical resistivity of each MWCNT/HDPE nanocomposite sheet with the same filler fraction may lie in the inhomogeneous heating of the samples, which induces different melt viscosities throughout the whole sample. Thus, the dispersion of the conductive nanofillers in each nanocomposite sheet is different, resulting in a difference in the whole sample resistivity.
Temperature-conductivity behaviour in carbon nanotube/polyethylene composites
The temperature coefficient effect is one of the significant properties of electrically conductive composites, which means during the heating process, the electrical resistivity of the composites either increases (Positive Temperature Coefficient, PTC) or decreases (Negative Temperature Coefficient, NTC).
33
The characteristics of each system depend on the nature of the polymers and the filler and the concentration of the filler. Figure 8 illustrates the resistance and temperature relationship for four samples. The conductance of this plot can be calculated and plotted in Figure 9. Plot of capacitance versus temperature for MWCNT/HDPE nanocomposite sample with the MWCNT contents of 0.5 wt.%.

It reveals that, during the heating process of the CNT/PE nanocomposite from 293.15 K to 373.15 K, thermal expansion took place. 33
The relation between conductance and temperature can be determined from the next equation. Since the strain can be expressed as

HDEP thermal expansion coefficients = 120 × 10−6 mm/°C.
Thus, the relation between PE thickness and temperature can be determined from equation (3) and has been plotted as shown in Figure 10. Plot of the distance between CNTs and temperature changed for MWCNT/HDPE nanocomposite with 0.5 wt.%. MWCNT.
As it is clear from Figure 10, the distance between adjacent CNT separations and the temperature have a proportional relationship. The separation (a) of CNTs increases from 0 to 488 nm as the temperature rises from 293 to 373.15 K. The greater the separation, i.e., the thicker the PE layer, the lower the electrical resistivity. This eventually returns to a non-conducting state.
Conclusion
To conclude, the effects of the temperature on the electrical conductivity of the MWCNT-based nanocomposites were investigated. As the MWCNT weight percentage increased from 0.1 to 1%, the average electrical resistivity decreased. This indicates an increase in electrical conductivity in the samples. 1.0 wt% MWCNT/HDPE nanocomposite showed the best reproducibility of the electrical conductivity with temperature.
The conductivity below the percolation threshold is well explained by the tunnelling conduction mechanism. There was a linear relationship between the strain as well as the temperature and the distance between CNTs (a). In other words, the thermal expansion of the polymer matrix causes resistance to be increased. Furthermore, it was found that reproducibility was improved by preheating treatment before each test. On the other hand, the difference in the initial electrical resistivity during the temperature-electrical conductivity measurements of the nanocomposites with the same filler contents inevitably affects the study of the heat treatment effects on reproducibility. Thus, the fabrication of nanocomposites with almost the same initial resistance electrical and the same filler contents is crucial. This research could provide practical assistance in the development of electrically conductive composites for desirable future sensing devices.
Footnotes
Declaration of conflicting interests
The author(s) declared no potential conflicts of interest with respect to the research, authorship, and/or publication of this article.
Funding
The author(s) received no financial support for the research, authorship, and/or publication of this article.