
Abstract
The aviation and automobile industries have recently depended on thermoset epoxy-based prepreg as a raw material for manufacturing composites. Since prepregs have a limited out-life (i.e., the maximum storing time allowed at room temperature), they must be stored in refrigerators at low temperatures. If not maintained, they can often adversely affect the desired quality of the final product. Prepregs are often discarded once the prepreg out-life ends, leading to a loss of millions of dollars and a detrimental impact on the environment. Therefore, it is necessary to develop a simple method to monitor prepreg aging/degradation in order to ensure its usability or repurpose prepreg usage. In this study, we used broadband dielectric spectroscopy to monitor the degradation state of the glass fiber/epoxy prepreg sample stored at room temperature, and the data has been used to predict the mechanical performance of the final manufactured composite part. The frequency-based nondestructive dielectric measuring technique was used to calculate the dielectric strength and relaxation time of the prepregs. The dielectric strength decreased and relaxation time increased with aging, allowing the aging progression to be captured. Furthermore, with aging, the real permittivity value changes to a lower value and the relaxation peak in imaginary permittivity with respect to frequency shifts to a lower frequency. The physics behind this dielectric measurement method has been understood in the context of analyzing the prepreg’s cure kinetics parameters, which has been investigated using differential scanning calorimetry. Overall, this simple dielectric-based monitoring technology will provide confidence in the future use of degraded or out-of-life raw material systems for manufacturing.
Introduction
Through the decades, fiber-based reinforced plastic (FRP) composites have been successfully used for a wide variety of engineering applications as an alternative over many conventional materials as there is a significant enhancement in the structural, mechanical, and tribological properties of fiber-reinforced composite material.1–3 However, manufacturing fiber-reinforced composite is associated with many challenges. Prepreg, or pre-impregnated reinforcing fabric, is the most reliable raw material for composite manufacturing. 2 Using prepreg has a good advantage as it assures the perfect ratio of resin to fabric.4,5 The challenge in working with prepreg is that the prepreg quality begins to deteriorate when exposed to room temperature.6,7 Manufacturing of large-scale parts requires a long time for a lay-up which might cause chemical aging of the epoxy resin system. Understanding the cure mechanism and cure kinetics behavior during prepreg aging is critical to solving this challenge. Developing a tool that can effectively monitor prepreg quality and verify that it meets manufacturing standards is essential. In recent times, differential scanning calorimetry (DSC) and IR spectroscopy have been widely used to monitor prepreg aging, and this method can be helpful in understanding the curing mechanism.8–11 Olivia et al. demonstrated in their study that DMA analysis is a technique capable of comprehensively characterizing prepreg aging and its effects on the final composite part. 12 However, both DMA and DSC are destructive testing methods which is an expensive and time-consuming process. 8
Many thermophysical characteristics (e.g, glass transition, tan delta) can be measured via DSC, which act as a prepreg aging indicator. However, these thermo-physical properties may behave differently in different matrix systems. One study showed that the glass transition temperature changed linearly during aging for toughened epoxy resin systems (CYCOM 5320). 13 However, Firgioni et al. didn’t find any difference in glass transition temperature with aging for bismaleimide matrix prepreg. 14 In another study, tangent delta curves from DSC data were studied for tetra glycidyl-4,40-diaminodiphenyl resin system, and no significant differences were seen for aged prepregs. 15 Recently, dielectric analysis has been used for cure monitoring, which requires measuring ion viscosity by heating the sample to cure temperature. Aside from monitoring the aging process, several studies have been conducted to explain the impact of prepreg aging on the mechanical properties of the composite part.16–18 Ji et al. demonstrated that there was no clear relationship between mechanical properties and prepreg aging. According to their findings, the flexural and tensile properties of laminates made from aged prepregs were poor and more unpredictable than those made from nonaged prepregs. 8 On the other hand, Cole et al. observed that aging did not affect the tensile strength of a composite part, but it reduced the compressive strength. 9 Both Joao Pedro et al. and Akay et al. found that prepreg aging had no significant effect on the interlaminar shear, flexural, compressive, and tensile modulus of as-cured composites.6,19 However, according to Pedro et al., prepreg aging severely reduces its adherence and flexibility, preventing its use with traditional lay-up methods. 6 Another research showed that carbon fiber/epoxy composite made from aged prepreg exhibits inconsistent behavior and a slight loss of tensile strength. 20 In most cases, the manufacturer recommends a freezing temperature of −18°C when storing prepreg. 21 When prepreg is left out at room temperature past its out-life, the epoxy resin reacts with the crosslinking agent, forming an insoluble thermosetting polymer. This slow curing process at room temperature increases the crosslinking density of the prepreg system. As a result, during prepreg aging at room temperature, molecular mobility is severely reduced as the amount of crosslinking increases, resulting in a drop in reaction rate dramatically. 22 As a consequence of the low reaction rate, curing of aged prepreg is challenging, and the final product may fall short of expectations. Besides, when the prepreg expires, the materials are typically wasted, resulting in a loss of millions of dollars and associated environmental pollution, which has raised a strong concern regarding the accumulation of plastic waste in the environment.1,2 In this study, frequency sweep-based broadband dielectric spectroscopy (BbDS), has been explored to monitor prepreg aging, which could be a time-efficient, nondestructive, and useful technique for industry use. It also provides a prediction of the mechanical strength of the final product as a measure of prepreg aging. This could allow in the reuse of prepregs that have reached the end of their useful life. This technique requires the application of a sinusoidal electric field over the sample to measure the prepreg’s complex permittivity at different frequencies. Aside from that, different cure kinetic parameters were examined and compared using DSC to study the effect of aging on these parameters. The chemical shift during aging has been studied using Fourier transform infrared spectroscopy (FTIR). Finally, the tensile and flexural strengths of the final composite part made up of different aged prepregs were examined and correlated with the prepreg’s dielectric data. The novel aspect of this study is that the dielectric properties of the prepreg system can be used to monitor prepreg aging and predict the tensile strength of composites made from aged prepreg.
Materials and methods
In this experiment, glass fiber epoxy-based thermoset prepreg was used to investigate the impact of prepreg aging on the cure kinetics and mechanical properties of a composite product. The prepreg samples were kept at room temperature for up to 40 days in order to study their aging. Each sample was placed in a separate airtight bag and stored at ambient temperature (25°C) to prevent samples from adhering to one another and the inclusion of contaminants. Compression molding was used to manufacture composite panels in order to study the influence of aging on mechanical properties. The composite panel was manufactured by stacking four plies of prepreg lamina with 0° fiber orientation. Compression molding is most useful for producing complex polymer objects reinforced with fiberglass. 23 After constructing the composite panel, 8-by-1-inch tensile test specimens were cut. 24 All tensile samples were cut at 45° so that tensile load would predominantly induce matrix damage.
Differential scanning calorimetry
Differential scanning calorimetry measures the heat required to raise the unit temperature.
25
DSC-25 from the TA instrument has been used to carry out all the tests. The sample weights are maintained in the range of 5–15 mg. The tests were performed for the dynamic DSC scan from room temperature to 200°C at different heating rates of 5°, 10°, and 15°C. The glass transition was measured using a double scan. The heat flow as a function of temperature and time was achieved from the DSC result. From this thermograph, the enthalpy is calculated by integrating the area under the peak. The total heat of the reaction can be denoted by HT. As the prepreg is heated at a constant heating rate, the conversion of the resin occurs. Using the reaction rate law, one can calculate the conversion rate.

Here, K is the rate constant which depends on temperature, and f(α) is a conversion-dependent function that defines the concentration of reactants in the reaction. The rate constant can be written in Arrhenius form.


Here, A is a frequency factor that defines the collision of atoms with increasing temperature. 26 +E a corresponds to the activation energy, which is the minimum amount of energy required to start a reaction, and R is the universal gas constant.
From the DSC measurement, the conversion and conversion rate can be calculated using the heat of reaction. The degree of conversion can be written as follows.
27


Kissinger method and Flynn–Wall–Ozawa method
According to the Kissinger model, the maximum reaction rate (dα/dt) is observed at the temperature, Tp where a peak is observed in the DSC thermograph.

Here, β is the different heating rate used in the DSC experiment. The kinetics parameters can be measured by plotting ln(β/Tp2) as a function of 1/Tp . The activation energy and pre-exponential factor can be calculated from the slope and the intercept of the Y-axis, respectively. 28
Ozawa developed a new approach to measure the activation energy based on further experimental analysis. A very simplified form of the Ozawa equation can be written in the following form
29

According to the Ozawa equation shown in equation (8), the value of activation energy can be calculated from the plot drawn ln(β) against [−1.0516/(RT)].
The Borchardt and Daniels method
The Borchardt and Daniels (B/D) kinetics approach permits the calculation of activation energy (Eα), pre-exponential factor (A), the heat of reaction (H), reaction order (n), and rate constant (k) from a single DSC scan. The Borchardt and Daniels approach assumes that the reaction follows nth-order kinetics and obeys the general rate equation
28


Equation (10) can be compared with the z = a + bx +cy where z = ln(dα/dt), a = ln(A), b = Eα/R, x = 1/T, c = n, and y = ln (1 – α). By using the multiple linear regression method, the activation energy, ln(A), and reaction order can be calculated, while the parameters dα/dt, T, and α are determined from the DSC exotherm.
30

In equation (11), dH/dt is the heat flow, H total is the total heat of reaction that has been calculated by integrating the area of the exothermal peak in thermograph, H rest is the reaction heat that develops over the temperature T.
Willard’s data analysis method has been used to calculate the reaction order from the DSC thermograph, described in.30–32
Crane equation
The reaction order can be calculated from the Crane equation. First, the activation energy and pre-exponential factor were calculated using the KAS and Ozawa methods. These values are directly applied in the crane equation to measure the reaction order.
33

To simplify, the equation was integrated into the following

The plot of this equation will result a linear fit, and the reaction order can be calculated from the slope of the line. 33
Fourier transform infrared spectroscopy
Fourier Transform Infrared Spectroscopy (Nicolet-6700) was used to monitor the chemical shifts in the prepreg. All the scans were collected with a resolution of 4 cm−1. The data were collected at wavenumbers ranging from 4000 cm−1 to 650 cm−1. A spectrum is produced by making the average of the absorbance values at each wavenumber scanned by the 32 scans. The simple bear’s law was used to get an estimated idea of how the concentration of epoxide functional group changes with aging.
Broadband dielectric spectroscopy
NOVOCONTROL dielectric impedance spectroscopy was utilized to measure prepreg’s dielectric properties. During the experiment, the sample is placed between two electrode blocks to form a simple parallel plate capacitor. The alpha analyzer assessed the sample’s dielectric property after applying a voltage (1V) with variable frequency. A phase shift between current and voltage occurs that can be measured by the phase angle. The phase shift of voltage (Uo) and current (Io) can be expressed by the following expression.


Here


The impedance of the sample capacitor can be expressed as follows

Again

The permittivity can be calculated from the following expression if we know the capacitance of empty sample capacitor

And

In heterogeneous systems, various interfaces, inclusion forms, and vector directions of an applied electrical field drive the number of dielectric relaxation processes. 34
Havriliak–Negami model
Havriliak and Negami (HN) expression has widely been used in polymer/composite analysis. According to this model, complex permittivity, real permittivity, and imaginary permittivity can be written as follows.
35


Havriliak–Negami model is a modified version of Debye’s model where two shape parameters (0 ≤ α < 1 and 0 < β) were added to properly describe the asymmetry of the loss peak. 35
Mechanical testing
Tensile test and flexural test
The MTS Landmark unit was used for tensile testing. The gauge length and grip length were maintained at 5 inches and 1.5 inches, respectively, in accordance with the ASTM D3039/D3039 M standard.
24
An inhouse made micro-tensile tester was used to measure the flexural strength, the flexural strength shows the consistency of the resin since the load is borne mainly by the resin system, and it also measures the overall bending tension that can be withheld by the samples.
38


Here, in equation (26), σ is the flexural stress, P is the maximum force of breaking, L is the span length, b is the width, and h is the thickness. In equation (27), G is the shear modulus, and m is the slope of the stress-strain curve. The loading rate was maintained in the order of 10 mm/min, and the thickness and span length ratio was kept at 1:32 following ASTM D 7264/D 7264M -07 standard. 38
Results and discussion
Resin content analysis
Resin content measurement of prepreg.

Cure kinetics analysis
Using a dynamic DSC scan and comparing the thermograph of aged prepregs with nonaged prepregs, the degradation state of the prepregs can be analyzed. Figures 1(a) and (b) shows the dynamic DSC scan for different aged prepregs. DSC thermograph- representation of peak shifting at different heating rates (5°C/10°C/15°C) for (a)non-aged prepreg, and (b) 40-days aged prepreg (c) Kissinger Method - In(β/Tp^ 2) vs 1000/T and b) Flynn-Wall-Ozawa Method- In(β) vs 1000/T for calculating the cure kinetics parameters.
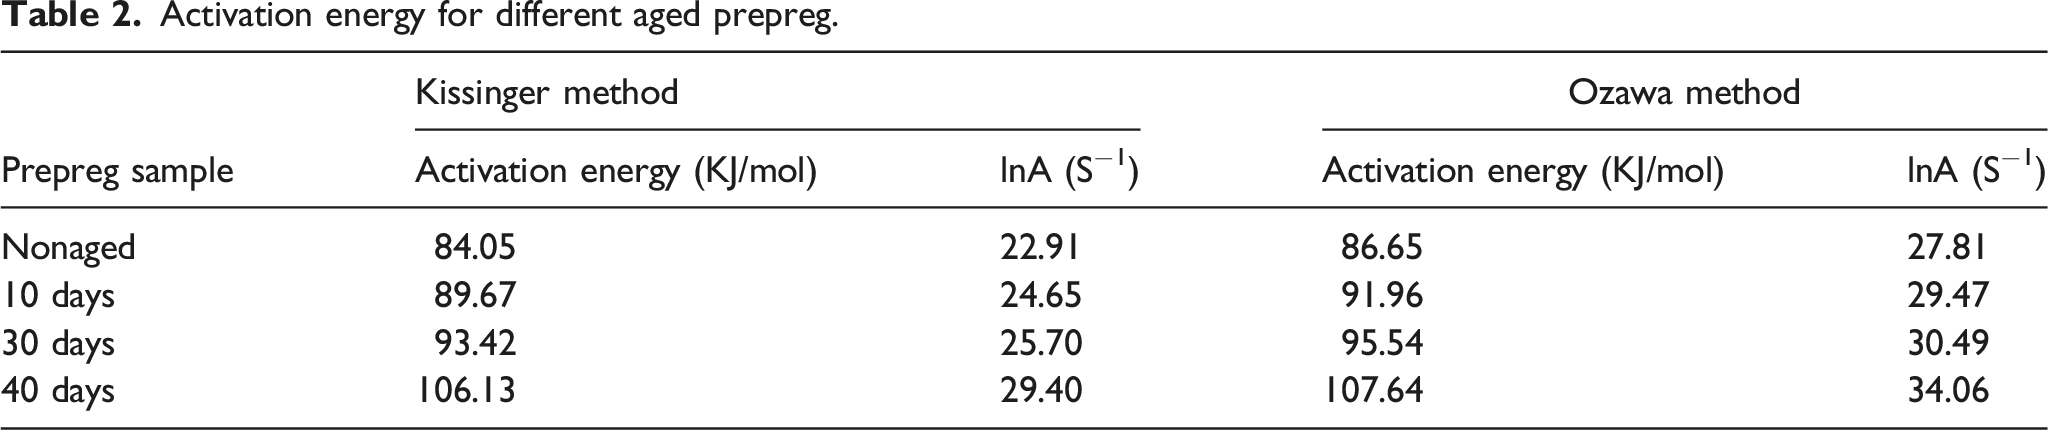
Activation energy for different aged prepreg.
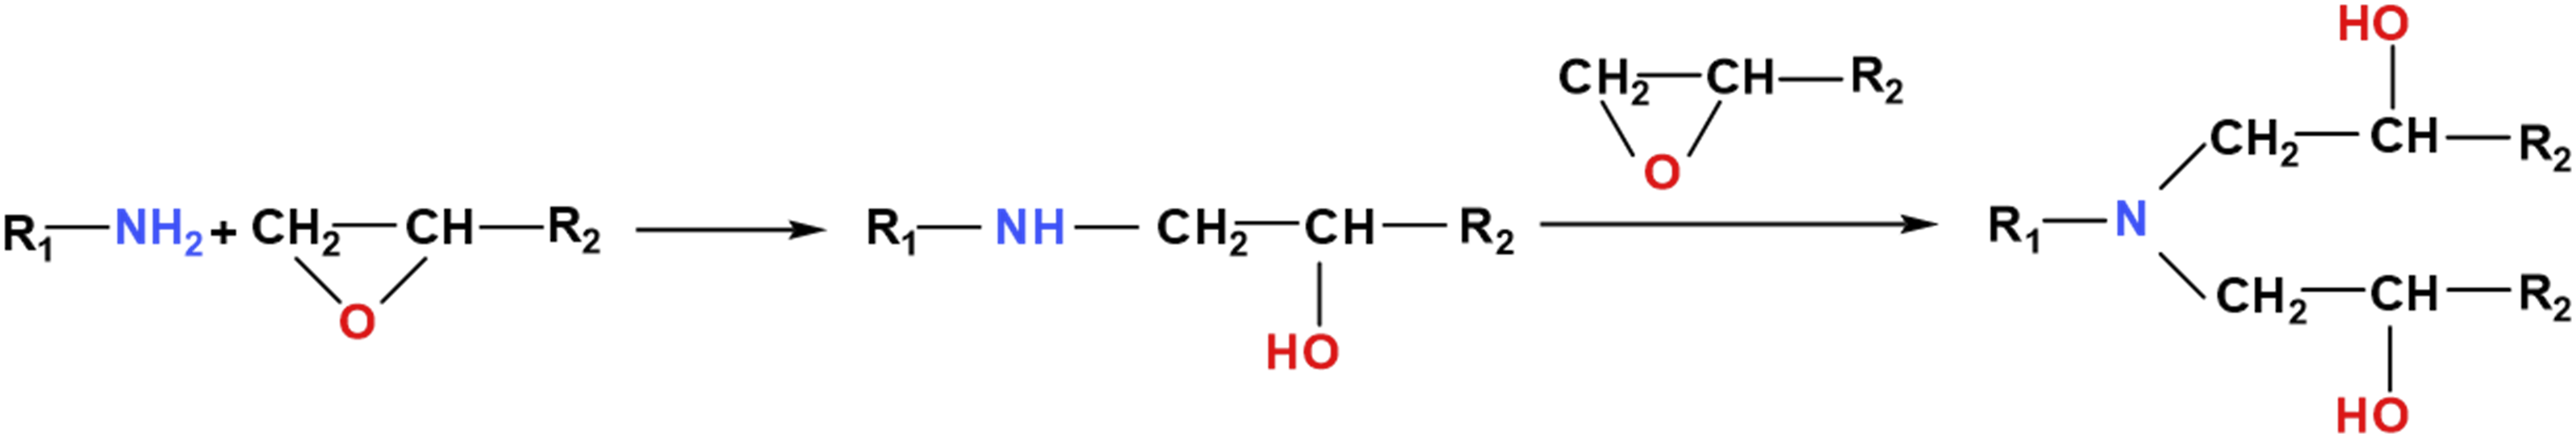
Epoxy and amine based hardener reaction scheme. 46
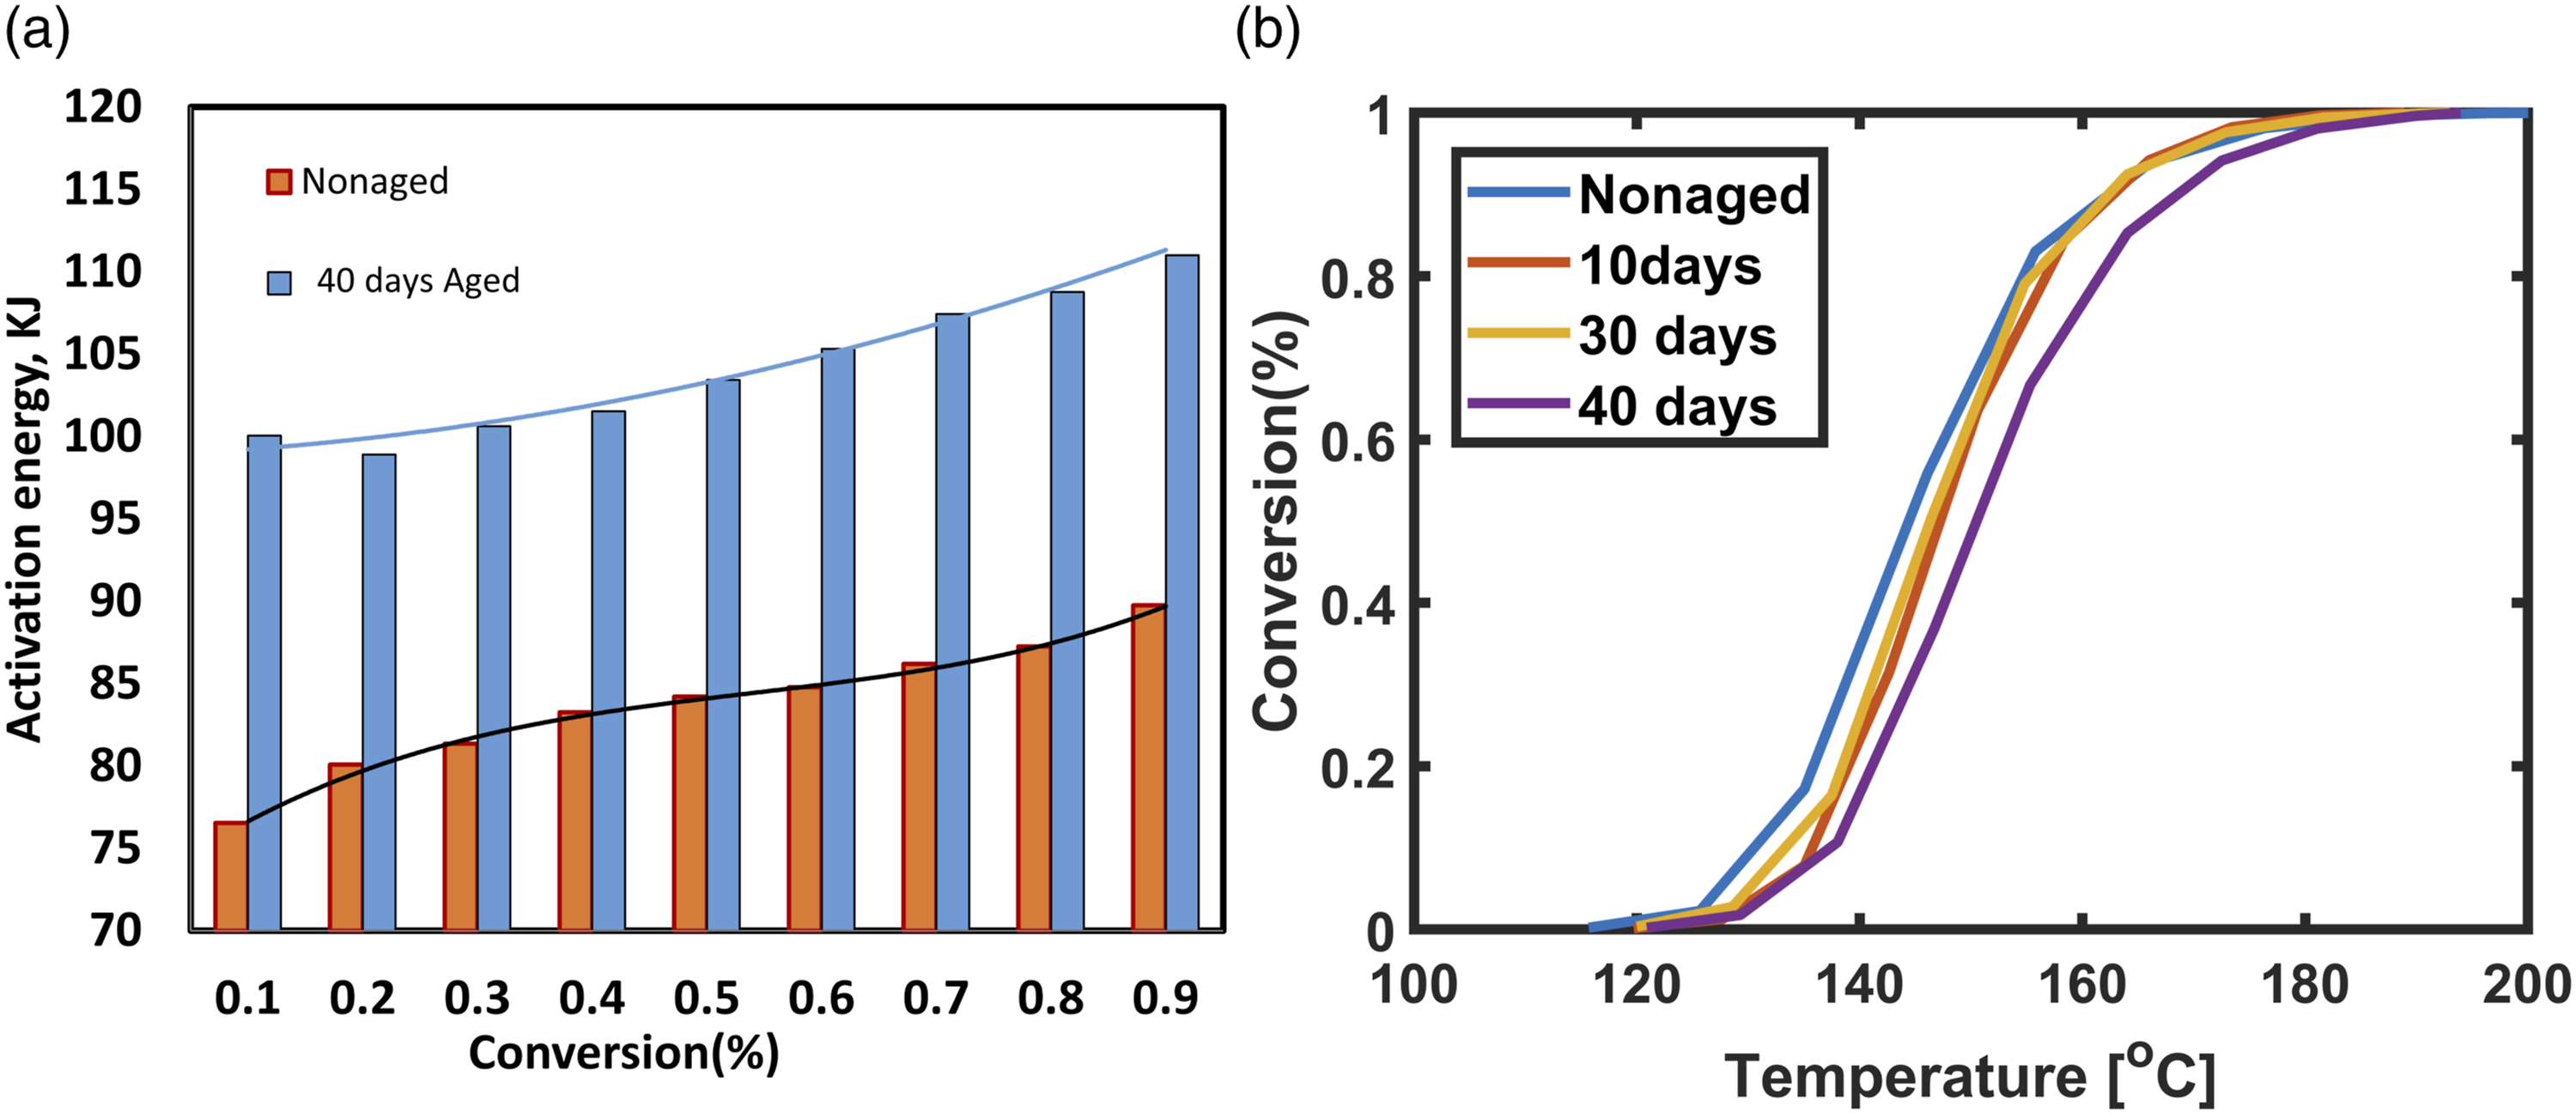
(a) Activation energy change with resin conversion. (b) Conversion of resin with temperature.
Figure 3(b) shows the conversion of epoxy resin with temperature. The conversion curve shifted to higher temperatures for aged prepreg. The activation energy of aged prepreg is higher, implying that resin system conversion requires more energy.
Using Borchardt and Daniel’s model and applying Willard’s data analysis method, the reaction order has been calculated from the best linear fit to the data of log(k) vs. 1/T plot (Figure-4). The reaction order has been calculated and shown in Table 3. The average reaction order has been found to be around 1.14. The crane equation has also been used to recalculate the reaction order, and the reaction order has been found to be 0.92 on average. Due to the complex nature of the curing reaction, both data can be assumed true.
33
Arrhenius plot- log(K) vs. 1/T calculated from DSC data according to equation (11), the best linear fit to the data gives the reaction order. Reaction order and activation energy for aged prepreg from B/D model.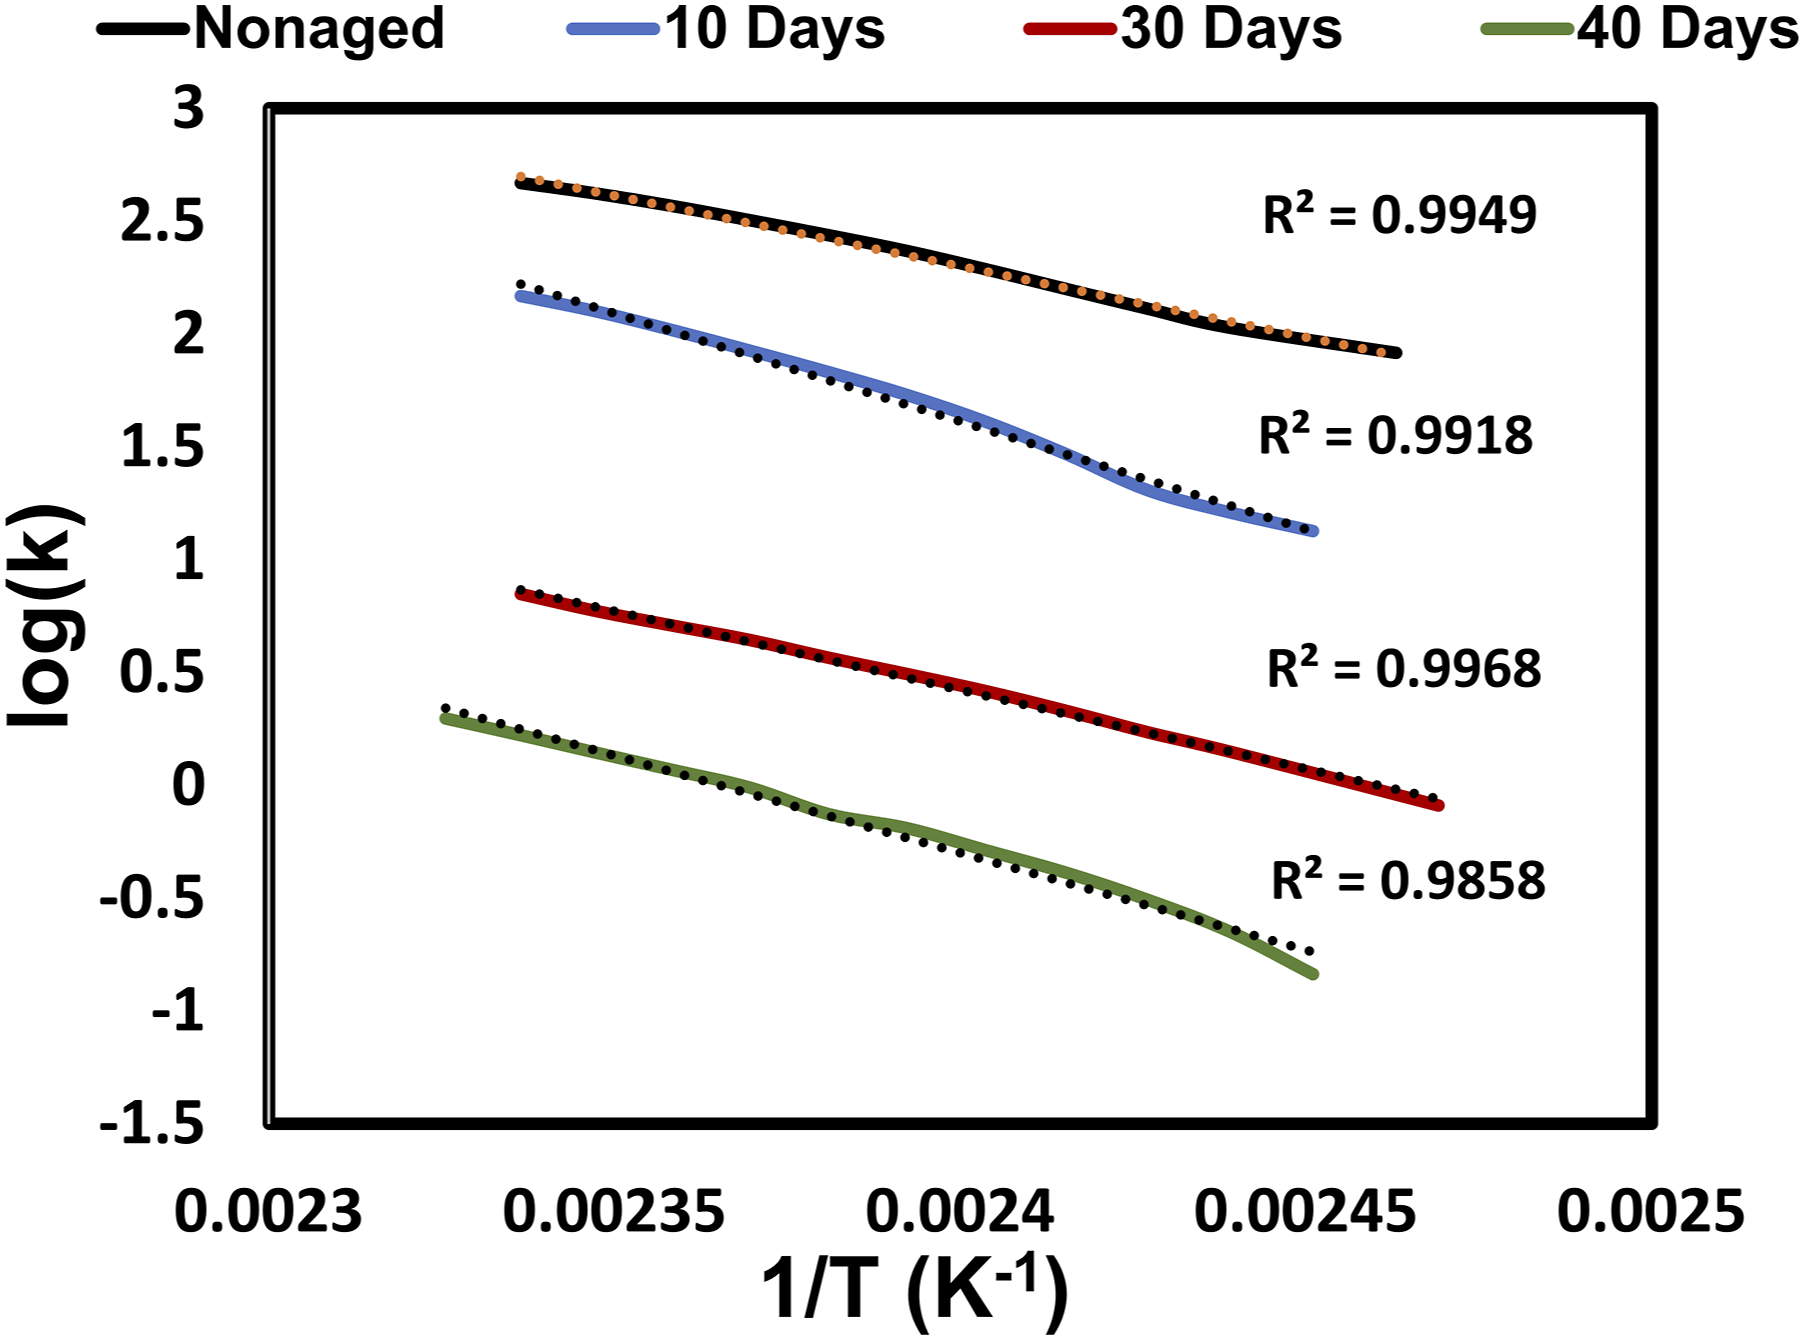

The change of enthalpy for different aged prepreg.

Enthalpy change during a cure reaction has an inverse relation with the aging of the samples. As crosslinking reaction progresses, more resin is converted, reducing the amount of uncured resin. This reduces the rate of cure reaction, which results in the reduction of enthalpy change.
The glass transition temperature of post-cured prepreg.

Fourier transform infrared spectroscopy analysis
From FTIR analysis (Figure 5), it has been found that the resin system in prepreg contains diglycidyl ether of bisphenol -A mixture (DGEBA). The peak observed at 911 cm−1 confirms the presence of the epoxide group, which occurs due to the stretching C-O of oxirane group;22,43 however, peaks at 2963 cm−1, 1579 cm−1, and 1505 cm−1 represent benzene ring which is also a constituent of DGEBA.43,44 It has been found that the epoxide functional group decreases with aging. The signals at the frequency range of 1500 cm−1 to 1650 cm−1 are attributed to the presence of amine in the hardener.
22
However, according to the reaction (Figure 2), the crosslinking occurs due to the epoxide conversion, and primary amino groups in the hardener transform sequentially into secondary and tertiary amino groups. By comparing the peak area at 911 cm−1 wavenumber, an estimated change in the concentration of epoxide group has been calculated using simple beer’s law and with the help of TQ Analyst software. If the epoxide group concentration in the nonaged prepreg is assumed to be 100%, the variations in the epoxide group concentration in aged prepregs have been shown (Table 6). (a) FTIR spectra for nonaged prepreg (b) FTIR spectra for different aged prepreg for comparing the epoxide functional group. Estimated concentration of epoxide group for different aged prepreg.

Dielectric properties analysis
Cure advancement of aged prepregs can be monitored using DSC by monitoring the reaction heat or the shift in enthalpy, but it’s not always feasible due to long experimental procedure and destructive nature of the test. Besides, multiple samples should be prepared for the test, and the weight shouldn’t exceed 10–15 mg. But this small value may not reflect the whole prepreg system. In this research, we used BbDS to analyze the dielectric property of prepregs, which, being a nondestructive test, can be used to understand the degradation condition of aged prepregs. Figure 6 shows the real permittivity curves for different aged prepregs at various frequencies. It was found that aged prepreg has a lower real permittivity value than nonaged prepreg. Nandini et al. showed that the dielectric strength of prepregs decreased with the aging effect.
45
The same results have been found while measuring the dielectric strength of the aged prepreg (Table 7). Curve fitting of experimental data using the HN equation has been used to determine the relaxation time and other parameters. These phenomena can be explained by the presence of a ring-like structure in the resin system. From FTIR data, we found the presence of epoxide (oxiranes) ring structure in the resin system. Two carbon atoms and one oxygen atom in the epoxide group are connected by s bonds. Because of the strong electronegativity of the O atom, both C-O bonds are polar.
46
Consequently, nonaged prepreg showed a high dielectric constant value due to polarity caused by the presence of a strong electronegative O atom and the fact that carbon atoms in an epoxide group are reactive electrophiles.
47
This ring, however, breaks down with aging, and carbon atoms link to nitrogen, reducing polarity. As a result, the real permittivity value falls for aged prepreg. Real permittivity of (a) non-aged (b) 10 days aged (c) 30 days aged (d) 40 days aged. Dielectric relaxation parameter for different aged prepreg.

Figure 7(a) shows the imaginary permittivity curve of different aged prepreg samples. It has been observed that, as the level of curing increases, the dielectric loss peaks (imaginary permittivity) shift towards lower frequencies. (a) Imaginary permittivity and (b) Imaginary modulus curve for different aged prepreg with various frequency.
Peak height change in dielectric loss curve.
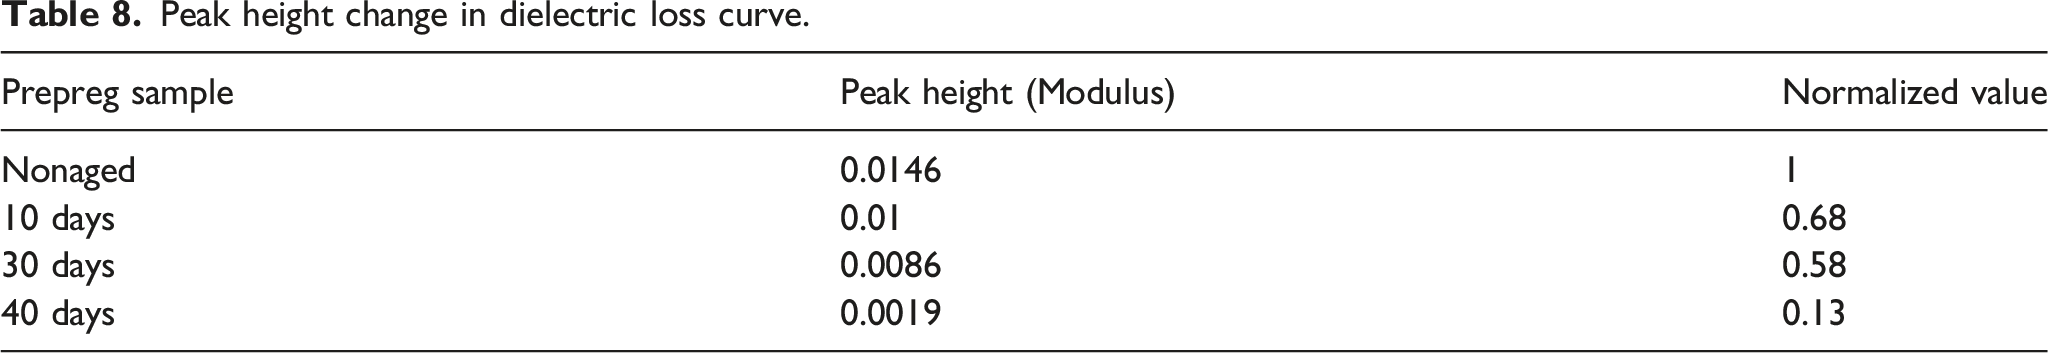
Figure 7(a) also shows a peak around 100–1000 Hz, which can be referred to as the relaxation process because of the orientational polarization of the polymer chain. 49 The peak in the imaginary dielectric permittivity is caused by gamma relaxation. This relaxation was attributed to local movements of dipoles in unreacted components. 50 During the BbDS experiment, when AC electric field was applied, the electric field direction was altered with a certain frequency. The molecules inside the material also change their dipole direction with the alternating electric field. This phenomenon is called orientational polarization. This type of polarization usually occurs when the frequency range of AC current fluctuates between 100 and 106 Hz.45,51 In general, the dipoles move faster to maintain the direction with changing electric fields at higher frequencies. However, the atoms inside the material have inertia, which causes a reluctance to move with a changing electric field. So, the molecules work against the electric field at higher frequencies causing a loss known as dielectric loss. When the polymer chain gets large due to the crosslinking process, even at lower frequencies, polymer chains show reluctance to orientate with the electric field, increasing the relaxation time. So, the orientational dielectric loss shifts at a lower frequency for aged prepregs. Also, due to higher relaxation time and a rapidly changing electric field (high frequency), the crosslinked polymer chains were not able to align with the field in terms of very small peaks occurring at high frequency. For 40 days aged prepreg, the calculated relaxation time is higher, and no notable relaxation peaks were identified. For clear visualization of the peak, the modulus has been calculated, which is the reciprocal of the complex permittivity value, and the data plotted with respect to the corresponding frequency. Figure 7(b) shows the relaxation peak for different aged prepreg, and the peak shifting towards lower frequency is clearly visible in this plot. Also, as the prepreg aged, the peak height from the corrected baseline decreased, which is another good indicator of prepreg degradation Table 8.
Mechanical performance analysis
In this study, composite panels were manufactured from different aged prepregs. The average tensile strength has been found at 65.07 MPa for the composite part manufactured from nonaged prepreg. The test results show a decreasing trend in tensile strength with the aging effect (Figure 8(a)). (a) Tensile strength of composite sample made from different aged prepreg (b) Flexural strength and shear modulus of different aged prepreg.
The decreasing tensile strength can be explained by the nonuniform resin distribution in the composite sample. Since storage at room temperature accelerates the crosslinking reaction, some portions of the prepreg are already cured while other parts are still uncured. As a result, the resin cannot flow uniformly during the actual curing process of the aged prepreg, resulting in uneven resin content in the manufacturing composite part. Also, residual stress from uneven resin distribution can affect the mechanical performance. During the experiment, it has been found that the tackiness is also reduced in aged prepreg, which influences the sample thickness slightly. This is due to the various foreign particles and some cured resin particles scattered on the surface layer of the aged prepreg laminate, which hinders the adhesion between prepreg layer, lowering the tackiness (Figure 9). SEM image of (a) Nonaged prepreg and (b) aged sample with 100 micron scale.
The glass transition temperature of composite samples made from aged prepreg drops to a lower value, implying lower crosslinking density. Because aged prepreg has a higher activation energy, it takes more energy to crosslink distant crosslink sites. Aside from that, moisture absorption during storage in a room environment can affect the mechanical properties of the composite and cause the composite part to delaminate. 52
In our experiment, we used another method for prepreg aging. Another method involved aging the prepreg after layup, assembling all the laminates rather than using individual laminates, and store them at room temperature. In this process, the composited part exhibited higher tensile strength (Figure 10(a)). This occurs as a result of crosslinking between prepreg layers that took place during stacking and storage, which improved inter-laminar adhesion. Due to these inter-laminar crosslinking, more effective load distribution was possible during tensile loading, exhibiting marginally higher tensile strength.
The flexural stress was measured with a micro universal testing machine per ASTM D7264. In contrast to nonaged prepreg, aged prepreg had less flexural strength (Figure 8(b)). The declining flexural performances of aged samples can be attributed to an increase in activation energy and a decrease in glass transition temperature.
53
Though some result is not consistent with the aging days, more experimental data are required to end up with precise conclusions. (a) Comparison of the tensile strength of composite sample made from the prepreg- aged separately before lay-up and aged after lay-up. (b) Correlation between tensile strength, dielectric relaxation strength, and relaxation time.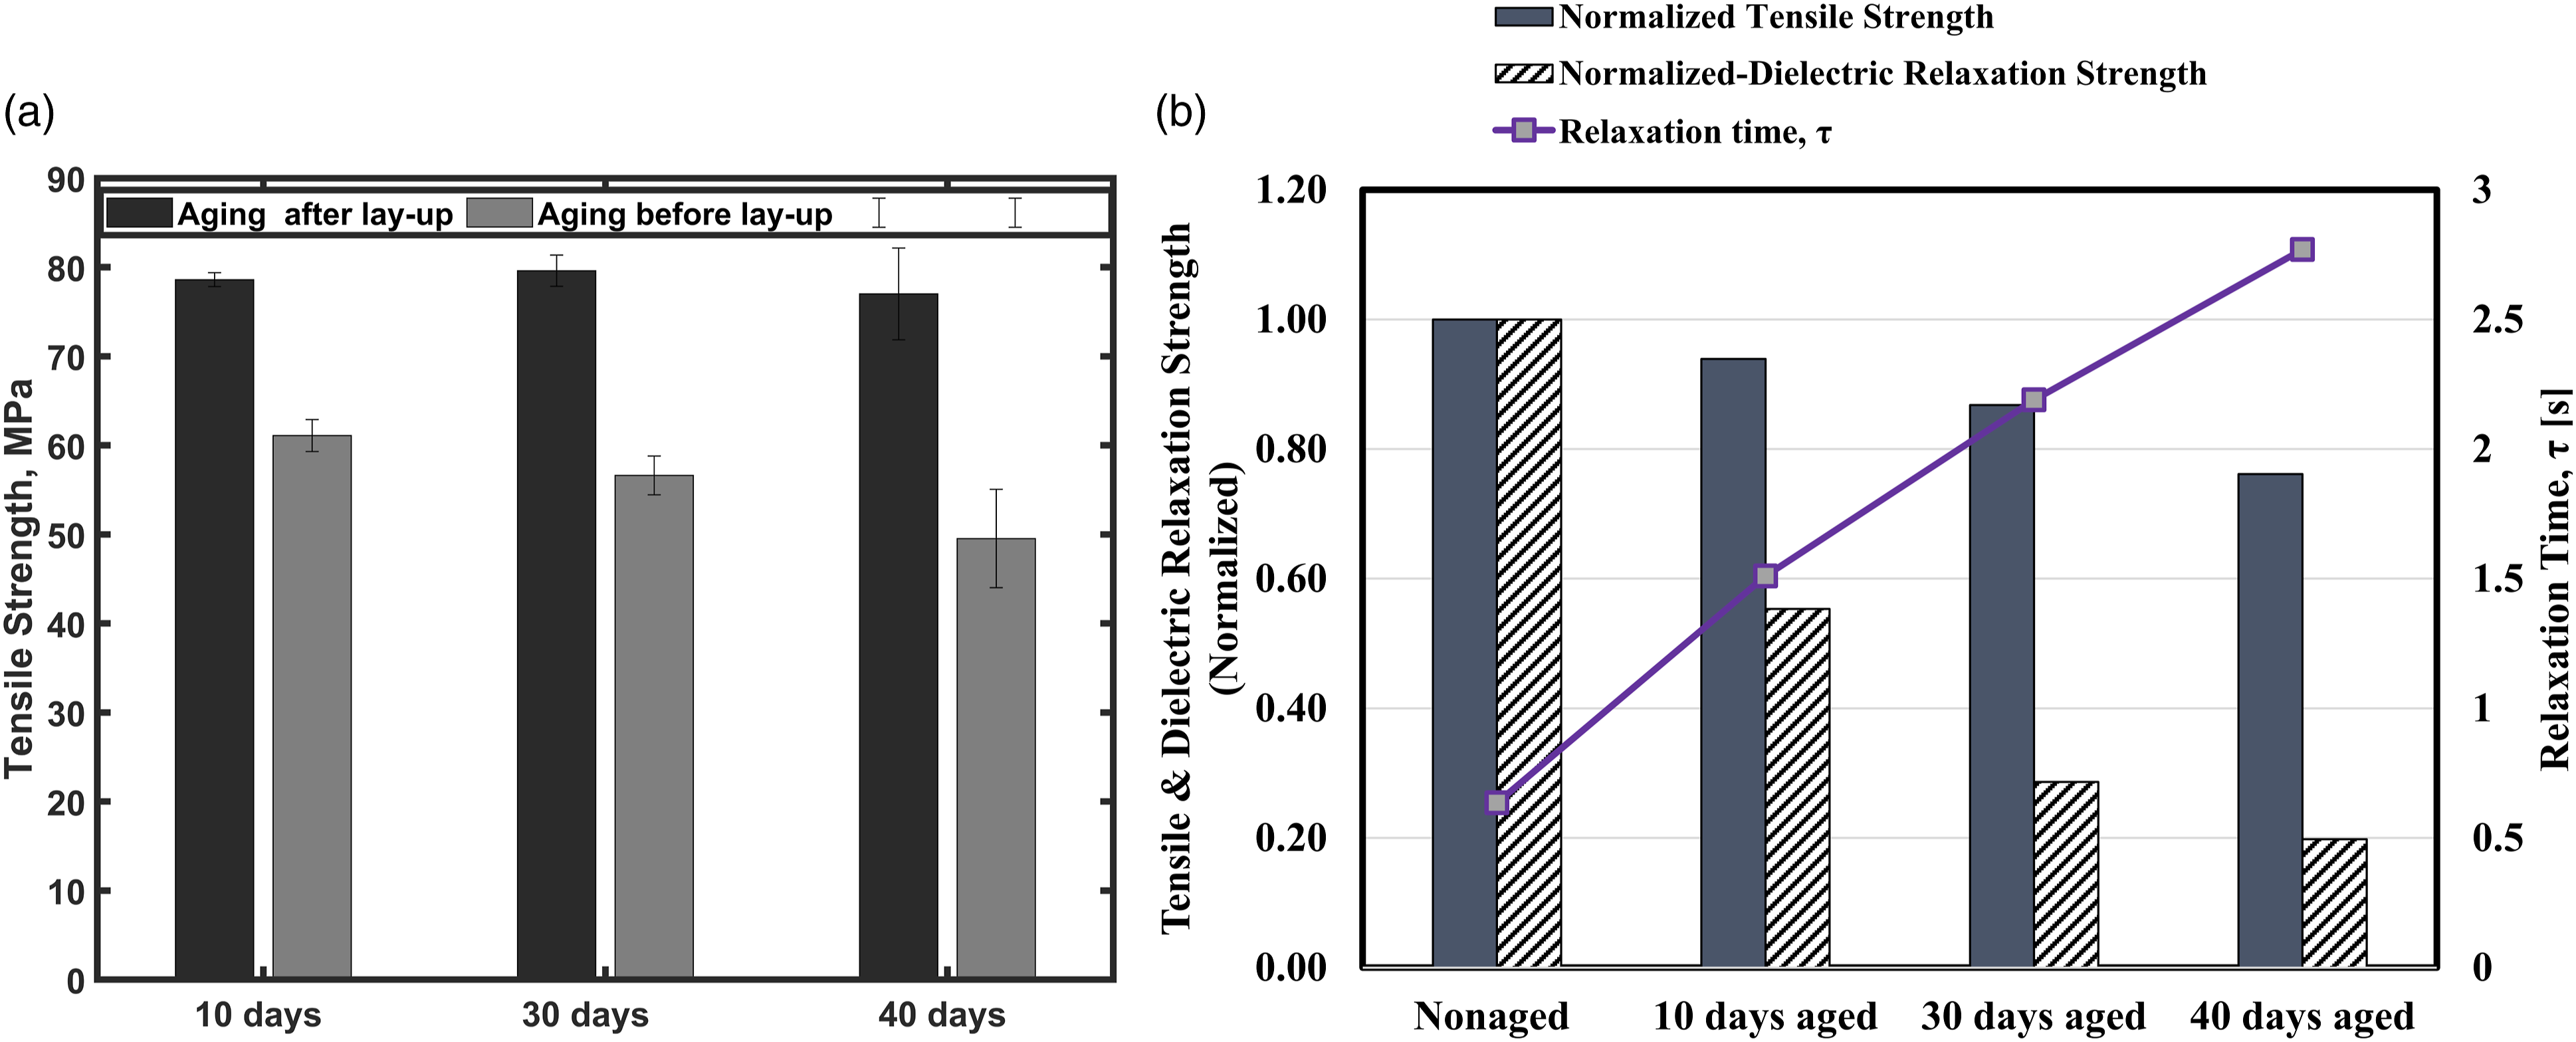
Finally, the tensile strength of the final composite has been correlated with the dielectric relaxing strength and the prepreg relaxation time (Figure 10(b)). Based on the correlation, prepreg systems with lower relaxation times and higher relaxation strengths yield composite panels with higher tensile strengths
Conclusion
Many industries utilize prepregs for composite manufacturing because of the simpler and faster manufacturing process. Prepregs are often abandoned when their out-life ends, costing millions and affecting the environment. A simple method to monitor prepreg aging/degradation is needed which could increase the confidence of using prepreg that has reached the end of its out-life. Considering the industry application, using BbDS tool to monitor the prepreg aging is a relatively more feasible and less time-consuming process. Relaxation time, dielectric strength, and the analysis of the dielectric loss curve can be reliable indicators of prepreg degradation status that can be measured easily and nondestructively. This study also evaluated the cure kinetics of aged prepreg, which helps understand how room temperature aging effects the curing process. Further investigation will enable the design of an optimal curing cycle or manufacturing strategy for aged prepreg. The mechanical performance of the final composite can be predicted based on the prepreg degradation circumstances. This study demonstrated the inconsistent tensile strength in the composite part made from aged prepreg. The tensile and flexural strength decreased as the prepregs aged, and this change can be anticipated by measuring the prepreg’s dielectric property before manufacturing. As a result, the dielectric analysis provides a straightforward way for monitoring prepreg aging/degradation, ensuring prepreg applicability or repurposing prepreg usage. In a subsequent study, we’ll use the dielectric analysis of the prepreg system to predict the mechanical performance of the composite quantitatively. During the experiment, the tensile strength has been observed to increase when prepreg lamina was used to lay up together and then stored for a few days at room temperature. Overall, this study supports the remaining useful properties of the out-of-life prepreg, reducing waste and allowing for a more sustainable composite industry.
Footnotes
Acknowledgements
The authors gratefully acknowledge the support of the Institute for Predictive Performance Methodologies at the University of Texas Arlington Research Institute (UTARI) and the Department of Mechanical and Aerospace Engineering, The University of Texas at Arlington. The authors are also thankful to Dr. Muthu Ram Prabhu Elenchezhian for his help in providing training on various tools and manufacturing processes.
Declaration of conflicting interests
The author(s) declared no potential conflicts of interest with respect to the research, authorship, and/or publication of this article.
Funding
The author(s) received no financial support for the research, authorship, and/or publication of this article.