
Abstract
This study focuses on the isolation, chemical and crystalline structures, and the kinetics of heterogeneous deacetylation of chitin from mud crab shells (Scylla serrata). The independent variables in this work are temperature, NaOH concentration, and reaction time. The degree of deacetylation (DD) of the resulting chitosan was determined for different reaction times. It was found that the DD increases nonlinearly with the reaction time. The deacetylation of the chitin followed pseudo first-order kinetics and it occurred in two stages, which are respectively attributed to the reaction of acetamide groups in the amorphous region on the external layer, and in the crystalline region inside the chitin particles. The rate constants for the latter stage of the deacetylation at 35°C, 75°C, and 105°C were 4.67×10⁻⁴ min−1, 3.00×10⁻³ min−1, and 4.61×10⁻³ min−1, respectively. Based on this temperature-dependent rate constant, the activation energy of the slow deacetylation stage was estimated to be 32.6 kJ mol−1.
Introduction
Chitin is a polymeric carbohydrate, consisting of a linear structure of β-(1→4)-N-acetyl-D-glucosamine monomers, which is found ubiquitously in nature mainly in crustacean shells, insect cuticles, and fungal cell walls.1-5 Chitin can also be found in arthropoda phylum like mollusks 6 and snails. 7 This biopolymer has unique natural structures and it is used in high-tech applications due to its biocompatibility, biodegradability, and non-toxicity. 8 Chitin is commonly converted to chitosan by removing the acetyl group. Chitosan has attracted considerable interests for drug delivery systems and medical applications.9,10 Although chitin can be chemically deacetylated using acids or bases, or using enzymatic processes,11,12 the chemical method is more practical and it is widely applied to produce chitosan in bulk for commercial purposes. It is noteworthy that the resulting chitosan is only obtained in its polymeric form when the hydrolysis is done in basic solutions. 13 In this condition, the hydroxyl (OH−) ions react with acetamide groups and generate a dianion intermediate species which converts into chitosan. 14 The structure of chitosan consists of randomly distributed β-(1→4)-N-acetyl-D-glucosamine and β-(1→4)-D-glucosamine residues. 12
Although the deacetylation reaction can be controlled by several parameters, the conversion from acetyl to amine groups is difficult to complete, and repetitive deacetylation is often required in order to achieve high conversion from chitin to chitosan. The extent of conversion of the acetyl groups can be expressed as the degree of deacetylation (DD), and is one of the important criteria of chitosan. 15 In addition, the amino group (pKa ∼7.0) of chitosan is deprotonated in basic conditions. 16 The DD and ionic state are significant with respect to the structural network, viscosity, performance, chemical modification, reactivity, biological activities, and applications of chitosan.17,18
Extraction and physicochemical characterization of chitin and chitosan derived from different species of crustacean, insects, fungi, and mollusks is still one of the important research topics related to biopolymers.1-5,19-25 Recently, we have demonstrated that the amount of chitin isolated from mud crab (Scylla serrata) shells is higher than that isolated from the shells of other crabs, shrimp shells, and cuttlefish. 26 This result suggests that this scarcely explored species of crab is a potentially rich source of chitin.26,27 Prolonged deacetylation converted the isolated chitin to chitosan with 84.7% yield, 28 which is higher than that of the deacetylation of chitin extracted from other crab and shrimp shells (53.0% and 74.5%). 28 This would open up the avenue for biotechnological applications due to the negligible allergenic substances in the estuarine, mangrove swamp, and freshwater crab shells. 24 Moreover, under the same deacetylation condition, the degree of acetylation (DA) of mud crab chitin (74.8%) was lower than that of chitin isolated from other crab and shrimp shells (78.6% and 88.5%), while the DD of the mud crab chitosan (88.5%) was higher compared to other crab and shrimp chitosan (83% and 88%). Although mud crab chitin and chitosan clearly showed different physicochemical properties from those derived from other crab and shrimp shells, as reported earlier in detail, 26 the fundamental aspect of the kinetics of deacetylation of the mud crab chitin remains a research challenge. The conversion from the mud crab chitin to chitosan should be established before considering of a large scale production of biopolymers from mud crab shells.
Therefore, the aim of the current work is to investigate the kinetics of deacetylation of the mud crab chitin. The objective is to evaluate the effects of the concentration of NaOH, the temperature, and reaction time on the deacetylation kinetics. Chitosan that formed after the deacetylation of chitin using different parameters were characterized using Fourier-transform infrared spectroscopy (FTIR), scanning electron microscopy (SEM), and X-ray diffraction (XRD), in addition to evaluation of their physicochemical properties. The effect of the above-named variables on the conversion from acetyl to amino functional groups and the DD of the resulting chitosan were determined.
Experimental
Chemicals
All chemicals, except chitosan, used in these experiments including HCl and NaOH were purchased from Sigma-Aldrich Co. and were used as received without any further purification. Throughout the experiments, double distilled water was used for washing and dilution. The 1 N HCl stock solution used in this study was prepared by serial of dilution of 37% fuming HCl, which is equivalent to 10.14 N. The 5% NaOH solution used in this study for the deproteinization process was prepared by dissolving 5 g of NaOH pellets in 100 mL of distilled water in a volumetric flask. The flask was gently shaken until all of the pellets were dissolved.
Preparation and demineralization of mud crab shells
Mud crabs were purchased from the local fish market in Brunei Darussalam. The crabs were thoroughly cleaned to remove dirt and mud from their surface. After cleaning, the crabs were de-shelled to remove the meat and the gills from the body and claws of the crab. The shells were collected and washed with water to remove residual meat and dirt. They were put in metal trays, and dried under the sun. The drying time depends the weather, but on sunny days the process takes up 2 days. In any event, the shells were dried until they achieved constant weight.
After drying, the shells were ground into smaller pieces using a mortar and pestle, allowing the shells to fit into a miller (Zojirushi Mill BM-RT08-GA), in which they were milled to a fine powder. The powdered shells then were sieved through a stainless-steel sieve with a 355-micron aperture (ISO23310-1). Particles that have the sizes less than 355 micron passed through the sieve and were collected in the receiver end. The shell particles that did not manage to pass through the sieve underwent another round of grounding before re-sieving. The crushed shells were stored in a dry container until they were used for experiments.
Isolation of chitin
The procedure for chitin extraction from the powdered shells involves demineralization and deproteinization steps. The powdered shells were demineralized with 1M HCl in a 1:40 (w/v) ratio whilst stirring for 3 h at room temperature. The sample was added slowly into an HCl solution to suppress the formation of carbon dioxide foam, which is spontaneously produced when the crab shells reacts with the acid. After 3 h, the precipitate was retrieved using vacuum filtration, followed by washing with distilled water. The demineralized crab shell was then dried overnight in an oven at 60–70°C and it was weighed the next day.
The dried demineralized shell powder was deproteinized using a 5% NaOH solution in 1:10 (w/v) ratio of shell powder to solution whilst stirring for 6 h at 90−95°C. After stirring the mixture was cooled down to a temperature at which it was safe enough to vacuum filtrate. The resulting chitin was washed with distilled water to remove any residues, followed by drying in an oven overnight at 60–70°C.
Deacetylation of chitin
The chitin obtained (1 g) was deacetylated using 15 mL of NaOH solution with different parameters, such as NaOH concentration and temperature. The NaOH concentration was set at 10, 20, 40, and 60% which is equivalent to 2.5, 5.0, 10, and 15 N, and the temperature was varied in the range of 35–105°C. The reaction kinetics were evaluated by monitoring the deacetylation at different stirring times between 0 to 300 mins. The deacetylated chitin obtained was isolated by vacuum filtration, and the precipitate was washed with distilled water several times until the solution was maintained at pH 7. Finally, the chitosan obtained was dried overnight in an oven at 60−70°C, and then collected and kept in desiccator until it was used in other experiments.
Characterization
The molecular weight of chitosan was estimated using the Mark-Houwink equation.29,30 The intrinsic viscosity of chitosan was determined from a linear plot of its kinematic viscosity as a function of the biopolymer concentration. The kinematic viscosity of the biopolymer was measured using an Ostwald U-tube viscometer. These procedures have been previously described. 26
The functional groups and chemical structures on the chitin and chitosan were analyzed using an FTIR spectrometer (IR Prestige-21, Shimadzu) in KBr discs. The FTIR spectrum was scanned (32 scans) in the range of 400–4000 cm−1 with a spectral resolution of 2.0 cm−1. The DD of chitosan was then determined based on the FTIR spectrum using the following formula
31

The crystallinity of chitin and chitosan was determined based on XRD patterns measured over a wide range of diffraction angle (10−70°) on an XRD-7000 (Shimadzu) with Cu Kα radiation (λ = 0.15418 nm). The surface morphology of the isolated chitin before and after deacetylation was determined using scanning electron microscopic (SEM) images recorded on a JSM-7600F (JEOL) operating at 30 kV.
Results and discussion
The kinetics of deacetylation of chitin
The kinetics and mechanisms of deacetylation of chitin have been described in many research reports, and they are described based upon the observed DD using different parameters, including the alkali concentration and temperature. 31 As the reaction occurs randomly in a homogeneous alkaline solution, there are few proposed kinetic mechanisms for the deacetylation reaction. 31 In general, as deacetylation can be considered as a non-catalytic liquid-solid reaction, the kinetics could be described by the shrinking core model. 31 This model is based on a hypothesis that deacetylation occurs at the liquid-solid interface. This implies that the external layer is deacetylated first, followed by acetyl groups that were initially deeper inside chitin particle. In the literature, the deacetylation of the acetamide groups on the external layer and those inside particle is empirically considered to be a first-order process.
As chitin was deacetylated using a basic solution, the deacetylation reaction can be described in the following equation
32


The concentration of chitin should reduce exponentially, and the above equation can be rewritten as

Integration of the above equation with limits of

Considering that

Figure 1 shows representative examples of FTIR spectra of chitosan upon deacetylation of chitin using 10 N NaOH at T=105°C, as a typical example of a kinetics run data-set. Based on the peak intensity at 1665 cm−1 and 3450 cm−1, the DD of the resulting chitosan were calculated. FTIR spectra of deacetylated chitin using 10 N NaOH at 105°C at different reaction times; (a) 0 min, (b) 30 min, (c) 60 min, (d) 90 min, (e) 120 min, (f) 150 min, (g) 180 min, (h) 210 min, (i) 240 min, (j) 270 min, and (k) 300 min.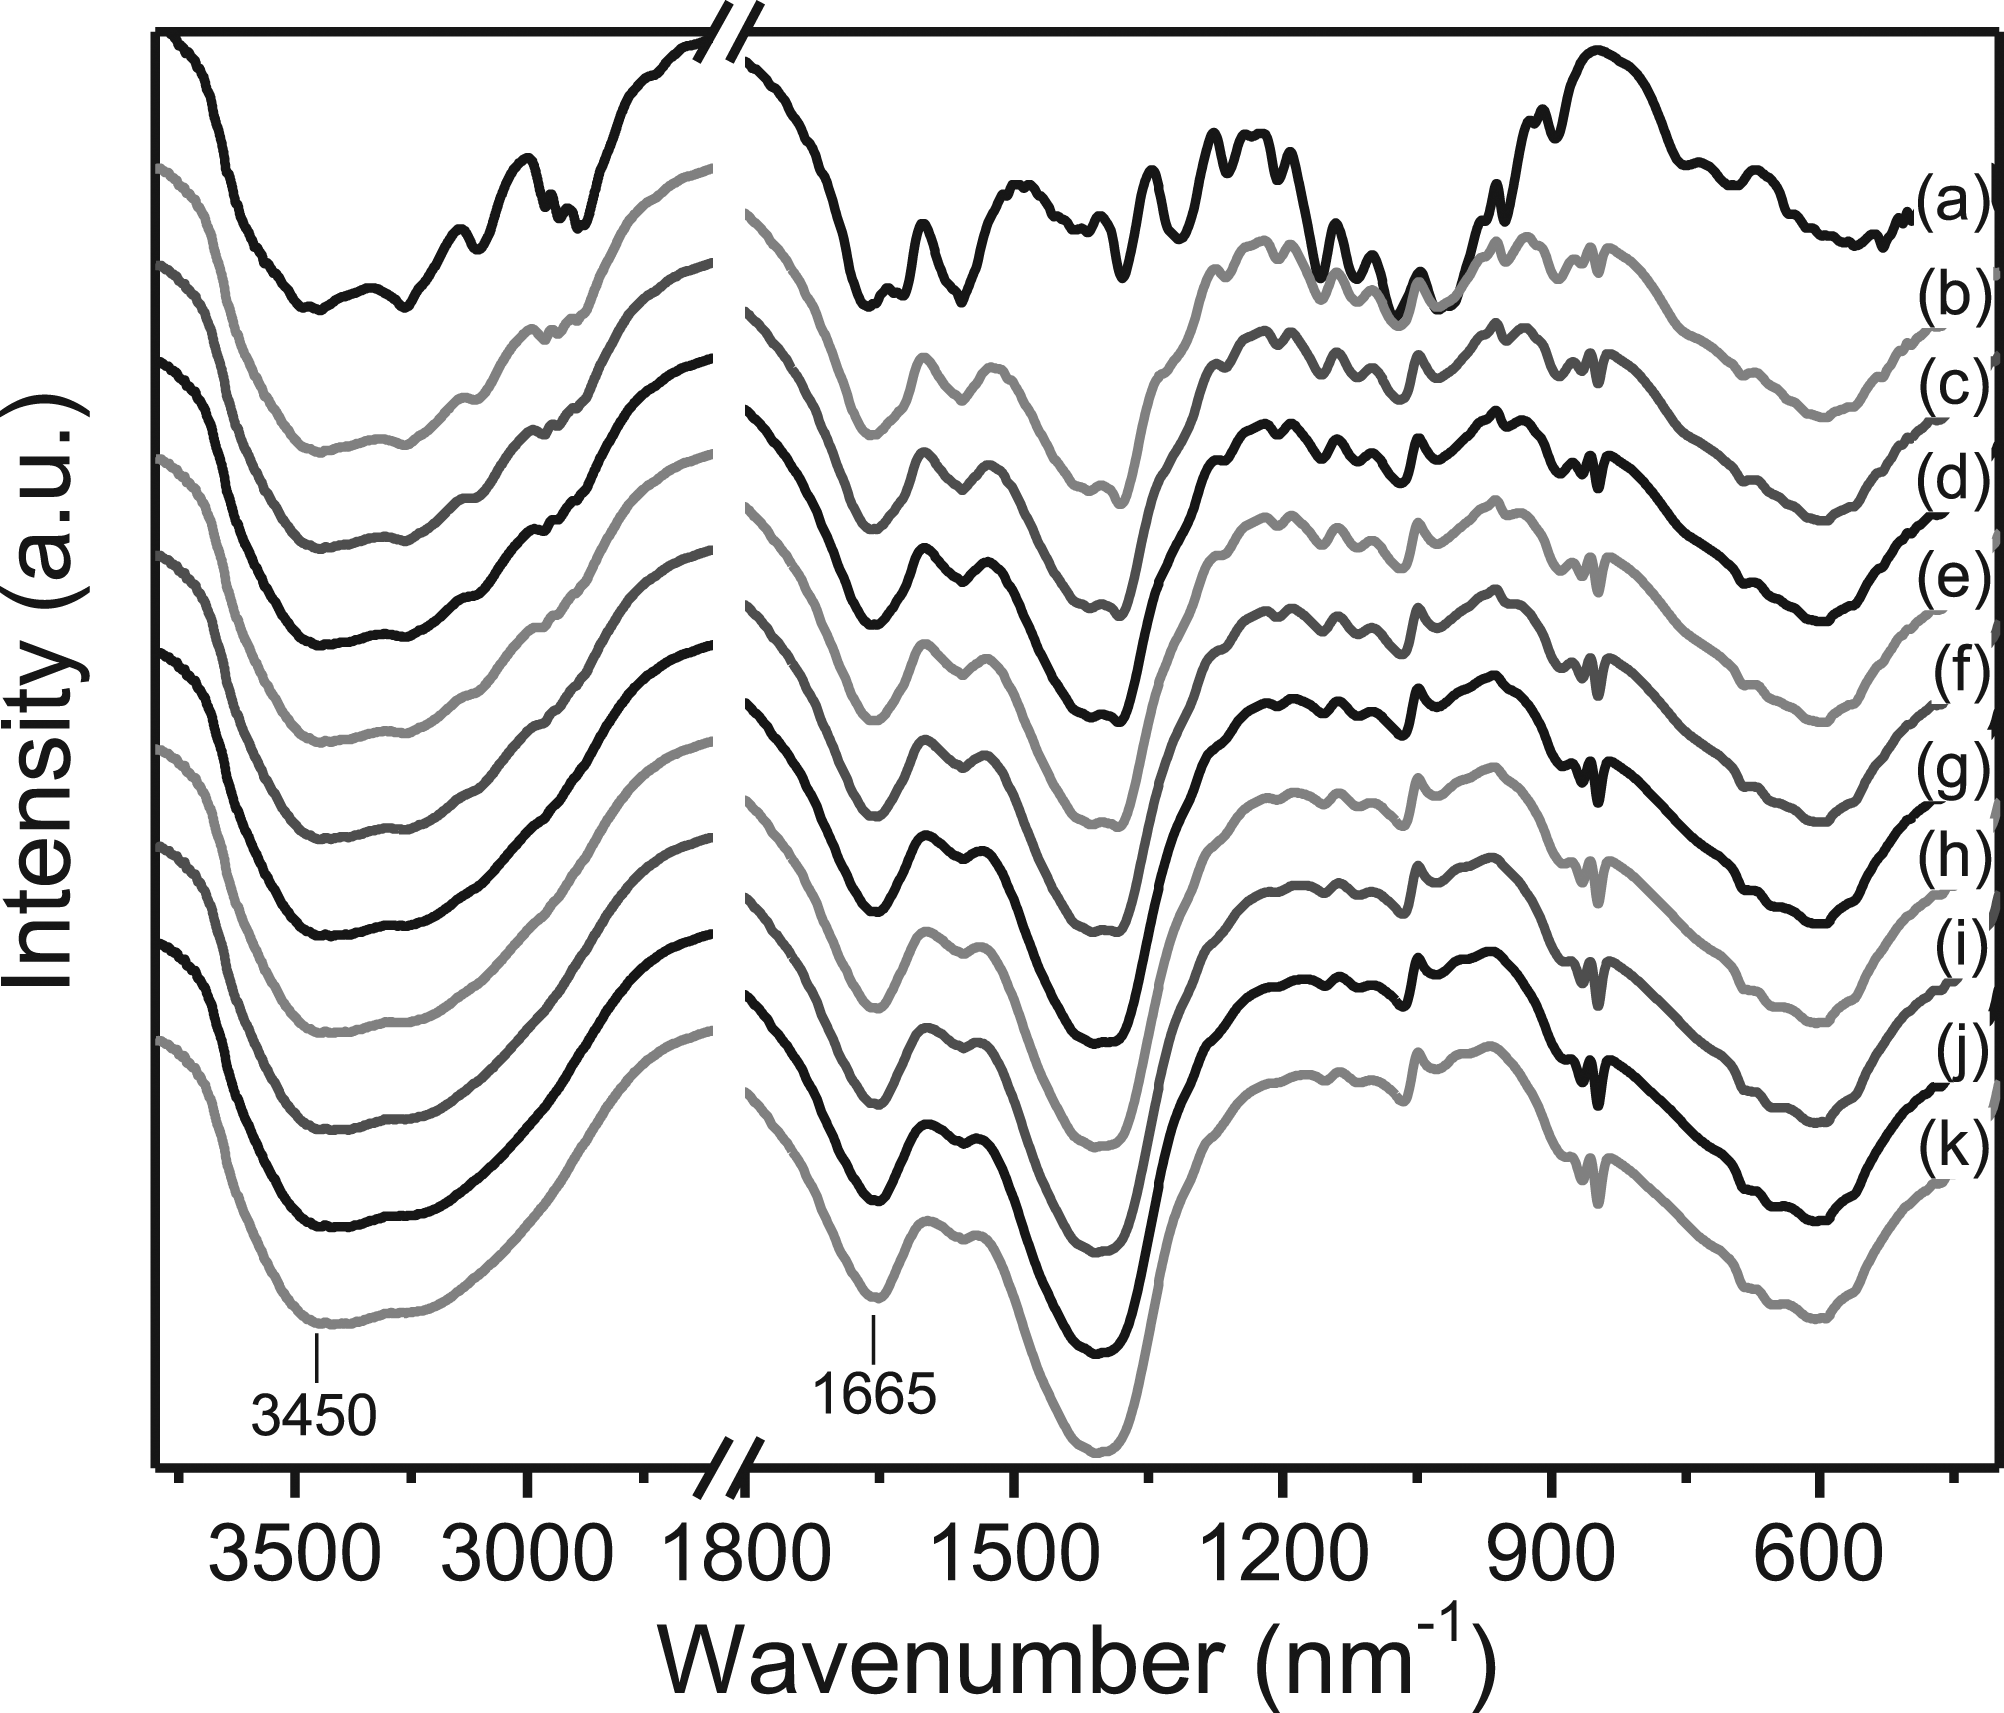
As shown in Figure 2, the DD increases with the reaction time, and the effect of temperature on the time-dependent DD value is clearly observed. At 105°C, the DD reaches 48% at 30 mins and it exceeds more than 85% at 300 mins. Clearly, deacetylation occurs much more efficiently at early reaction times, followed by a slower deacetylation that occurs at longer reaction times. Time-dependent DD of deacetylated chitin using 10 N NaOH at 105°C (■), 75°C (
An important point of note is that, theoretically, deacetylation should finally reach 100% conversion of chitin into chitosan at a prolonged reaction times, as this is predicted in the shrinking core model. 31 However, in practice, incomplete deacetylation is suggested by the final DDs, which are less than 100% at longer times. This has been commonly reported in literature.18,34 It is noteworthy that chitosan with a high DD is achieved by multiple deacetylation processes, 35 where the resulted chitosan is washed with water followed by subsequent deacetylation processes. In this sense, the DD of commercial chitosan is often above 95% and the molecular weight is higher than 104 g mol−1.
At lower temperatures, the DD also increased significantly during early reaction times but it tended to have a steady slower rate at longer times. At 75°C and 35°C the slower deacetylation occurred at reaction times longer than 90 mins and 120 mins, respectively, suggesting that at lower temperature the transition from the fast to slower processes shifted to longer reaction time. At the lowest temperature, the DD becomes almost constant or even tends to saturate at longer reaction times. This suggests that deacetylation rate at low temperature is slower and that the resulting chitosan has lower DD even at prolonged reaction times. Similar findings have been reported for the deacetylation of shrimp-shell chitin at 25°C. 32 Considering that deacetylation is a trans-arrangement of the acetyl groups of chitin, and that it depends on diffusion of the OH‒ ions and their reaction with acetamide groups, this finding implies that acetamide groups are easier for the OH− ions to access due to a higher molecular diffusion rate, structural changes or larger swelling of the chitin particles at higher temperatures. Therefore, it is not surprising that deacetylation is often performed at temperatures higher than 120°C, 32 or is done at high pressure to ensure a successful reaction. 36
Figure 3 shows a plot of Plots of The observed rate constant estimated from the slope of 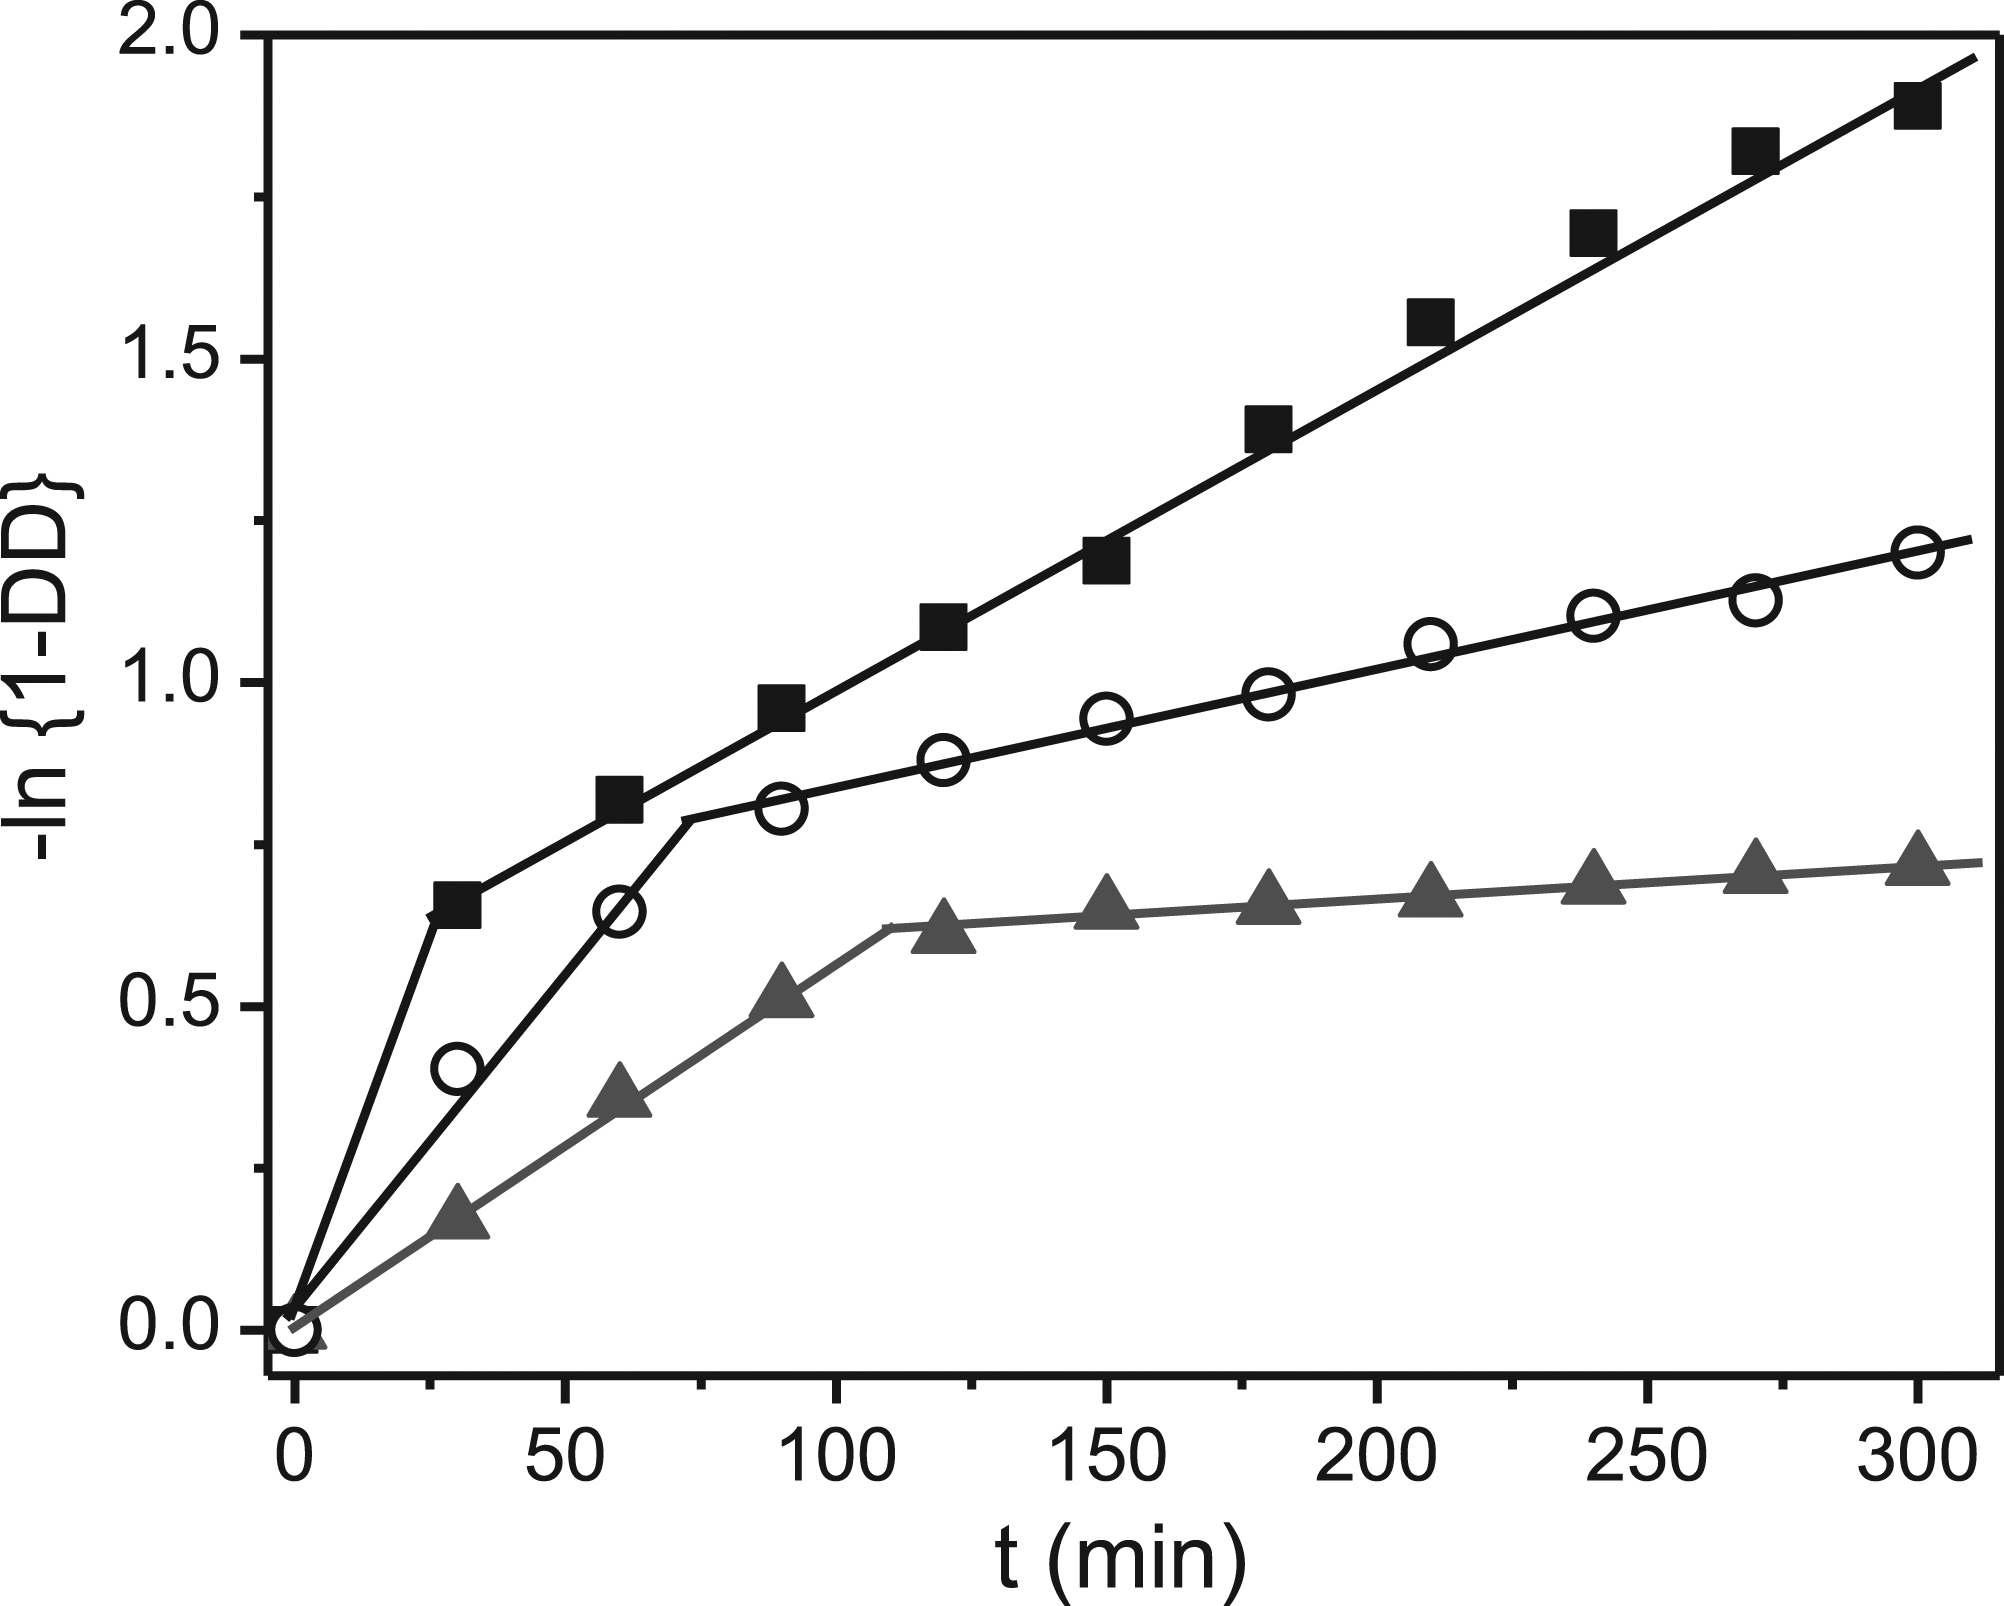

As mentioned above, the faster rate is attributed to the kinetics of the deacetylation of acetamide groups within the amorphous region on the external layer of the chitin particles, whereas the slower rate is associated with the reaction in the crystalline region in the interior of the chitin particle.18,37 At all temperatures,
It is noteworthy that transition between the deacetylation of acetamide groups on the external surface and that in the crystalline region inside chitin particles occurs earlier at higher temperature, as listed in Table 1. This means that it is easier to attack the crystalline structure of the chitin particle at higher temperature.
The slow deacetylation rate (4.61×10⁻³ min−1) using 10 N NaOH at 105°C is the same order as those reported for the deacetylation of chitin derived from shrimp shells (5.86×10⁻³ min−1) 39 and from squid (1.58×10⁻³ min−1). 40 This highlights that deacetylation reaction of chitin using basic solution shows the same kinetics, regardless of the source of the chitin. In other words, the isolated chitins from the different sources have comparable structure and physicochemical properties, which play the key role in the deacetylation process. 41
In addition to the temperature, the NaOH concentration is also an important factor that controls the deacetylation kinetics. As shown in Figure 4, the DD of chitosan increased nonlinearly with the NaOH concentration. It has been reported in many studies that the deacetylation rate is enhanced as a quadratic polynomial with respect to the NaOH concentration.37,42 This indicates that OH− ions are generated, which deprotonate an intermediate species in order to convert the acetyl group into an amino group. The trend of DD for deacetylated chitin as a function of the NaOH concentration.
Activation energy, Ea
The kinetics of basic hydrolysis of chitin is governed by the activation energy (E
a
) of the reaction of OH− ions with the chitin acetamide groups. The E
a
values for chitin deacetylation in both stages were estimated based on Arrhenius plots of from the fast (○) and slower (■) deacetylation processes.

The estimated activation energy in this study is in the range of those reported for heterogeneous deacetylation of chitin derived from different crustacean shells (16.2–56.0 kJ mol−1).32,35,43 The interpretation of the large distribution of the activation energy for the slower deacetylation is still an open question, but the solubility, crystallinity, and particle size of chitin could be considered as the factors determining potential barriers to the diffusion and penetration of OH− ions into the crystalline region inside chitin particle. Thus, the OH− concentration in the solution could be different from that on the solid-liquid interface. Another important factor is structural changes and swelling of chitin particles in the solution. In this sense, the activation energy of the heterogeneous deacetylation should be governed by DA and the chitin molecular weight.
On the other hand, homogeneous deacetylation, i.e. deacetylation of completely soluble chitin using acid or basic solutions, occurs much more slowly and has a higher activation energy compared to the heterogeneous deacetylation. For example, the activation energy for homogeneous deacetylation of shrimp-shell chitin in an alkaline solution has been reported to be 92 kJ mol−137 Nevertheless, elucidating the kinetics of deacetylation of single monomers of chitin N-acetyl-glucosamine into glucosamine remains a research challenge in the near future. In particular, this reaction could be probed using single molecule spectroscopy.
Surface morphology
Figure 6 shows SEM images of the isolated chitin before and after being deacetylated for 300 mins. These SEM images indicate that the chitin forms pasty and flaky microparticles consisting of lamelar or layered structures stacked on top of each other, so that it has a rough surface and a high porosity. It has been reported that chitin microparticles isolated from other crustacean shells
44
and insect cuticles5,20 also arranged in stacked layers. After converting to chitosan, the particle size becomes larger and the surface is smoother. This might be attributed to the change in the microfibrillar crystalline structure and hydrogen bonding interactions of chitin due to deacetylation.
19
SEM images of mud crab chitin (a) before and (b) after being deacetylation at 105°C using 10 N NaOH for 300 mins. The magnification is ×30,000, and the scale bars denote a 5-μm distance.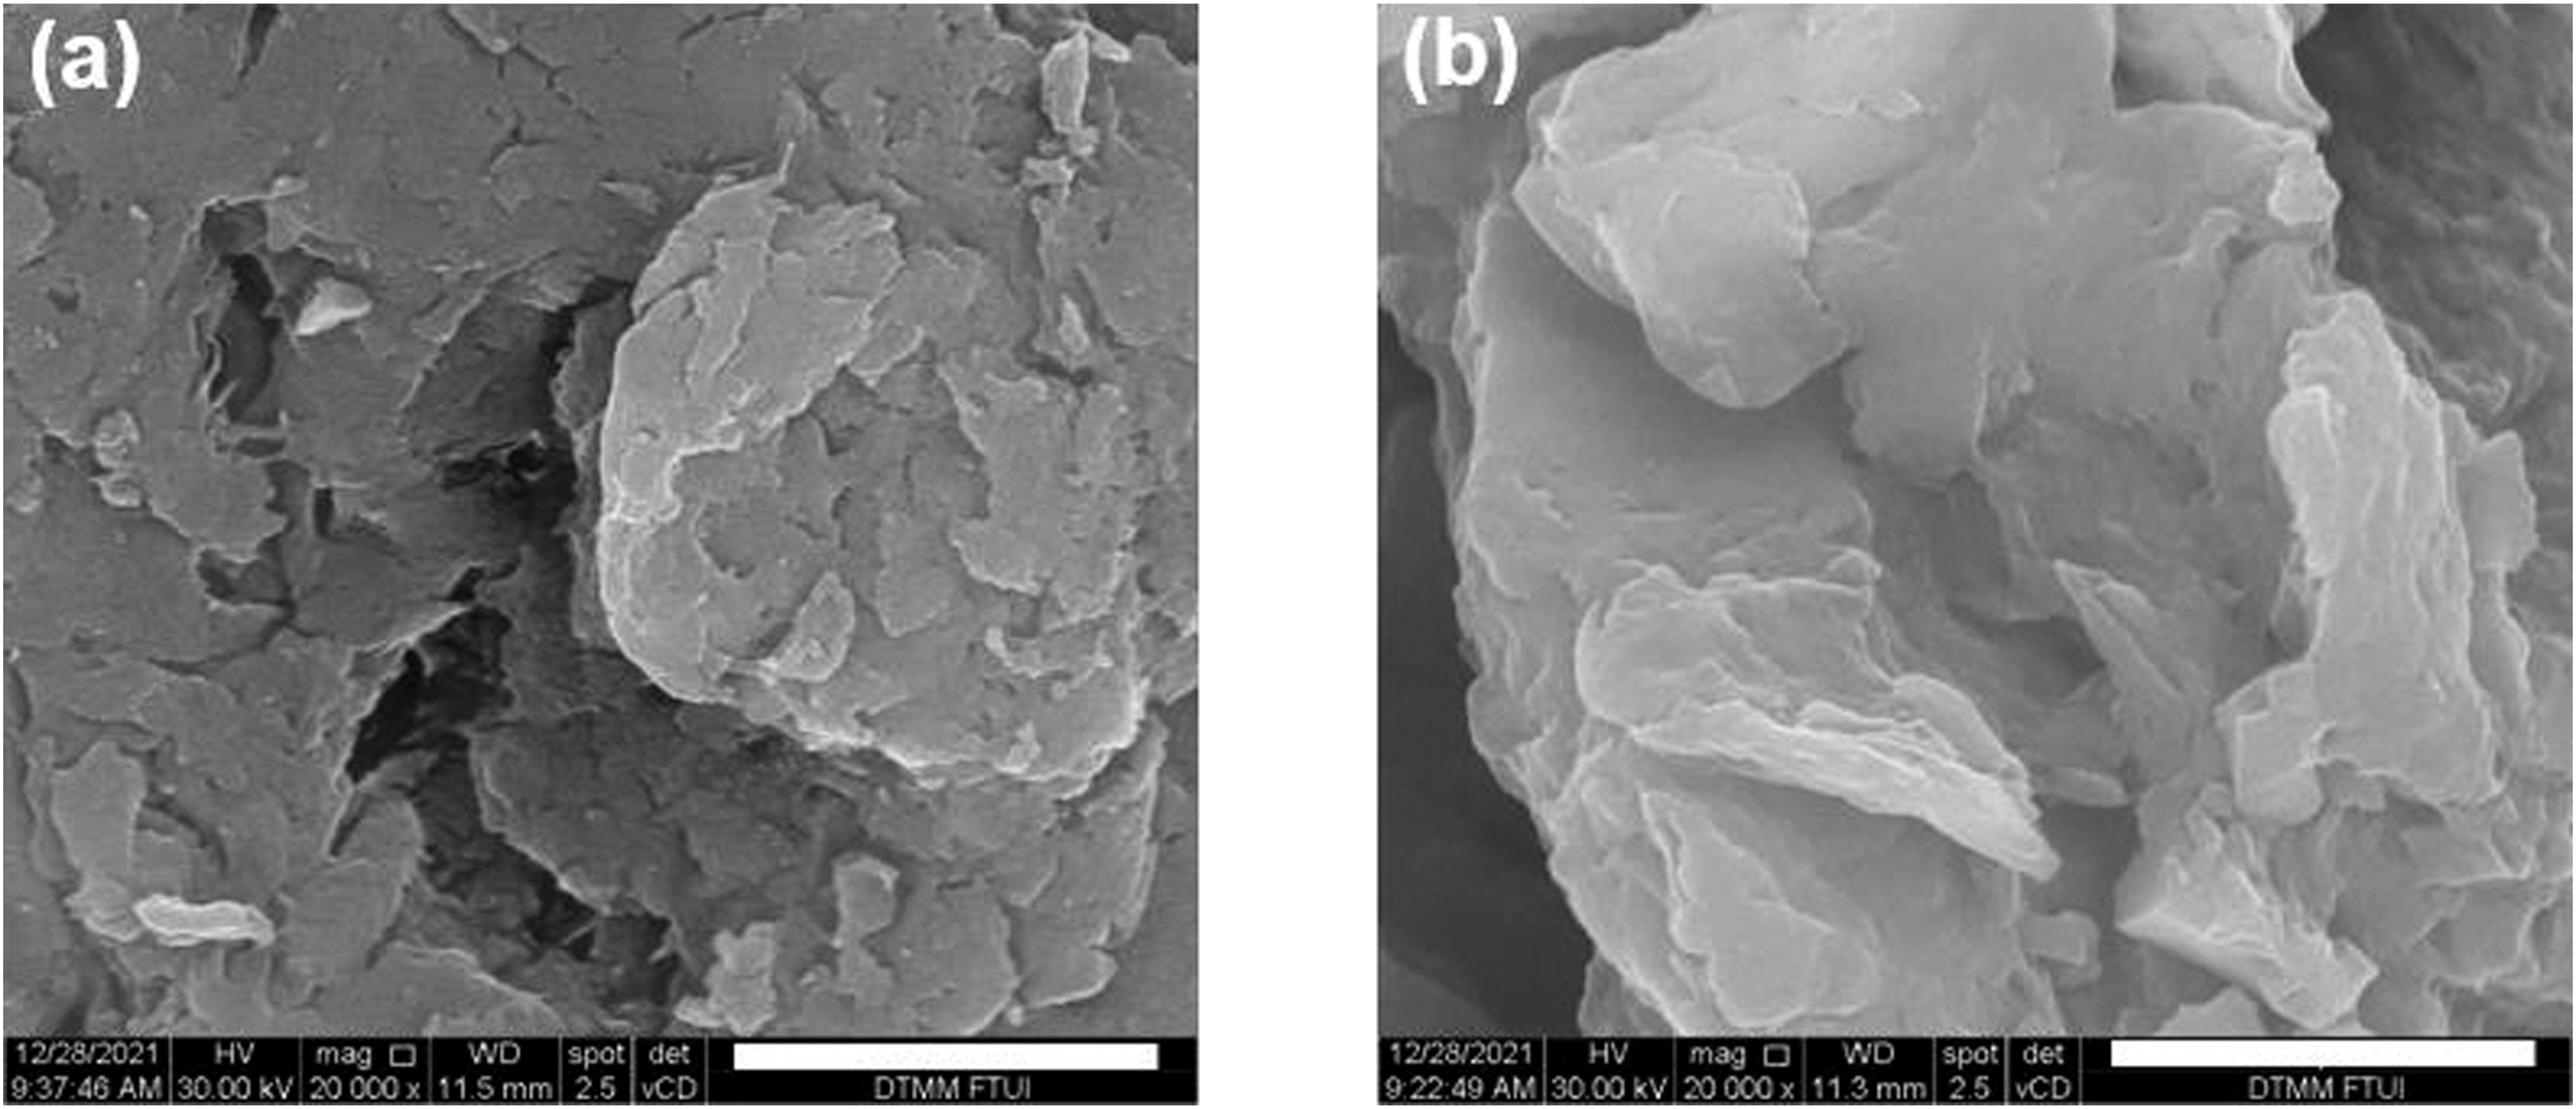
Mud crab shell characterization
It has been reported by Narudin et al. that raw mud crab shells have an ash content of 37.7%, 26 which is less than shrimp and other crab shells (48.8% and 59.8%). 28 The extraction yield of chitin in this study was approximately 17.9% with respect to the powdered shell weight which is similar to that previously reported (16.8%), 26 but it was lower than that of shrimp shells (37.4–80.5%).28,40,45 The chitin extracted from mud crab shells has been found to have a DA in the range of 73.2–76.4%, which is lower than those extracted from crab shells (53.0%) or shrimp shells (74.5%). 26
The mud crab chitosan has a moisture content and residual ash content of approximately 8.5% and 2.1%, respectively, and its intrinsic viscosity is around 93 mL g−1, which is larger than that for chitosan from other crab shells (78 mL g−1), but lower than that of shrimp chitosan (175 mL g−1). 26 These results suggest that the chitosan derived from mud crab shells has fewer, or less dominant intermolecular interactions with water compared with chitosan derived from shrimp shells. This argument is supported by the viscosity-average molecular weight which has been estimated to be 8.96 kDa, 26 which is slightly higher than that of chitosan derived from other crab shells (6.12 kDa) but much lower than that for chitosan derived from shrimp shells (17.03 kDa). The DA of chitosan derived from mud crab shells is comparable to shrimp shells, although they are lower than that of other crab shells. Nevertheless, the DA of chitosan depends on both chitin source and deacetylation process, which is the subject of this study.
X-Ray crystal structure
Figure 7 shows typical XRD patterns with 2θ within 20–60° of chitin and chitosan derived from mud crab shells. The existence of the diffraction peaks indicates that both chitin and chitosan form crystalline solids. The main diffraction peak of chitin was observed at 26.5°, and other minor peaks appeared at higher diffraction angles. This sharp diffraction peak at 26.5° is an indicative of the crystalline reflection of the (130) plane of the α-chitin structure,
46
confirming that chitin derived from the mud crab shells adopts the α-form. This XRD pattern of chitin is in accordance with those in literature.
47
XRD patterns of mud crab chitin (a) before and (b) after being deacetylation at 105°C using 10 N NaOH for 300 mins. Vibrational spectra of chitin and chitosan.
On the other hand, the diffraction peaks of chitosan are observed at 27.9°, 29.2°, 33.9°, 36.9°, 40.0°, 44.6°, 45.6°, 46.3°, 51.5°, 52.6°, 55.3°, and 57.8°. It is well documented that the XRD pattern reflects the crystal structure of the α-chitosan. 28 It is noteworthy that, typically, both α-chitin and α-chitosan crystallize into orthorhombic with the P212121 space symmetry group. 46 The unit cell of the crystal lattice parallel to the interstrand of chitin is 0.469 nm, which is much shorter than that of chitosan (0.895 nm). 46 Consequently, the d spacing of atomic planes in the crystal of chitin which gives rise to the diffraction peaks is shorter compared to that of chitosan. 46 In other words, as compared to chitosan, chitin strands are arranged in a more compact manner in the three dimensional crystal structure. This can be attributed to the presence of amide group in the chitin strands, which could be interlinked and form strong intramolecular and intermolecular hydrogen bonds.
The α-chitin and α-chitosan also exhibit an amorphous structure. Their crystallinity index, which is the ratio of the crystalline portion and the amorphous portion, can be determined, based on the XRD patterns, by comparing the relative area of diffraction peaks with the total area under the curve. 48 It was found that the crystallinity index of mud crab chitin was 60.1%, which is slightly lower than those of chitin isolated from other crab and shrimp shells (64.1–67.8%). 49 The crystallinity of mud crab chitosan prepared by deacetylation using a basic solution at 105°C for a prolonged reaction time up to 300 mins was 73.8%. This highlights that it has a high crystalline portion compared to those of chitosan derived from other crab and shrimp shells (31.9–38.8%). 28
Typical FTIR spectra of chitin and chitosan derived from mud crab shells are shown in Figure 8. Chitin shows a few broad and intense vibrational bands. The OH group of chitin forms –OH···OC– intramolecular hydrogen bonds, exhibiting a vibrational band at around 3450 cm−1. This band may also be contributed by incorporated water molecules though further corroboration is required. FTIR spectra of mud crab chitin (a) before and (b) after being deacetylation at 105°C using 10 N NaOH for 300 mins.
The NH of the amide I shows two intense bands at 3264 and 3110 cm−1 due to its intermolecular and intramolecular hydrogen bonding interactions with amide carbonyl (C=O) groups in the α-chitin. 28 The amide I is the key feature to determine the crystalline structure of chitin. In the lower frequency region, the bands at 1662 and 1630 cm−1 are assigned to doublet vibrational peaks of amide I of chitin interconnected by hydrogen bonding interactions. 50 The doublet vibrations of amide I indicate that carbonyl (C=O) forms intramolecular and intermolecular hydrogen bonds with hydroxyl and amine (–OH and –NH) groups,50,51 thus supporting the presence of the α-form. This spectral pattern of α-chitin is distinct from that β-chitin, where the latter shows a single amide I band. Based on this finding, the FTIR pattern of chitin suggests that the mud crab chitin adopts the α-form, and it is similar to those derived from shrimp and crab shells. 28 The intramolecular and intermolecular hydrogen bonds stabilize the structure of the α-chitin. In addition, the FTIR of chitin also showed bands at 2861–2971 cm−1, 1424 cm−1, and 1380 cm−1 which are assigned to CH vibrations.
Deacetylation of chitin leads to notable changes in the FTIR spectrum, especially those regions related to OH and NH vibrations at 2800−3600 cm−1 and amide bands at 1550−1660 cm−1. In this sense, the FTIR spectrum of chitosan shows broad bands at 2850−3650 cm−1 with peaks at 3445 cm−1 and 3221 cm−1 due to OH and NH2 vibrations. In the low frequency region, the band at 1657 cm−1 is assigned to the carbonyl of amide group, and the band at 1600 cm−1 is due to deformation of the NH2 group. The band at 1406 cm−1 is assigned to CH group. In addition, the vibrational band of the pyranose groups appears at 484–825 cm−1.
The changes in the FTIR pattern confirm that the acetyl group of chitin is removed upon deacetylation, resulting in the formation of the NH2 of chitosan. It is also interesting to highlight that (i) the doublet vibrational peaks of the amide I of chitin, that are related to its α-form, disappeared in FTIR spectrum of chitosan, and (ii) the two intense bands at 3264 cm−1 and 3110 cm−1 due to NH of the amide group of chitin disappeared and turned into small shoulder in the FTIR spectrum of chitosan. These facts suggested that hydrogen bonding interactions involving the amide group disappeared in chitosan.
Conclusions
In summary, α-chitin has been isolated from the shells of mud crab (S. serrata) obtained in Brunei Darussalam. The isolation involved demineralization and deproteinization processes. The extracted chitin was deacetylated using 10 N NaOH at different temperatures (35, 75, and 105°C). Degrees of deacetylation (DD) as high as 85.1% were obtained at 105°C for a prolonged reaction times up to 300 mins. The chemical and crystalline structures of the α-chitin before and after deacetylation were characterized by FTIR spectroscopy and XRD analysis. The kinetics of deacetylation was evaluated by monitoring the DD of the α-chitin before and after deacetylation at different reaction times from 0 to 300 mins. It was found that the DD values of the deacetylated chitin increases nonlinearly with the reaction time, and the heterogeneous deacetylation of the chitin particles occurred in two stages. The fast stage occurred in early reaction time is attributed to the deacetylation of acetamide groups in the amorphous region on the external layer of the chitin particles. The slower rate is associated with reaction in the crystalline region inside chitin particles. Both fast and slow deacetylation stages followed pseudo first-order kinetics, with rate constants that increased with temperature in the range of 5.68×10⁻³−2.23×10⁻² min−1 and 4.67×10⁻⁴−4.61×10⁻³ min−1, respectively. The activation energies for the deacetylation of acetamide groups in the amorphous region on the external layer and in the crystalline region inside chitin particle were estimated to be 18.5 kJ mol−1 and 32.6 kJ mol−1, respectively. The observed rate constant and activation energy of deacetylation of acetamide groups in the crystalline region inside chitin particle are in the same order as those reported for deacetylation of chitin derived from different Crustacean shells, highlighting that deacetylation reaction of chitin using basic solution shows the same kinetics, regardless of chitin sources.
Footnotes
Acknowledgements
JH is grateful to National Cheng Kung University’s NCKU90 distinguished visiting scholar program for hosting his research.
Declaration of conflicting interests
The author(s) declared no potential conflicts of interest with respect to the research, authorship, and/or publication of this article.
Funding
The author(s) received no financial support for the research, authorship, and/or publication of this article.