
Abstract
An emphasis on the development of lightweight structures in multitudes of engineering applications has broadened the scope for the continual development of fiber-reinforced composites due to their lightweight and superior strength. The current work is aimed to investigate the influence of fillers graphene and hexagonal boron nitride (h-BN) on carbon, Kevlar, and hybrid fabric when they form fiber-reinforced composites. In particular, the properties such as storage modulus, loss modulus, damping factor, and glass transition temperature were determined for various composites to understand the influence of fillers, fabric combinations, and their interaction in synergy. The unique contribution of this work also lies in the inter-correlation of Full width-half Maximum (FWHM) of loss modulus (E”) plots to understand the phenomena of abrasive wear. An inhomogeneity factor based on the Cole-Cole plots termed as circularity index was also calculated by using Full Maximum (F.M.) and the FWHM. Carbon, Kevlar, and hybrid fabric mat reinforced epoxy composites, with 0.1, 0.3 & 0.5 wt% loadings of graphene and h-BN were prepared using the hand layup technique. The Dynamic mechanical analysis (DMA) was performed under temperature sweep (30–200°C). The results were analysed to understand the choice of h-BN with Kevlar fabric for applications needing high damping while graphene with carbon fabric for applications needing high tenacity. A hybrid fabric mat offers a balance of damping and tenacity. It was observed that the GC2 composite showed a 49% increment in storage modulus (E’), and GK2 composites showed a 38% increment in loss modulus (E”) compared to GC0 and GK0 composites.
Introduction
Carbon fiber reinforced composites (FRP) have gained popularity in the aerospace, automotive, and defence industries in recent years due to their lightweight and high strength. However, composites with low interfacial bonding between fibers and matrix tend to have crack propagation in a matrix, resulting in delamination or failure. Many studies have been conducted to improve the mechanical and interfacial bonding between fiber and matrix using nanomaterials. Clay, silica, and carbon nanotubes are the most commonly used nanomaterials. Two-dimensional nanofillers have proven to be the most effective in improving the mechanical properties of polymeric composites. In recent years, heat dissipation has become the most common issue in gadgets and electronic systems to address the issue of conductive nanomaterials incorporated into polymeric composite materials such as CNT, graphene, and hexagonal boron nitride (h-BN).
Dynamic mechanical analysis (DMA) is a widely used technique for determining the properties as well as interfacial properties of the sample under sinusoidal loading and at elevated temperatures. Zhang et al. 1 investigated the effect of multi-wall carbon nanotubes on mechanical and interfacial bonding properties and found that MWCNT-NH2 exhibited better mechanical properties. Zeng et al. 2 reported the effect of clay particles on the epoxy system. The study revealed that 2 wt% clay composites have shown high modulus as well as 22.3% improvement in flexural and 11% increment in tensile properties. Jesuarockiam et al. 3 performed DMA analysis on synthetic/natural hybrid fiber composites and found that the addition of GNP particles up to 0.5wt% increased 22% E,” and the glass transition temperature improved. Gupta et al. 4 studied epoxy-based sisal/jute hybrid composites, and it was observed that at 50% of hybrid fiber fraction, the composite exhibited a better specific wear rate and low damping properties. Wei 5 observed that incorporation of 0.3 wt% graphene has resulted in increased tensile strength by 12%, E’ by 30%, and glass transition temperature by 6°C. The results were said to be strongly dependent on the dispersion ability of graphene. Adak et al. 6 observed a 96% increase in E' and a 12°C increase in glass transition temperature by adding thermally reduced graphene oxide to epoxy carbon fiber composites. Agarwal et al. 7 investigated the influence of fiber loading on the mechanical and thermomechanical properties of an epoxy matrix by using bidirectional carbon fiber. In comparison to short fiber composites, bidirectional fiber composites provided a better dynamic response in terms of damping factor and loss modulus, according to the study. Stark 8 studied the curing behaviour of carbon epoxy composites in the temperature range of −90–300°C and found an increase in the glass transition temperature by 13°C. Muralidhara et al. 9 studied the influence of GNP loading on carbon fiber epoxy and discovered that composites with a filler loading of 1.75 wt%. had the best damping ability and improved thermal stability. Joy et al. 10 investigated the effect of filler loading on the glass transition temperature and other dynamic mechanical parameters of epoxy composites. The study found that 0.5 wt% h-BN provided the best performance of epoxy composites while also improving the glass transition temperature by 10°C. Zeng et al. 2 investigated the thermal characteristics of composites made of non-covalently functionalized graphene sheets and Al2O3 hybrid filler-based epoxy composites. Thermal conductivity was claimed to have increased by 105.6%, while characteristics including glass transition and E’ were also improved with higher filler content. Shen et al. 11 demonstrated a new approach for detecting composite delamination using the DMA technique. In comparison to an undamaged composite, the E’ was significantly lowered while the E” was increased by around 18% due to delamination. Based on the literature review, it is observed that several works were reported on dynamic mechanical properties of carbon fabric with fillers like MWCNTs, clay, Al2O3, graphene, etc., but very few works were reported on Kevlar, and also to the best of our knowledge, there is no research work reported on DMA of hybrid carbon-Kevlar fabric (carbon as weft and Kevlar as a wrap). Carbon fabric is expected to have a better energy storage response, while Kevlar has superior energy dissipation behaviour. In addition, the study also compares two similar 2-dimensional nanofillers, graphene and White graphene (h-BN). Although both fillers have a closely related structural appearance, nonetheless they vary significantly in terms of their properties. It is said elsewhere in the literature 12 that there exists superior filler compatibility with matrix if they have structural and dimensional compatibility. Carbon fiber has a similar molecular structure to that of graphene and h-BN. But nonetheless, h-BN has different properties, as is the case with Kevlar. Thus, it behaves to investigate the effect of fillers graphene and h-BN in the carbon, Kevlar, and hybrid fabric and their synergy on the dynamic mechanical properties of the composites. The present work aims to study the effect of DMA of carbon/Kevlar/hybrid fibers by incorporating different wt% (0,0.1,0.3,0.5) graphene and boron nitride fillers. Apart from this, the work also correlates the Full width-half Maximum (FWHM) of loss modulus and a novel parameter Circularity index obtained from Cole-Cole plots to corroborate the dynamic mechanical performance of the composites.
Materials & methods
Carbon fiber (200 Gsm,3k weave) was purchased from C.F. composites, Delhi. Kevlar (200 gsm) and hybrid (aramid as warp & carbon as weft 200gsm) were purchased from Marktech companies Pvt. Ltd. Diglycidylether of bisphenol A (DGEBA) (Epoxy Ly-556) and curing agent (HY 951) were purchased from Singhal Chemical Corporation. Functionalized graphene was purchased from Adnano technologies. GNP has a surface area of 112 m2/g, bulk density of 300 kg/m3, and an average diameter of 10–15 microns with purity greater than 98%. Hexagonal boron nitride platelets have an average particle size of 70 nm and a surface area of 19.4 m2/g. Figure 1(a) and (b) show the TEM image of GNP and h-BN platelets. Functionalization of h-BN is performed as described in the literature.
13
FTIR images of h-BN are shown in Figure 1(c). The XRD of the fillers graphene & h-BN is shown in Figure 1(d) and (e) with the details of the peaks. (a) TEM image of graphe (b) TEM image of HBNO3 (c) FTIR image of h-BN.
Composites fabrication
Prior to fabrication, the fibers were cleaned with acetone to remove dust particles, then dried at room temperature for 24 h, followed by a vacuum oven at a temperature of 70°C for 4 h to ensure complete moisture removal. Degassing was performed before and after the addition of the curing agent for 60 and 5 min, respectively, to remove air bubbles present in it. Different weight percentages (0, 0.1, 0.3, 0.5) of graphene and boron nitride were added into epoxy separately. Different concentration of fillers was subjected to ultra-sonication for about 4 h
14
at a temperature of 80°C. The curing agent was added into epoxy in a ratio of 10:1 after the sonication process. Nine-layer composites of carbon, Kevlar, and hybrid fibers are manufactured by hand layup process. The layup composites were subjected to compression in a compression moulding for $ h at room temperature. The fabricated samples have a final dimension of 150×150×3 mm. A schematic view of composite preparation is shown in Figure 2. The XRD of the prepared composites is also shown in Figure 2(b) to (f). An XRD test was conducted to know the crystalline nature of developed composites. In general, broad peaks represent the amorphous nature of the material, while sharp peak represents the crystalline nature of the material. Figure 2 b represents the XRD pattern of graphene Carbon Fiber (G.C.) composites; a sharp peak at 26.4° indicates the presence of the graphene (002) plane and reveals the interlayer distance of graphene.
15
Figure 2(b) and (c) represent the XRD pattern of graphene hybrid fiber (G.H.) and graphene Kevlar fiber (G.K.) reinforced with graphene. It was observed there was a wide broaden
16
spectrum of 10° to 25°, indicating the amorphous nature of developed composites, while a small peak around 28° indicates the presence of graphene.
17
The prepared composites are coded as listed in Tables 1 and 2 for GNP and h-BN wt%, respectively. (a) Composite fabrication process. XRD graphs of Graphene and hBN filled composites (b,c) carbon (d) hybrid (e,f) Kevlar. Specification material according to GNP wt%. Specification material according to h-BN wt%.


Dynamic mechanical analysis
Dynamic mechanical analysis was performed on fabricated composites by PerkinElmer DMA 800 operated at 1Hz and 0.35 strain rate under three-point bending mode. The samples were cut from the fabricated composite sheets in dimensions of 50 × 10 × 3 mm and tested as per ASTM D4065 standards. A temperature scan was performed on samples from 30°C to 200°C with an increment of 2°C per minute. Five specimens were tested for each test condition to ensure repeatability of material response.
Results & discussion
Storage modulus (E’)
Figure 3(a) to (c) depicts graphene reinforced carbon, Kevlar, and hybrid fabric mats E’. Figure 3(a) shows three significant zones in the plot during the temperature sweep. Zone-I is the Glassy condition of the material where E’ exceeds the loss modulus, demonstrating elasticity. Zone-II is the rubbery phase transition zone (TZII). During this phase, the material’s E progressively decreases until it stabilizes before entering Zone-III, a fully rubbery phase. All samples tested exhibit the same behavior. With increasing graphene loading, the E’ of GC0 composites increased to 255, 317, and 275 GPa, respectively. GC1, GC2, and GC3 showed increases of 20, 49, and 28% above GC0. Figure 3(b) and (c) show similar results for graphene-Kevlar fabric systems (GK0, GK1, GK2, GK3) and graphene-hybrid fabric composite systems (GH0, GH1, GH2, GH3). The graphene-Carbon system has the highest E’ at room temperature, while the graphene-Kevlar system has the lowest. The greater elastic modulus of carbon fiber −150 GPa,
18
Kevlar −90 GPa,
19
whereas a hybrid mat made of carbon and Kevlar should have a mid-range value. Another factor could be the compatibility of carbon fiber’s atomic structure with graphene’s hexagonal molecule arrangement. This was achieved by increasing the loading of graphene in G.C. and G.K. composite systems beyond the optimum of 0.5 wt%. This is due to the cross-directional semi-compatibility of the fiber structure with the filler graphene
20
structure. Carbon fiber has the most outstanding absolute E values, followed by hybrid and Kevlar. Table 2 shows the temperature of the TZII for GC0, GC1, GC2, and GC3 samples at 61.4, 65.6, 75, and 72.7°C. The start temperature of transition increased up to 0.3 wt% graphene and subsequently dropped to 0.5 wt% for GC3. GC0, GC1, GC2, and GC3 were found to be 136, 138, 151, and 144°C, respectively. Zone II length was 63, 72, 76, and 71°C, indicating GC2 stays longer in Zone II. Agglomeration of filler above 0.3 wt% may cause localized hotspots. Graphene’s uniform distribution and high thermal conductivity [3000–5000 W/m2-K]
21
prevent the composite from exhibiting higher elastic behaviour across a broader temperature range in Zone II.
7
The same tendency was seen in G.K. and G.H. composite systems, as illustrated in Table 3. Because carbon fiber has a higher thermal conductivity than Kevlar (24 W/m-K) compared to Kevlar (3.2 W/m-K),
22
the G.H. systems have comparable values to G.C. Storage & loss modulus of Graphene reinforced composites FRP’s with a) Carbon Fiber b) Kevlar Fiber c) Hybrid Fiber. Zone based data for Graphene filled composites systems from Storage, Loss Moduli plots.

Figure 4(a) to (c) exhibits h-effect h-BN’s on the three fiber composite systems (hBC, hBK, hBH). Storage & loss modulus of h-BNO3 reinforced composites FRP’s with a) Carbon Fiber b) Kevlar Fiber c) Hybrid Fiber.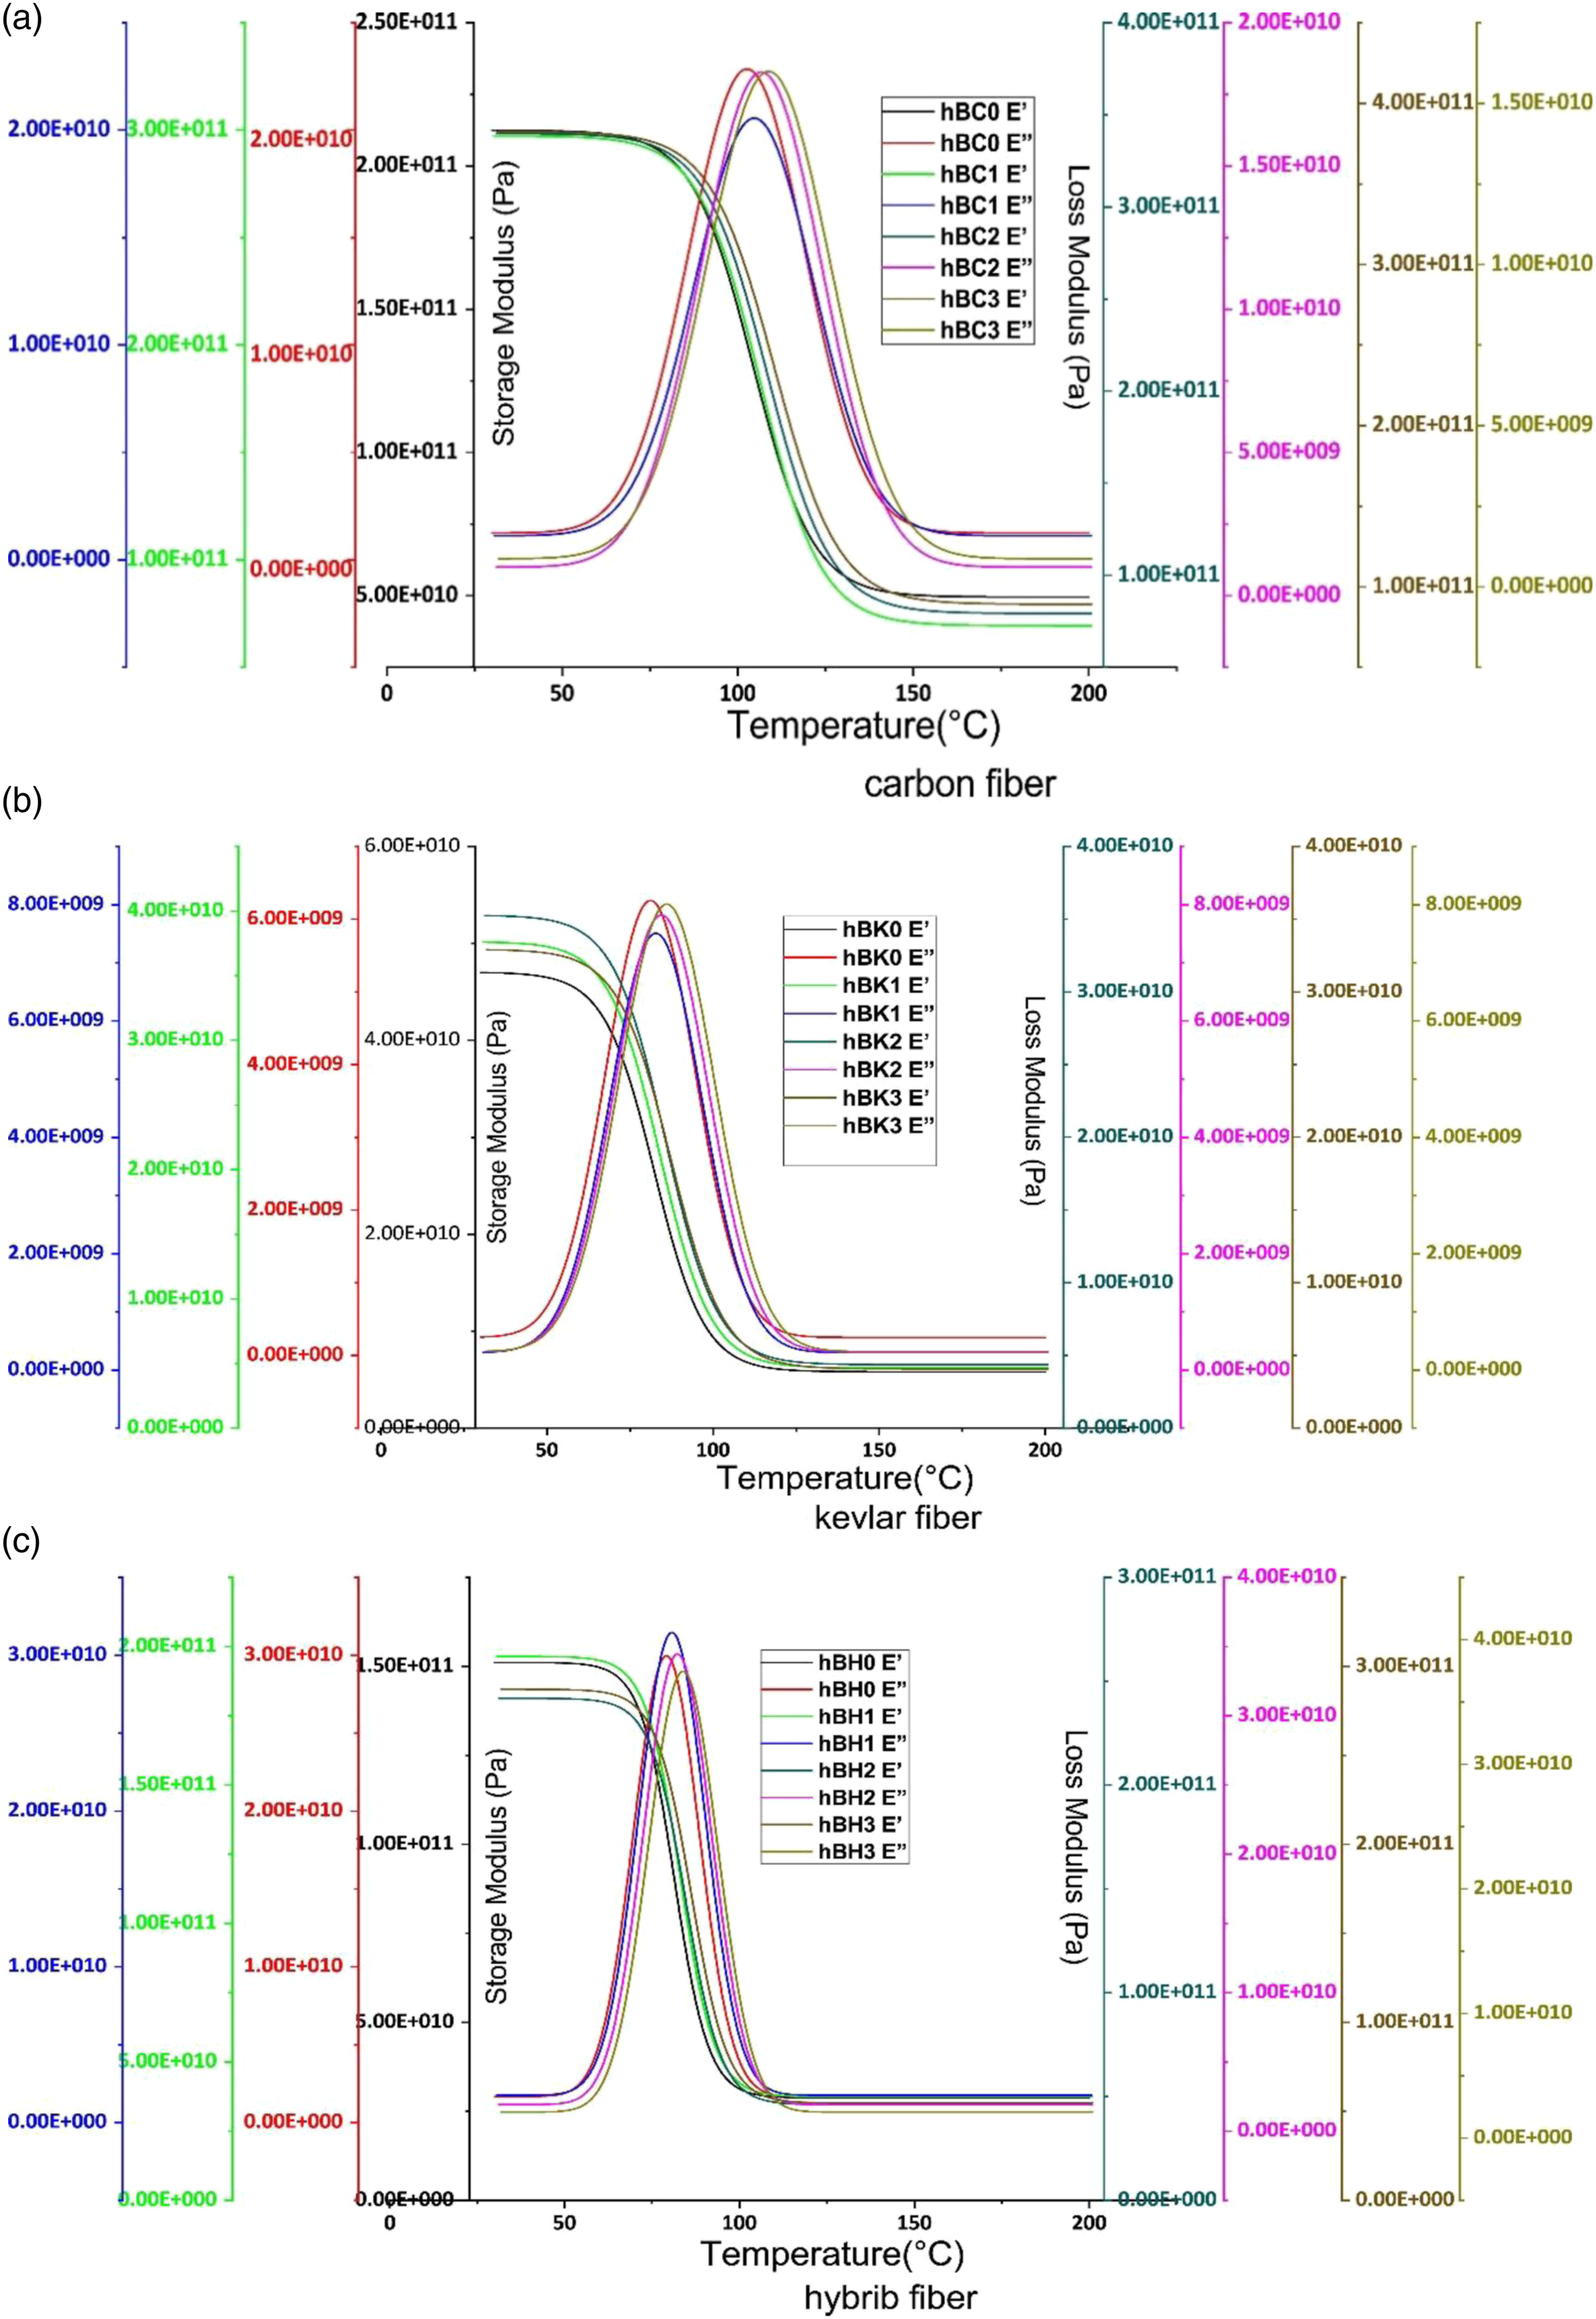
The E' rose with h-BN loading, similar to graphene-filled composite systems (G.C., G.K., G.H.).
At the start of Zone II, the E’ was 210, 294, 339, and 383 GPa in hBC0, hBC1, hBC2, and hBC3 samples, respectively. However, graphene composites (G.C., G.H.) outperform h-BN composites (hBC, hBH). At low loads, h-BN outperforms graphene in Kevlar fabric composites. The interaction of Kevlar with graphene and h-BN explains this. A greater interlayer spacing of carbon than h-BN is held by van der Waals forces in either. 23 Due to the narrow interlayer separation, minimal atomic intermingling occurs between graphene and Kevlar fiber. Due to the smaller interlayer spacing in h-BN, the nanofillers are likely to be enclosed between the fiber chains, improving the composite’s elasticity. The E’ of hBC systems ranged from 213 to 383 GPa, while hBK and hBH composite systems ranged from 46 to 32 GPa and 151–288 GPa, respectively. From a glassy to a rubbery condition, the onset and end-set temperatures of Zone II are shown in Table 3. In general, compared to graphene, the inclusion of h-BN delays the onset temperature of the TZII.
Loss modulus (E”)
E” is the energy dissipated by a viscoelastic material during cyclic loading. E” of graphene-based composite systems (G.C., G.K., G.H.) is shown in Figure 3(a) to (c), whereas E” of h-BN-based composites (hBC, hBH) is presented in Figure 5(a) to (c). Unlike E’, E” grew slowly in Zone I, then dramatically in Zone II, reaching a peak before rapidly declining into Zone III and beyond. Table 3 and Table 4 show the E” across all Zones and the peak E” and temperature. The E” of graphene and h-BN systems declined with increasing filler loading in carbon fiber but increased in Kevlar and hybrid fiber mats. The polymer chain relaxation zone was seen in all composites towards the peak of E” and at the confluence of Zone II and III. The relaxation zones were higher for graphene-filled carbon fiber and hybrid fiber composites but lower for Kevlar fiber composites. In the case of h-BN filler, carbon fiber relaxation temperature zones were higher than Kevlar and hybrid fiber mats. E” GC0, 1, 2, and 3 peaks were recorded at 22.8, 20.5, 15.9, and 18.3 GPa in Zone II, respectively. Peak E” was measured at 6.25, 6.88, 8.75, and 7.81 GPa at 81, 84, 87, and 85°C for G.K., GK1, GK2, and GK3. A peak of 29.33.39.48. GPa was found for each of GH0,1,2,3 at 79.81.84.83°C. With increasing filler loading, the E” of carbon fiber and hybrid fabric decreased, whereas the E” of Kevlar fiber increased. The flip-over concentration of filler was measured at 0.3 wt% graphene in all composite systems. FWHM and filler loading correlation of a) Graphene filled composites b) h-BNO3 filled composites. Zone based data for HBN filled composites systems from Storage, Loss Moduli plots.

Contrary to its effect on E’, GNP has no effect on viscous damping at higher loadings and temperatures. Improvements in matrix and fiber adherence, as well as filler dispersion, may have resulted in greater energy dissipation and mechanical qualities. Similar findings have been reported elsewhere in literature. 3
Figure 4(a) to (c) shows similar results for h-BN composite systems with different filler loadings. These are 23, 20, 18, and 16 GPa for hBC0, hBC1, hBC2, and hBC3, respectively. The E” decreased with increasing h-BN filler content. The3 results showed the opposite trend, with E” increasing with filler content. Although E” decreases with increased filler loading, it does occur due to the nanofillers’ high aspect ratio and surface area. A large surface area increases filler-to-matrix adhesion and resin retention. This reduces 24 the energy dissipated and thus the loss modulus between the viscous layers. Because hBK and hBH systems contain Kevlar, which has a relatively loose polymer network at high temperatures, the E” increased with filler content as compared to graphene filled composite systems. Peak of E” was measured at 81, 84, 87, and 85°C for hBK0, hBK1, hBK2, and hBK3 composites, and 79, 81, 84, and 83°C for hBH0, hBH1, hBH2, and hBH3 composites, respectively.
Figure 5(a) and (b) shows the FWHM of E” peak against fiber loading. This parameter describes the fiber-matrix interfacial properties that control the E”. 25 Figure 5(a) shows the FWHM of graphene-filled composites with increasing carbon fiber and decreasing Kevlar and hybrid fabric. These values were 39.1, 40.2, 41.6, and 40.9oC for GC0, GC1, GC2, and GC3, respectively. GH (0, 1, 2, 3) composite systems ranged from 23.4 to 21.6°C, while GK (0, 1, 2, 3) composite systems ranged from 34.1 to 31. °C. Lower FWHM values lead to higher E”, which increased in Kevlar and hybrid fabrics, but decreased in carbon fabrics with increased filler content. It is predicted by theory 26 that a low FWHM of E” peak of a composite indicates superior molecular relaxation behaviour, large relaxation time distribution, and thus higher loss modulus. Figure 5(b) shows the FWHM trend of carbon, Kevlar, and hybrid fabric with h-BN fillers, with carbon increasing while Kevlar and hybrid decreased. In general, h-BN composites have lower E” than graphene.
Tan δ
Tan δ indicates the damping behaviour of composites and the material’s elastic or non-elastic nature.
27
Figure 6(a) to (f) shows that the Tan δ value increased until it peaked and then decreased to a minimum for all samples. Peak Tan δ GC system was reduced with increased filler content,
28
with values of 0.2, 0.15, 0.09, and 0.11 for GC0, GC1, GC2, and GC3. GH0, GH1, GH2, GH3 had values of 0.36, 0.28, 0.25, and 0.27, respectively. The peak Tan Tan δ curves of Graphene filled composites [with a) Carbon fiber b) Kevlar fiber c) Hybrid fiber] and h-BNO3 filled composites (with d) Carbon fiber e) Kevlar fiber f) Hybrid fiber].
Glass transition and peak Tan δ of GNP filled composites.

Glass transition and peak Tan δ of hBN filled composites.

Cole-cole plots
The plots correlating the E' representing stored energy and the E” indicating energy dissipation of a viscoelastic material are called Cole-Cole plots. These plots throw light on the changes that result in the polymeric structure due to either micro or nanofillers loaded in the composites.
33
Figure 7(a) to (c) shows the Cole-Cole plots of graphene filler systems, while Figures 7(d) to (f) represent those of h-BN filled composite systems. The cole-cole plots indicate the homogeneity or heterogeneity of the polymeric structure.
28
Cole-Cole plots of Graphene filled composites [with a) Carbon fiber b) Kevlar fiber c) Hybrid fiber] and h-BNO3 filled composites [with d) Carbon fiber e) Kevlar fiber f) Hybrid fiber].
Cole-Cole plot also gives us the information on the E’ corresponding to the peak Loss modulus. A material that possesses high E’ under the peak of E” has higher structural integrity even at elevated temperatures. The circularity index for each composite was calculated from its Cole-Cole plot by finding the ratio of Half-width half maximum to half maximum, i.e. HWHM/HM. The obtained ratio was compared with the ratio obtained for a perfect semicircle, which is 1.732. If the value of the index is precisely 1.732, then the material is fully homogeneous, whereas the more deviated the index, the more heterogeneous the system is. It is observed from Figure 8(a) to (f) that the curves of all the composites have followed a warped semi-circular contour connoting their heterogeneous nature. However, in specific cases like GC3 in Figure 7(a) and GH3 in Figure 8(c), hBC3 in Figure 7(d), the curve appears slightly more circular as compared to others, which could be due to enhanced dispersion of filler, but nevertheless, it depends on the type of filler. At higher loading of the filler, usually, the curves displayed imperfect semicircle, which might be resulting due to localized agglomeration of the fillers and consequently influencing the viscoelastic behaviour of the composites systems. Figure 8(a) and (b) shows the circularity index of graphene and h-BN systems, respectively. A general observation is that h-BN-filled composites have shown a slightly higher index as compared to graphene. This could be due to the high aspect ratio of hBN filler as compared to graphene. The circularity index of composites with a) Graphene b) hBN.
Conclusions
In the present research work, a comparative study on the effect of graphene and hBNO3 fillers on carbon, Kevlar, and hybrid composites and their viscoelastic behaviour was studied at different temperatures. Based on the study, the following conclusions can be drawn • The addition of graphene and hBNO3 fillers improved the glass transition temperature of materials by 7°C for GC2, KC2, and HC3 compared to GC0, KC0, HC0 materials. HBC3 shows a least tan delta value compared to all combinations, which indicates HBC3 is more elastic compared to all. • Damping properties of Kevlar composites increased with the addition of nanomaterials, particularly GK2 combination has shown superior damping properties as compared to all composites. • A new approach using Cole-Cole and circularity index plots is presented, which indicates that composite materials are heterogeneous in behaviour. The same was also used to indicate the dispersion of the fillers. • Carbon composites are more suited for compression applications, whereas Kevlar composites are suited for high damping applications. Hybrid composites can be used where both compression and damping requirements are together, like aeroplane wings.
Footnotes
Declaration of conflicting interests
The author(s) declared no potential conflicts of interest with respect to the research, authorship, and/or publication of this article.
Funding
The author(s) received no financial support for the research, authorship, and/or publication of this article.