
Abstract
The application of cellulose acetate (CA) in various industrial areas is strongly influenced by thermal stability. Graphene nanoplatelets (GNPs) as a highly thermal conductive filler is a promising choice to modify the stability of CA, while the practical effect falls short of the expectations associated with the promise of individually dispersed graphene owing to poor dispersion. Supercritical carbon dioxide (SC-CO2) is favorable to nanoparticles dispersion. Thus, the method, introducing SC-CO2 into the CA/GNPs system during extrusion process, was proposed to modify GNPs dispersion in CA matrix. As three main process parameters, it was researched that the effects of injection flowrate, temperature and screw rotation-rate on GNPs dispersion in CA matrix. The dispersion quality of GNPs was enhanced with the rising of injection flowrate, and the average visible GNPs count of sample G1.25C0.5T37R9 decreased 74.79%, compared with sample G1.25C0.1T37R9. The dispersion quality of GNPs was enhanced with the rising of temperature, and the average visible GNPs count of sample G1.25C0.3T41R9 decreased 63.63%, compared with sample G1.25C0.3T33R9. The dispersion quality of GNPs decreased with the rising of screw rotation-rate, and the average visible GNPs count of sample G1.25C0.3T37R5 decreased 77.71%, compared with sample G1.25C0.3T37R13. Thermogravimetric analysis revealed that a better GNPs dispersion is beneficial to CA stability even at an extremely low level. The maximum-weight-loss rate of the first weight-loss-stage of samples G1.25C0.5T37R9, G1.25C0.3T41R9 and G1.25C0.3T37R5 appeared at 212, 224 and 225°C, while that of samples G1.25C0.1T37R9, G1.25C0.3T33R9 and G1.25C0.3T37R13 appeared at 207, 219 and 219°C, with an increment of 5, 5 and 6°C, when the content of introduced GNPs is merely 1.25‰.
Introduction
Early 20th century, cellulose acetate (CA) was primarily developed as a safe alternative to highly flammable cellulose nitrate. 1 Nowadays, it has been widely used in membranes, 2 fibers, 3 plastics, 4 filters, 5 etc. 6 The decomposition and stability of CA considerably affect its application in several industrial areas. 7 Introducing excellent thermal conductivity fillers is an effective routine to restrain decomposition and enhance stability of polymer materials.8,9
For traditional high thermal conductivity fillers, great improvement can only be achieved when the weight loads is large enough, which will greatly affect the physical properties of composites.10,11 In recent years, carbon based materials12-16 have been gradually employed in thermal systems due to their low density. Whereas there are some factors (material cost and inherent thermal properties, etc.) limited such carbon materials using in composites. Graphene nanoplatelets (GNPs), composed of several layers of graphene, offered an excellent balance between properties and cost given the abundance of naturally existing graphite as the source material for GNPs. 17
Graphene’s unusual thermal properties, originating from its unique two-dimensional structure, provide a solid platform for new findings of novel thermal management applications, with thermal stability modifying included. 18 However, the composite properties fail to meet the expectations associated with the promise of individually dispersed graphene. There exists condition where it is found that thick graphite sheets or platelets perform better in thermal stability modifying than graphene. 19 Therefore, a benign method for dispersion modification of GNPs in composites matrices is to be proposed.
Conventional methods for achieving graphene dispersion in polymer matrices usually include solvent using, 20 whereas the use of conventional solvents causes serious health and environmental problems, preventing large-scale use of these solvents. Compared to solvent dispersion, melt blending, that is the direct dispersion of graphene nanophases into molten polymer, is a cleaner process that can be readily scaled up for industrial applications. 21 However, the processing temperature of melt blending is around 200°C in common condition, which consumes large amount of energy. Besides, new techniques are being tried to improve graphene dispersion, such as supercritical carbon dioxide (SC-CO2) technique.
Indeed, many researchers are devoting their efforts to modifying graphene dispersion in composites by SC-CO2 assisted processing. Considering its wetting characteristic, 22 promoting phase inversion effect23,24 and intercalation effect 25 of SC-CO2, introducing it into the processing of material is favorable to improve GNPs dispersion. Generally, high-pressure autoclaves were employed to reach the supercritical state of CO2, belonging to batch approach and restricting the productivity. To satisfy the ever-expanding demand for CA composites with well dispersed GNPs, it is necessary to develop a continuous manufacturing method. Extrusion is a common continuous manufacturing process, in which single screw extruder is frequently adopted given its simple and cost-effective operation.26,27 However, it is rarely reported to introduce SC-CO2 into the screw extrusion process to modify GNPs dispersion in the CA matrix.
In this work, we introduced SC-CO2 into the CA/GNPs system to enhance GNPs’ dispersion during the extrusion process. Raman spectroscopy, scanning electron microscope (SEM), Fourier-transform infrared (FTIR) spectroscopy, slit-die rheometer and Thermogravimetric (TG) analysis were adopted to characterize the relative properties of CA/GNPs composite. As three main process parameters, it was researched that the influences of injection flowrate, temperature and screw rotation-rate on GNPs dispersion in CA matrix.
Experimental
Materials and devices
Table S1-2 in supplementary information provided the detailed information of materials (CA, acetone, ethanol, GNPs, CO2 and N2) and devices.
Sample preparation
Preliminary kneading of GNPs/CA composite
Firstly, CA, ethanol and acetone were measured according to the proportion of 2 g: 1.15 mL: 1.15 mL. Secondly, 0.27‰, 0.64‰, 1.25‰, 2.16‰, 3.43‰ GNPs were respectively weighed according to the weight of CA. Thirdly, the weighted ethanol, acetone and GNPs were added into a beaker for a 15 min sonication treatment with the ultrasonic cleaner. Fourthly, ethanol, acetone, GNPs and CA were added into the kneader for a 15 min kneading at 35°C condition. Finally, the CA/GNPs was stored with sealing bag to reduce the volatilization of ethanol and acetone.
Preparation of CA/GNPs composite samples
Preparation conditions of CA/GNPs samples.

Sample characterization
Dispersion characterization
Raman spectroscopy investigation
In 100-4000 cm−1 range, the Raman spectra of samples were collected by the confocal Raman microscope. In 1480-1680 cm−1 range, the map-image-acquisition function in live track mode was adopted to investigate the distribution of GNPs on samples’ surface.
Optical microscopy images processing
Figure S2 illustrated nine optical microscopy (OM) images were exported from nine random locations on the surface of every sample. Image-Pro Plus 6.0 was applied to process the images and measure the parameters (counts, diameter) of GNPs on samples’ surface in OM images.
Quantification of GNPs’ dispersion degree
Morishita index (I
δ
)
28
was introduced to evaluate the aggregation degree of dispersed phase


Scanning electron microscope investigation
The fracture surfaces of samples were investigated by SEM. The fracture surface of samples was gold coated before imaging.
Fourier-transform infrared spectroscopy investigation
In 4000-580 cm−1 range, the FTIR spectrometer with ATR accessories was used to analyze samples.
In-line shear viscosity measurement
The slit-die rheometer (shown in Figure S3) can measure the in-line rheological properties of CA/GNPs solution.
29
The shear viscosity (


Thermogravimetric analysis
Thermogravimetric analyzer was adopted to investigate the thermal property of CA/GNPs samples in 50–600°C range. The measurements were performed in a Al2O3 pan, pierced lid in the N2 atmosphere at 10 °C/min heating rate.
Result and discussion
Raman spectroscopy analysis
Figure S4 illustrated the position where Raman spectra were collected. According to Figure 1(a), the most prominent features in Raman spectrum of GNPs are G and G′ bands at 1580 and 2709 cm−1, corresponding to in-plane vibration of sp2 carbon atoms and layer stacking of carbon atoms.
30
While the bands at 1375 cm−1, 1434 cm−1, 1737 cm−1 and 2941 cm−1 were most noticeable in the Raman spectra of sample G0C0T37R9 and G1.25C0T37R9 (point Ⅱ).
31
G band at 1580 cm−1 is the most outstanding among all the characteristic bands of the spectrum of sample G1.25C0T37R9 (point Ⅰ), not for sample G1.25C0T37R9 (point Ⅱ). Therefore, the G band is suitable to distinguish GNPs and CA in map-image-acquisition process. (a): Raman spectra of GNPs, sample G0C0T37R9 and G1.25C0T37R9 (point Ⅰ and Ⅱ); (b): OM image of sample G1.25C0T37R9; (c): Raman map image in the 1480-1680 cm−1 ranges of sample G1.25C0T37R9.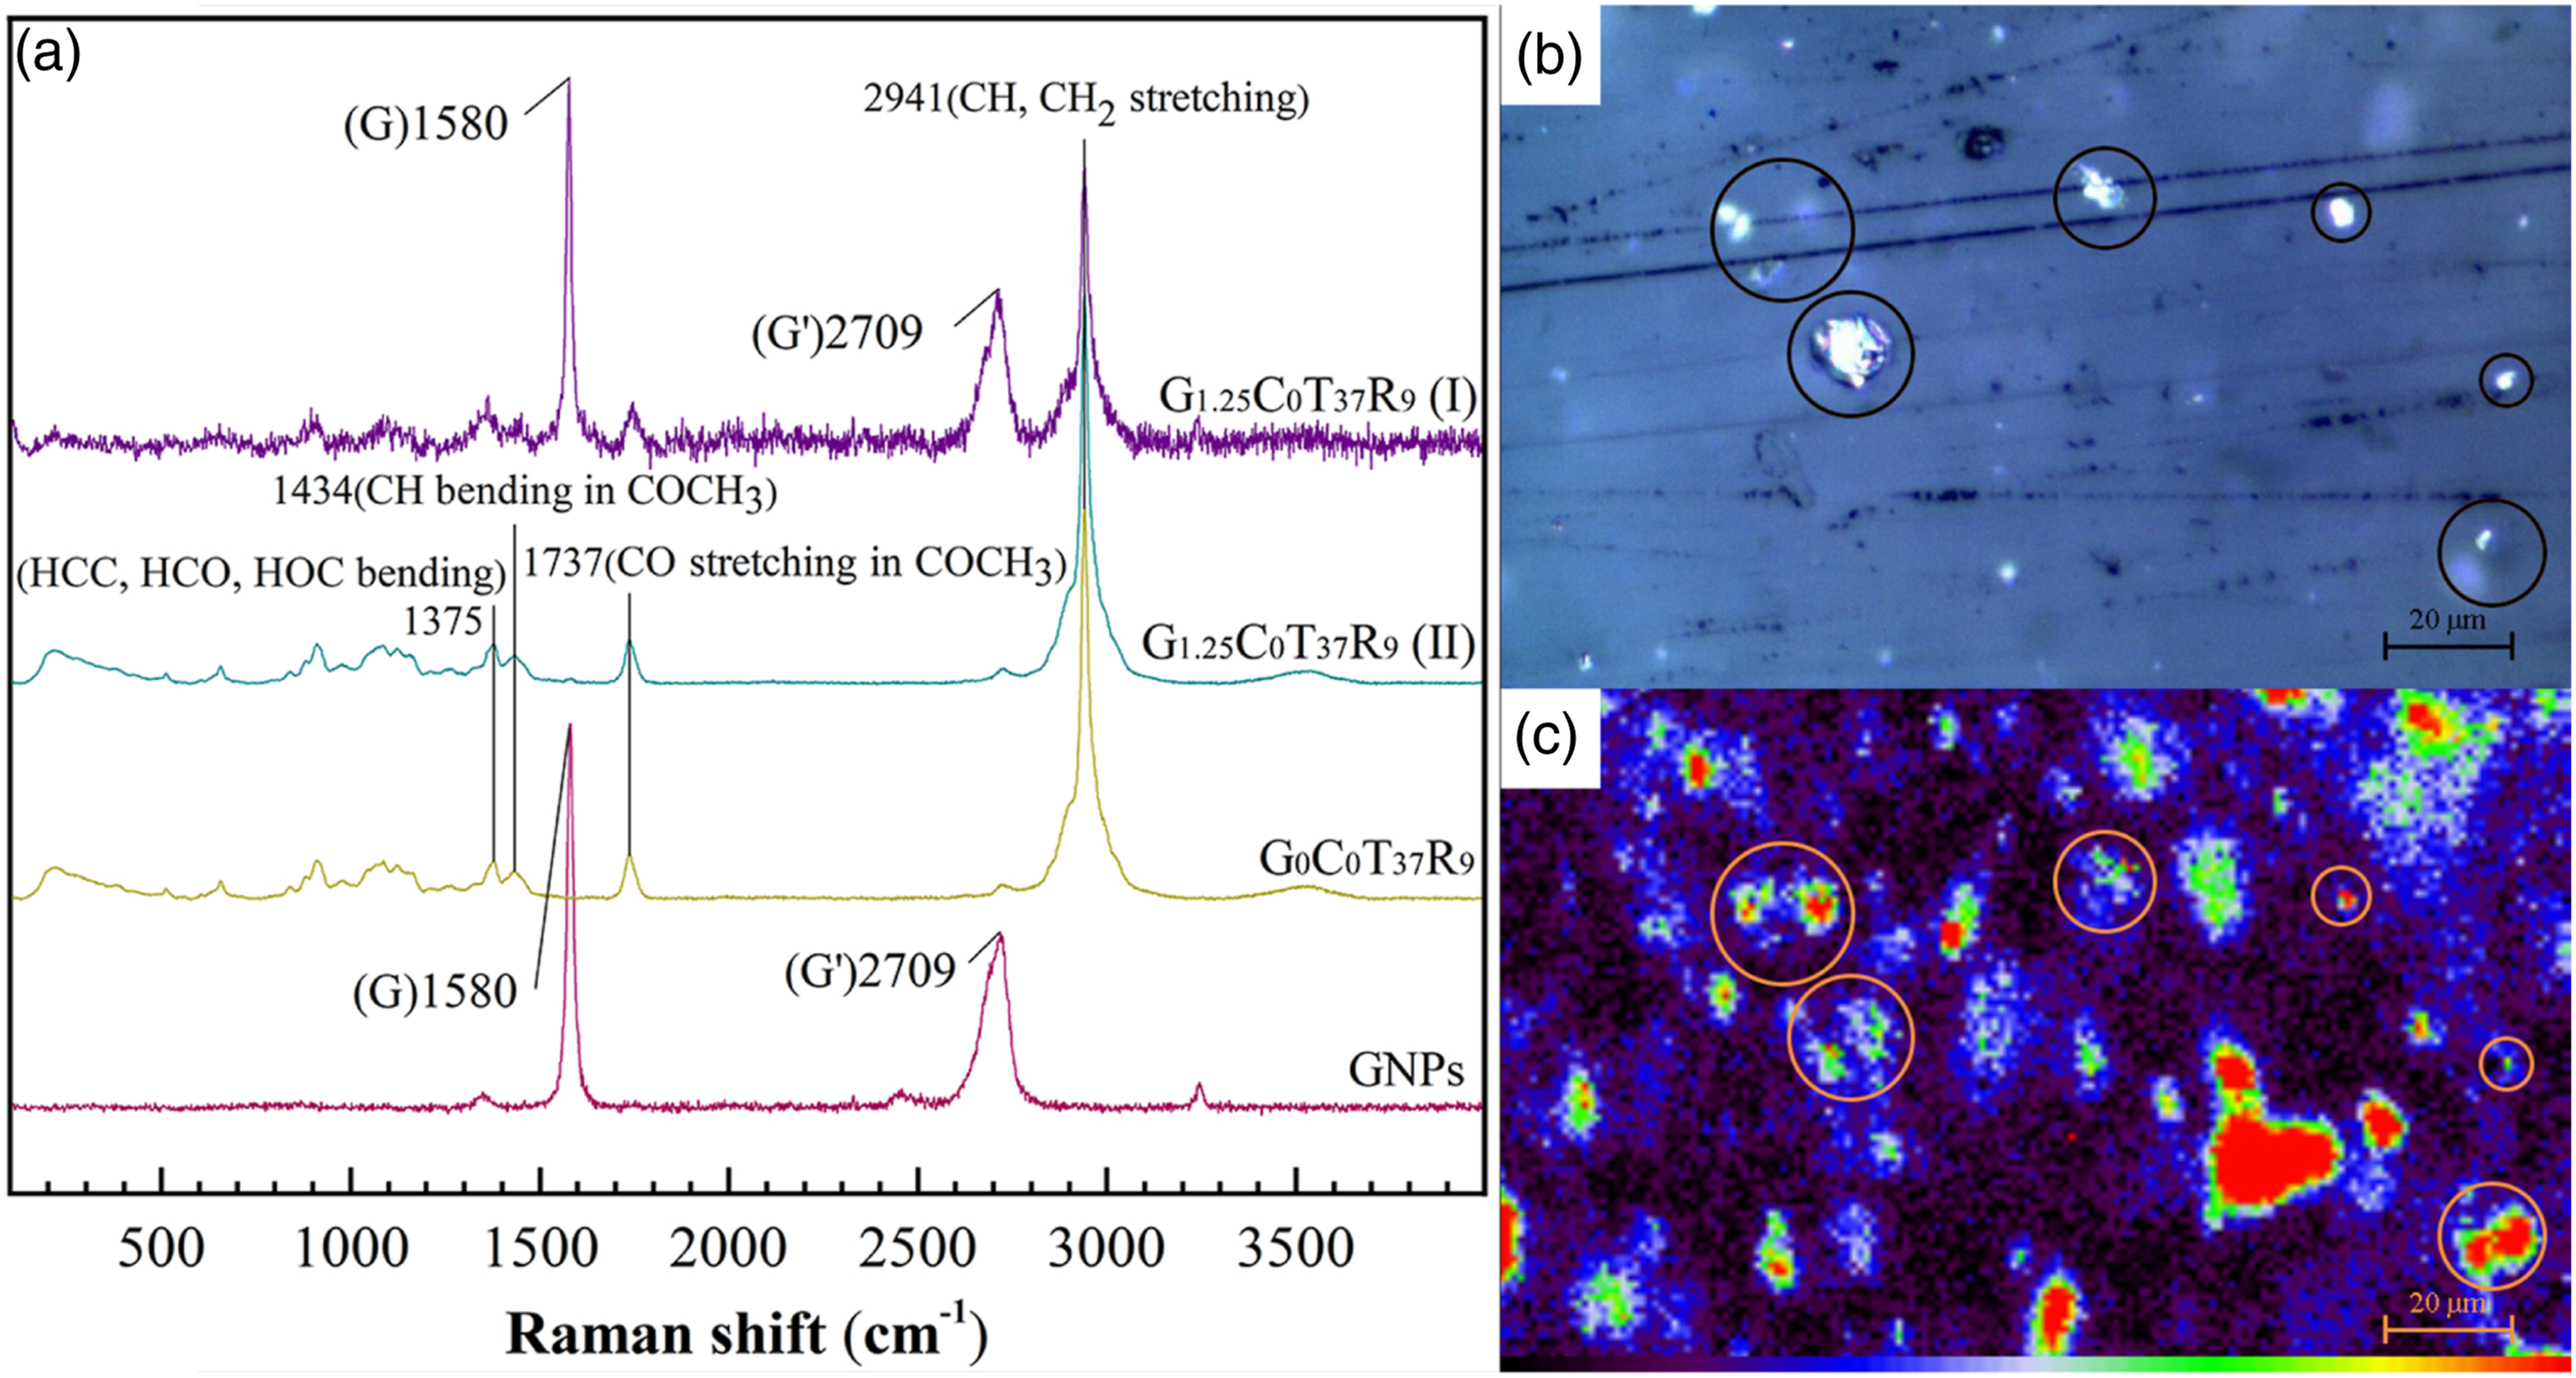
Figure 1(b-c) presented the OM and Raman map-image of sample G1.25C0T37R9 in 1480-1680 cm−1 range acquired from the same area. Figure 1(c) illustrated these areas marked with circles possess relatively more vigorous peak intensity, although not the strongest but correspond to the white plates in Figure 1(b) one-to-one. Which further confirmed the white plates randomly dispersed in Figure 1(b) are GNPs. Comprehensively, the OM images are more acceptable for dispersion characterizing due to sharper GNPs outline and less image acquisition time. As Figures S5-8 illustrated, the OM images were processed with Image-Pro Plus 6.0 software to be counted more accurately.
Average count and diameter(mean) distribution of GNPs in samples’ OM images
Figure 2(a) reflected the tendency of average count of GNPs, approximately classified as linear increment within the 0.27-3.43‰ content range. The standard deviation of GNPs counts increased with the increasing of content. Figure 2(b) showed the average count rose suddenly within 0-0.1 mL/min, then it gradually decreased within the 0.1 -0.5 mL/min range. The standard deviation of GNPs counts maintained a similar tendency with the average count curve. Figure 2(c) revealed the average count increased at first (31–33°C) and then decreased gradually with the temperature enhancing (33-41°C). Figure 2(d) presented the average count climbed with the increasing of rotation-rate. Furthermore, the inset plot of dispersion index I
δ
fluctuated within minimal range, indicating the GNPs counts of all group samples varied based on a similar dispersion extent foundation. Average count with a I
δ
inset graph of (a): content group (G0.27-3.43C0.3T37R9), (b): flowrate group (G1.25C0-0.5T37R9), (c) temperature group (G1.25C0.3T31-41R9), (d): rotation-rate group (G1.25C0.3T37R5-13) samples’ OM images.
Figure 3(a-d) presented the diameter (mean) distribution of GNPs in four group samples’ OM images, illustrating the diameter tended to distribute on the minor side for all group samples. Table S3 provided the detailed diameter (mean) distribution of GNPs, indicating it maintained relatively stable. Diameter(mean) distribution diagram of (a): content group (G0.27-3.43C0.3T37R9); (b): flowrate group (G1.25C0-0.5T37R9); (c) temperature group (G1.25C0.3T31-41R9); (d): rotation-rate group (G1.25C0.3T37R5-13).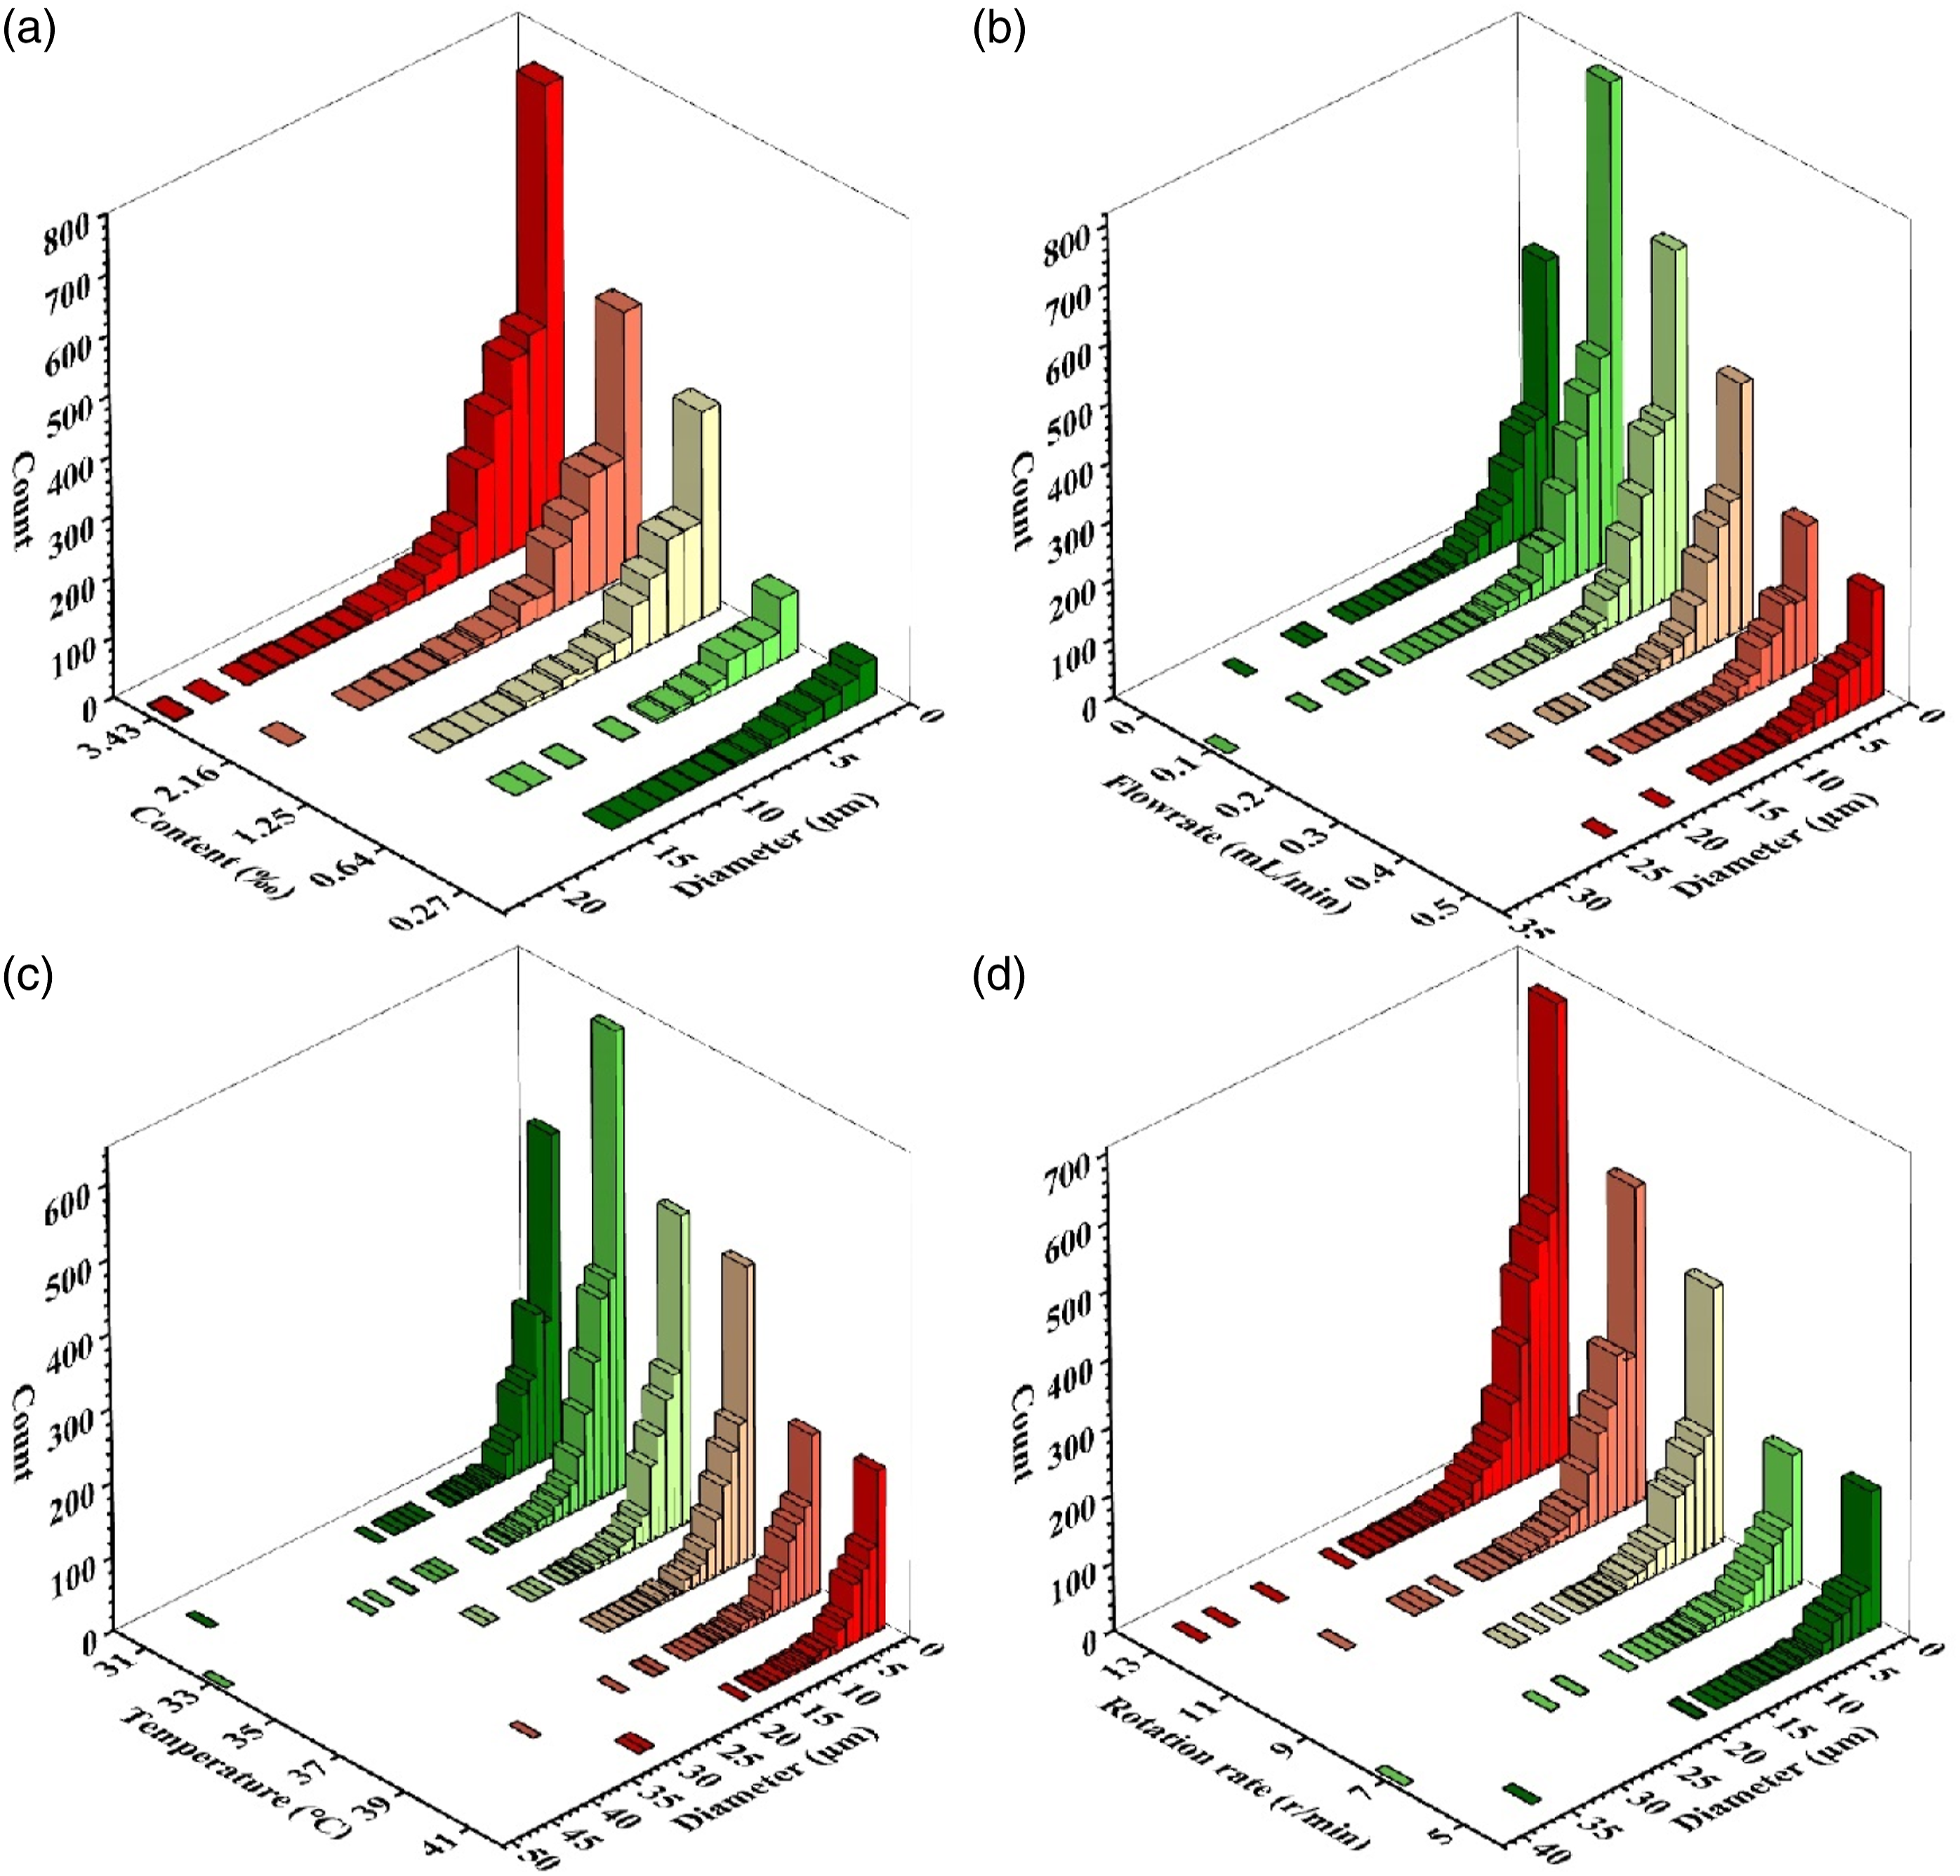
Optical microscopy and SEM micrographs analysis
A contradiction was exposed that sample’s average GNPs count with different process parameters drastically varied, while the dispersion index I
δ
and diameter distribution maintained stable. It can be explained by the transparency variety of GNPs dispersed in CA matrix treated by SC-CO2. Almost no transparent GNPs can be seen in Figure 4(a), (c), and (f), while Figure 4(b), (d), and (e) contained transparent and semi-transparent GNPs. Relevant research revealed that the optical reflection contrast enhances, and the transmittance declines with the increasing of graphene layer number.
32
Accordingly, SC-CO2 assisted extrusion process affected the layer number of GNPs dispersed in CA matrix. OM image of samples (a): G1.25C0.1T37R9; (b): G1.25C0.5T37R9; (c): G1.25C0.3T33R9; (d): G1.25C0.3T41R9; (e): G1.25C0.3T37R5; (f): G1.25C0.3T37R13.
Scanning electron microscope technique is not enough to visualize GNPs. However, the exfoliation process is very complex and with a high probability of not obtaining the whole range of particles. The not exfoliated platelets remain as stacks which can be dispersed, broken, etc. This effect can be detected by analyzing SEM micrographs, which sample preparation is quite simple among the electron microscope techniques. Figure 5(a-h) showed the SEM images of fracture surfaces of samples G0.27C0.3T37R9 G3.43C0.3T37R9, G1.25C0.1T37R9, G1.25C0.5T37R9, G1.25C0.3T33R9, G1.25C0.3T41R9, G1.25C0.3T37R5 and G1.25C0.3T37R13, from which we can figured out that the GNPs dispersed on the fracture surface of sample G3.43C0.3T37R9 were obviously more than that of sample G0.27C0.3T37R9. Besides, the stacking phenomenon of GNPs dispersed on the fracture surface of sample G3.43C0.3T37R9, G1.25C0.1T37R9, G1.25C0.3T33R9, and G1.25C0.3T37R13 was severer compared with that of sample G0.27C0.3T37R9, G1.25C0.5T37R9, G1.25C0.3T41R9 and G1.25C0.3T37R5. SEM micrographs furtherly verified the supposal that the SC-CO2 assisted extrusion process affected the layer number of GNPs dispersed in CA matrix. Scanning electron microscope images of samples (a): G0.27C0.3T37R9; (b): G3.43C0.3T37R9; (c): G1.25C0.1T37R9; (d): G1.25C0.5T37R9; (e): G1.25C0.3T33R9; (f): G1.25C0.3T41R9; (g): G1.25C0.3T37R5; (h): G1.25C0.3T37R13.
Fourier-transform infrared spectroscopy investigation
Graphene nanoplatelets’ FTIR spectra in Figure 6(a) presented no noticeable characteristic peaks, except the 2330.12 cm−1 band due to asymmetric tensile vibration of atmospheric CO2. It indicated that there were few oxygen-containing functional groups on GNPs’ surface, corresponding to the fact that the commercial GNPs were fabricated by liquid-phase exfoliation method.33-35 As for the remaining curves in Figure 6(a-d), similar characteristic peaks were observed around 1030.63, 1216.19, 1368.08 and 1733.30 cm−1, except the broad band around 3460 cm−1 due to atmospheric moisture.
36
It can be inferred the SC-CO2 assisted extrusion process and the introducing of GNPs have limited effect on samples’ characteristic peak wavenumbers. Accordingly, there is no solid chemical interaction between GNPs and CA matrix. Fourier-transform infrared spectra of samples (a): (G0-3.43C0.3T37R9) and pure GNPs; (b): (G1.25C0-0.5T37R9); (c): (G1.25C0.3T31-41R9); (d): (G1.25C0.3T37R5-13).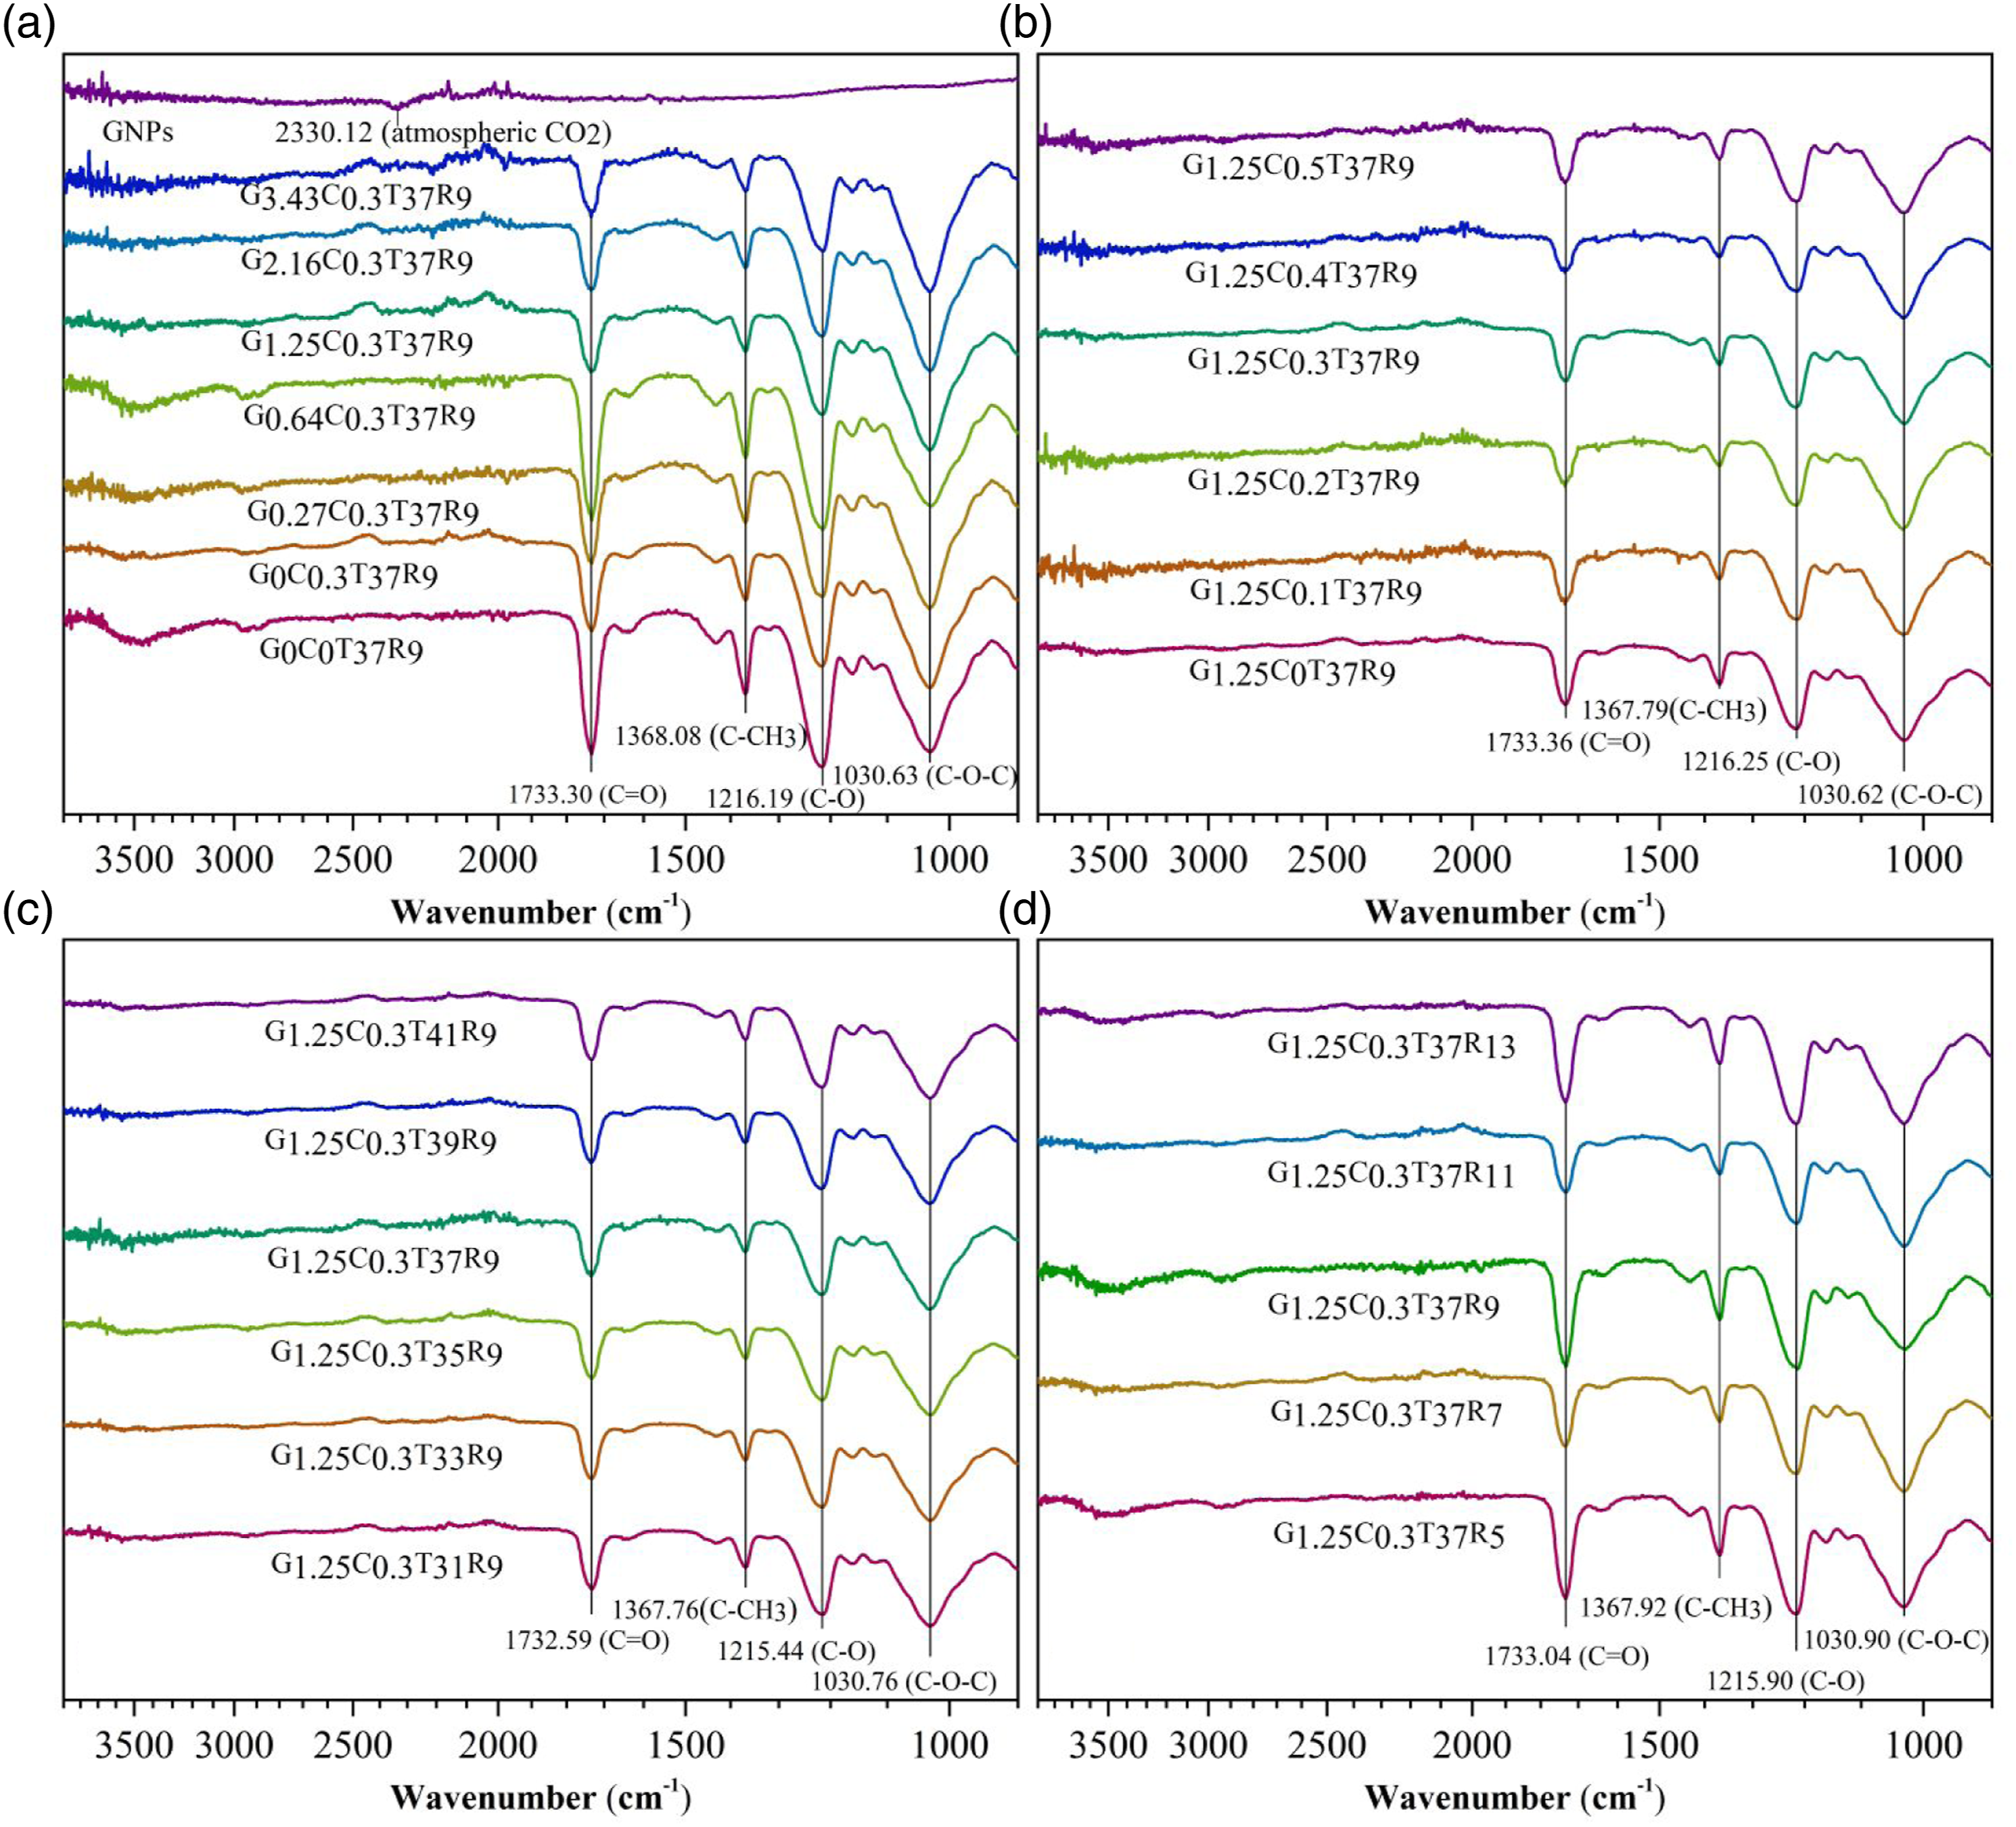
Influences of process parameters
Figure 7 illustrated the process was divided into two states based on the quantity of injected SC-CO2. Figure 6(b) revealed there was no strong chemical interaction between GNPs and matrix. At 0.1-0.3 mL/min state, limited SC-CO2 dissolved in CA matrix, leading to CO2 molecules preferentially aggregating at the interface of GNPs and CA matrix. The aggregation of CO2 molecules further weakened the shear stress that matrix implemented to GNPs’ outer layer, making it harder for GNPs to be exfoliated than without SC-CO2 assistance state. At 0.3-0.5 mL/min state, enough SC-CO2 dissolved in CA matrix, leading to CO2 molecules not only aggregating at the interface of GNPs and CA matrix but also inter the GNPs layers. Which simultaneously weakens the shear stress that matrix implements to GNPs’ outer layer and the interaction of GNPs’ interlayers. Meanwhile, CO2 molecules enhanced CA chains’ motion ability due to the disentanglement, interaction weakening and lubrication effects. Therefore, CA chains moved more easily into the interval of GNPs layers with the rise of CO2 injection flowrate.
37
And the average visible GNPs count of samples G1.25C0.5T37R9 decreased by 74.79% compared with the samples G1.25C0.1T37R9. Exfoliation schematic diagram of GNPs with SC-CO2 assistance.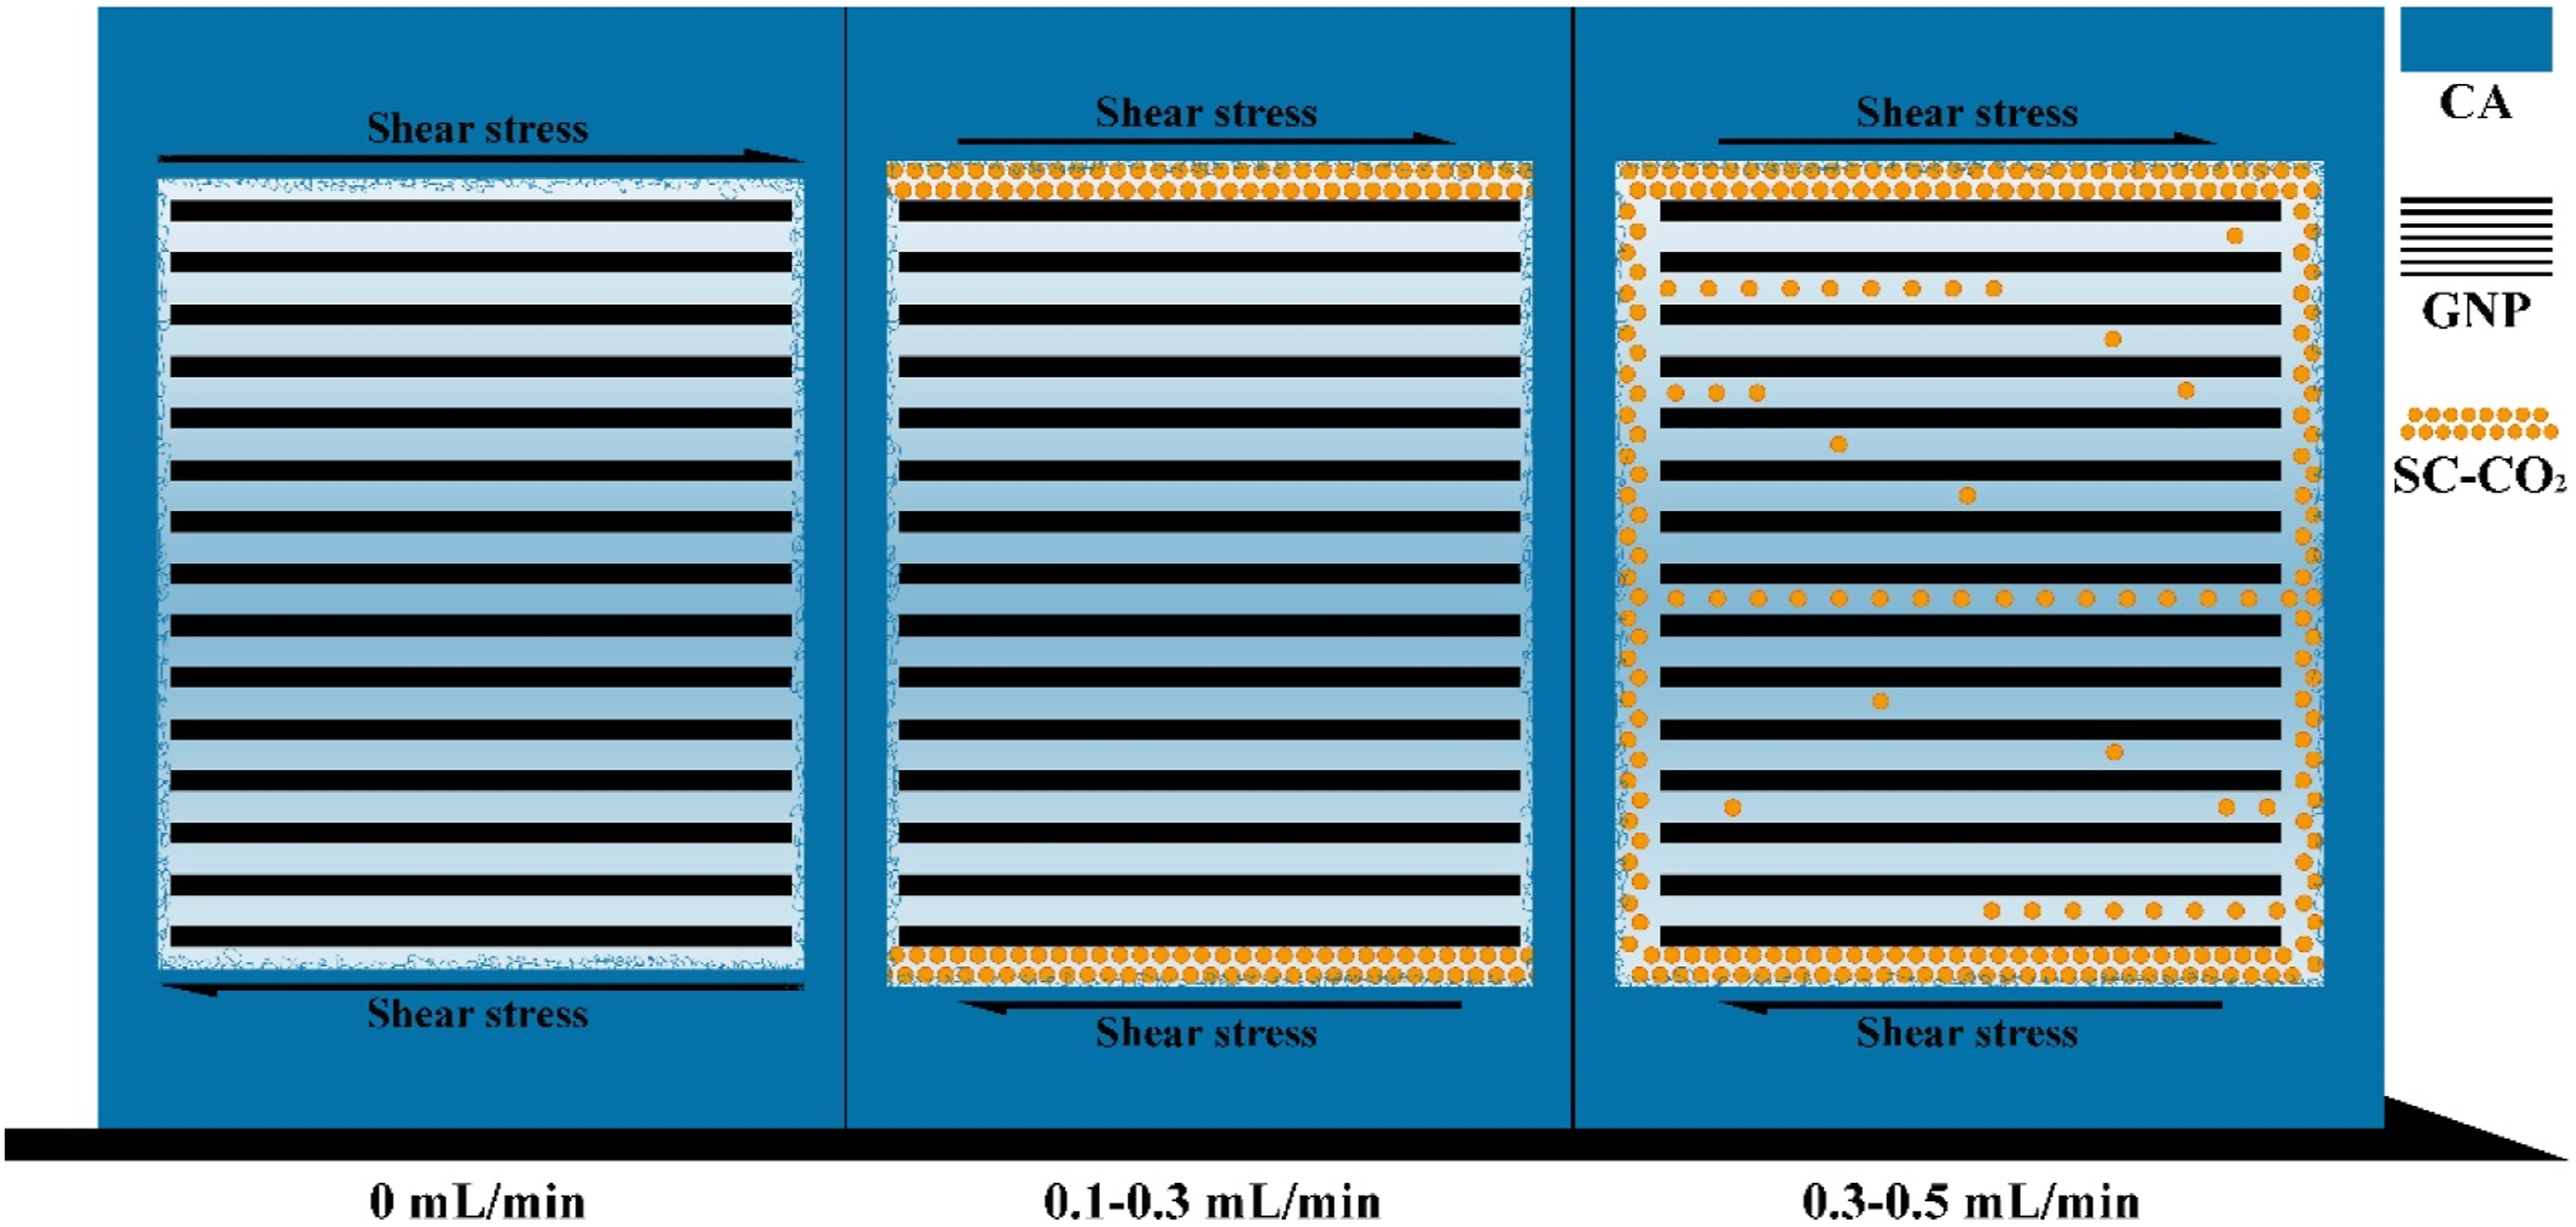
For temperature group, injected CO2 was beneath the critical point under 31°C condition, leading to few CO2 penetrated in CA matrix. Under 33°C condition, CO2’s dissolubility underwent a sudden rise, causing more CO2 dissolving in CA matrix. However, the diffusion coefficient of SC-CO2 was not large enough to support its diffusing into GNPs’ interlayer. Figure 6(c) showed there was no intense chemical interaction between GNPs and CA matrix, so CO2 molecules were likely to aggregate at the interface of GNPs and CA matrix, which further weakened the interaction of GNPs and CA matrix. Accordingly, the average GNPs count abruptly increased at 33°C. As the temperature rose continuously, the aggregation of CO2 molecules within the interval of GNPs layers increased owing to dissolubility enhancing, which further weakened GNPs’ interlayer interaction. Macroscopically, the average count of visible GNPs decreased with the temperature climbing, that of samples G1.25C0.3T41R9 decreased 63.63% compared with the samples G1.25C0.3T33R9. The result implied a high temperature of the SC-CO2 during extrusion process is favorable to reduce layer numbers of GNPs dispersed in CA matrix.
Figure 8 provided the negative correlation between Flow curve of rotation-rate group (G1.25C0.3T37R5-13).

Influences of GNPs' dispersion on the thermal stability of CA/GNPs samples
Thermogravimetric analysis was adopted to study whether there was an improvement of CA/GNPs samples’ thermal stability. TG curves in Figure 9(a) revealed the presence of a two-stage weight-loss process, ascribed to the thermal decomposition
41
with about 2% and 88% weight-loss. From the DTG curves, the weight-loss process appeared in the 214–240°C and 290–420°C ranges, respectively. From the inset graph of Figure 9(b), the maximum loss rate of the first weight-loss stage located at 229°C and 223°C for samples G0.27C0.3T37R9 and G3.43C0.3T37R9. While the maximum-weight-loss rate of the second weight-loss stage (at 372°C) showed no difference between samples G0.27C0.3T37R9 and G3.43C0.3T37R9, perhaps due to the GNPs content is too low to influence the second weight-loss stage. However, it was evident that introducing GNPs affected the decomposition of the first weight-loss stage of samples. The sample G0.27C0.3T37R9 possessed a better thermal stability than that of sample G3.43C0.3T37R9, which might be ascribed to the thickness diversity of GNPs in samples. The excellent thermal conductivity of GNPs will decrease with the increase of GNP layers.
18
As a result, GNPs filler will reversely decrease the thermal conductivity of polymer composites and further weaken the thermal stability of samples. Thermogravimetric curves of samples (a): G0.27C0.3T37R9 and G3.43C0.3T37R9; (c): G1.25C0.1T37R9 and G1.25C0.5T37R9; (e): G1.25C0.3T33R9 and G1.25C0.3T41R9; (g): G1.25C0.3T37R5 and G1.25C0.3T37R13; DTG curves of samples (b): G0.27C0.3T37R9 and G3.43C0.3T37R9; (d): G1.25C0.1T37R9 and G1.25C0.5T37R9; (f): G1.25C0.3T33R9 and G1.25C0.3T41R9: (h): G1.25C0.3T37R5 and G1.25C0.3T37R13.
As analyzed in the previous section, injection flowrate, temperature and screw rotation-rate influenced the dispersion of GNPs in samples. Moreover, the GNPs in the samples G1.25C0.5T37R9, G1.25C0.3T41R9 and G1.25C0.3T37R5possessed fewer layers than samples G1.25C0.1T37R9, G1.25C0.3T33R9 and G1.25C0.3T37R13. Figure 9(c-h) presented the TG and DTG curves of CA/GNPs samples with different preparation condition. All the TG curves displayed similar two-stage weight-loss shapes, while the DTG curves presented the various temperature, that the maximum-weight-loss rate of the first weight-loss stage appeared at. When the introduced GNPs content is merely 1.25‰, the maximum-weight-loss rate of the first weight-loss-stage of samples G1.25C0.5T37R9, G1.25C0.3T41R9 and G1.25C0.3T37R5 appeared at 212, 224 and 225°C, while the maximum-weight-loss rate of the first weight-loss-stage of samples G1.25C0.1T37R9, G1.25C0.3T33R9 and G1.25C0.3T37R13 appeared at 207, 219 and 219°C, with an increment of 5,5 and 6°C, respectively.
Conclusion
The SC-CO2 assisted extrusion process positively promotes GNPs dispersion in the CA matrix, which is mainly reflected in the GNPs layer numbers. Besides, the process has limited influence on the GNPs’ diameter and dispersion uniformity. SC-CO2 injection flowrate, temperature, and rotation-rate show different influence tendencies as three main factors. For SC-CO2 injection flowrate, low flowrate is unfavorable to GNPs dispersion due to the aggregation of CO2 molecules between GNPs’ outer layer and CA matrix weakening the stress that CA matrix implemented to GNPs. However, high flowrate is favorable to GNPs dispersion which is attributed to the SC-CO2 simultaneously weakening the inter-layer interaction of GNPs. In case of the temperature, a high temperature is favorable to GNPs dispersion within the range from 33°C to 41°C, owing to the high diffusivity of SC-CO2 at high temperature. For screw rotation-rate, a high rate is unfavorable to GNPs dispersion due to the shear thinning effect and residence time shortening of CA/GNPs solution. Finally, TG analysis reveals that the well GNPs dispersion is beneficial for improving the thermal stability of CA/GNPs composite, even when the content of GNPs is merely 1.25‰. Based on the results obtained, improving GNPs dispersion of through supercritical assisted extrusion still exists inadequacies as compared with previous works. For instance, not referring the improving effect of high GNPs content, not investigating other properties and not substituting solvent thoroughly. These directions mentioned above are worth investigating in future research. However, the method of improving GNPs dispersion by supercritical assisted extrusion still possesses an extensive application prospect, such as biosensor technology, biomedical applications and nanofiltration membrane, etc.
Supplemental Material
Supplemental Material - A method of improving the dispersion of graphene nanoplatelets in cellulose acetate based composite
Supplemental Material for A method of improving the dispersion of graphene nanoplatelets in cellulose acetate based composite by Qipeng Hu, Han Gu, Chao Wang, Yajun Ding and Sanjiu Ying in Polymers and Polymer Composites
Footnotes
Declaration of Conflicting Interests
The author(s) declared no potential conflicts of interest with respect to the research, authorship, and/or publication of this article.
Funding
The author(s) received no financial support for the research, authorship, and/or publication of this article.
Supplemental Material
Supplemental material for this article is available online.
References
Supplementary Material
Please find the following supplemental material available below.
For Open Access articles published under a Creative Commons License, all supplemental material carries the same license as the article it is associated with.
For non-Open Access articles published, all supplemental material carries a non-exclusive license, and permission requests for re-use of supplemental material or any part of supplemental material shall be sent directly to the copyright owner as specified in the copyright notice associated with the article.