
Abstract
To solve the problem that the curing mechanism evolution of phenolic resin catalyzed by Ba(OH)2 remained unclear, the p-p methylene index, o-p methylene index, o-o methylene index, hydroxymethyl index, and ether index were introduced to quantitatively investigate the chemical structure of resin in the curing temperature range of 90–230°C. The chemical structures were investigated by variable temperature FT-IR. The gas products released with the increase of curing temperature were characterized by Thermogravimetry-Mass Spectrometry. The curing mechanism from 90°C to 230°C was concluded finally. The results show that the main reaction is the formation of the p-p methylene group in the range of 90–120°C. It is difficult to form the o-p methylene bridge at this stage. In the range of 120–160°C, the main reaction is the formation of the p-p methylene group. From 160°C to 190°C, the main reactions are the breaking of the ether bond, the formation of the carbonyl group and the propyl bridge. Above 190°C, the main reactions are polycondensation reaction among phenolic hydroxyl groups, and the formation reaction of carbonyl groups. The ether bond breaks completely above 230°C. This work provides a new method to investigate the curing mechanism. It is a benefit for the rational design of the curing process of phenolic resin-based composites.
Keywords
Introduction
As one of the three major synthetic resins, phenolic resin is widely applied in the field of aerospace,1,2 aviation, 3 and flame retardant insulation materials. 4 According to the molar ratio of aldehyde to phenol and the catalyst used in the synthesis reaction, they can be divided into novolac phenolic resin and resole phenolic resin. The chemical structure of phenolic resin varies with different synthesis conditions. The diversity of its chemical structure determines the complexity of the curing process of phenolic resin. At the same time, the species diversity of phenolic resin also leads to completely different curing reaction mechanisms of different resins. 5 Although the batch production and application of phenolic resin has a history of one hundred years, the curing mechanism of resin with different synthesis conditions remains unclear. Therefore, the chemical structure evolution of phenolic resin during the curing process has always been the focus of research in this field, which has important guiding significance for the reasonable design of composite curing process, especially in the manufacturing engineering of automatic impregnation curing system.
The curing mechanism investigation of phenolic resin has never been interrupted, mainly involving two aspects of curing reaction kinetics6–8 and curing reaction mechanism,9–12 by the means of differential scanning calorimetry (DSC),13–16 infrared spectroscopy,17,18 dynamic mechanical analyses (DMA),19,20 nuclear magnetic resonance (NMR),21–23 etc. Typically, the nonisothermal activation energy of the curing reaction of phenolic resin was determined to be 72.23 kJ/mol with the Kissinger equation by Zhou and his coworkers. 24 The curing reaction kinetics was analyzed with an nth-order reaction model and n was calculated to be 0.92 from the Crane equation. The main curing reaction is condensation between the hydroxymethyl and unsubstituted active hydrogen of phenol ring, cleavage reaction of ether bond, accompanied with the gas release of water and formaldehyde.18,25 Christjanson et al. 26 investigated the curing mechanism of phenolic resins with different molar ratios of phenol/formaldehyde/sodium hydroxide by NMR, which indicated that sodium hydroxide promoted the combination of para substitution of formaldehyde and phenol. During the curing process of phenolic resin, the main reactions are the condensation between hydroxymethyl and para active hydrogen of a phenolic ring, and the release and oxidation of formaldehyde via self-condensation of hydroxymethyl. Besides, the dehydration condensation reaction of phenolic resin begins at 363 K, leading to the increase of molecular size. Until 403 K, the exothermic reaction of dehydration condensation exceeds the endothermic reaction of volatilized water and other small molecules. In the range of 403–523 K, the dehydration condensation reaction mainly occurred. When the temperature is above 543 K, the resin with stable chemical structure, constant weight, and small exothermic enthalpy is obtained, which infers that the curing reaction is basically completed. 27 Therefore, in the design of the curing system, a slow heating rate is conducive to the release of small molecules.
From the previous studies, a general consensus can be obtained that the curing reactions of phenolic resin are mainly the dehydration condensation reaction between ortho (or para) hydroxymethyl and ortho (or para) active hydrogen of phenol ring to form methylene, as the main reactions. The secondary reaction is mainly the condensation reaction between hydroxymethyl and hydroxymethyl to form an ether bond, the cleavage reaction of an ether bond to form formaldehyde, and the formation reaction of carbonyl (or quinone) group. However, up to now, the quantitative analysis of the formation of the methylene groups with different substituents, and the analysis of accompanying gas products with the rise of curing temperature have not been investigated. The curing reaction evolution of phenolic resin catalyzed by Ba(OH)2 with the rise of temperature has also not been reported.
In this paper, to design composite curing process reasonably, the curing mechanism evolution of phenolic resin catalyzed by Ba(OH)2 was investigated by variable temperature FT-IR and Thermogravimetry Mass Spectrometry (TG-MS). The p-p methylene index, o-p methylene index, o-o methylene index, hydroxymethyl index, and ether index were introduced to quantitatively describe the chemical structure of resin in the curing temperature range of 90–230°C. In general, this work serves as a novel approach to investigate the curing mechanism of phenolic resin. The achievement may be helpful for the rational design of the curing process system of phenolic resin-based ablation composites.
Experimental
Materials
Phenolic resin catalyzed by Ba(OH)2 was purchased from Beijing Composite Materials Co., Lt, which did not contain solvent. The synthesis condition of the phenolic resin: 1.3:1 for the ratio of formaldehyde to phenol, 8.0–9.0 for the pH value. The content of free phenol and formaldehyde in the resin is 15–17% and <1%, respectively, which were provided by the Beijing Composite Materials Co., Lt.
Characterization


Wavenumbers (cm−1) and assignments of the FTIR spectra of ph.enolic resin.

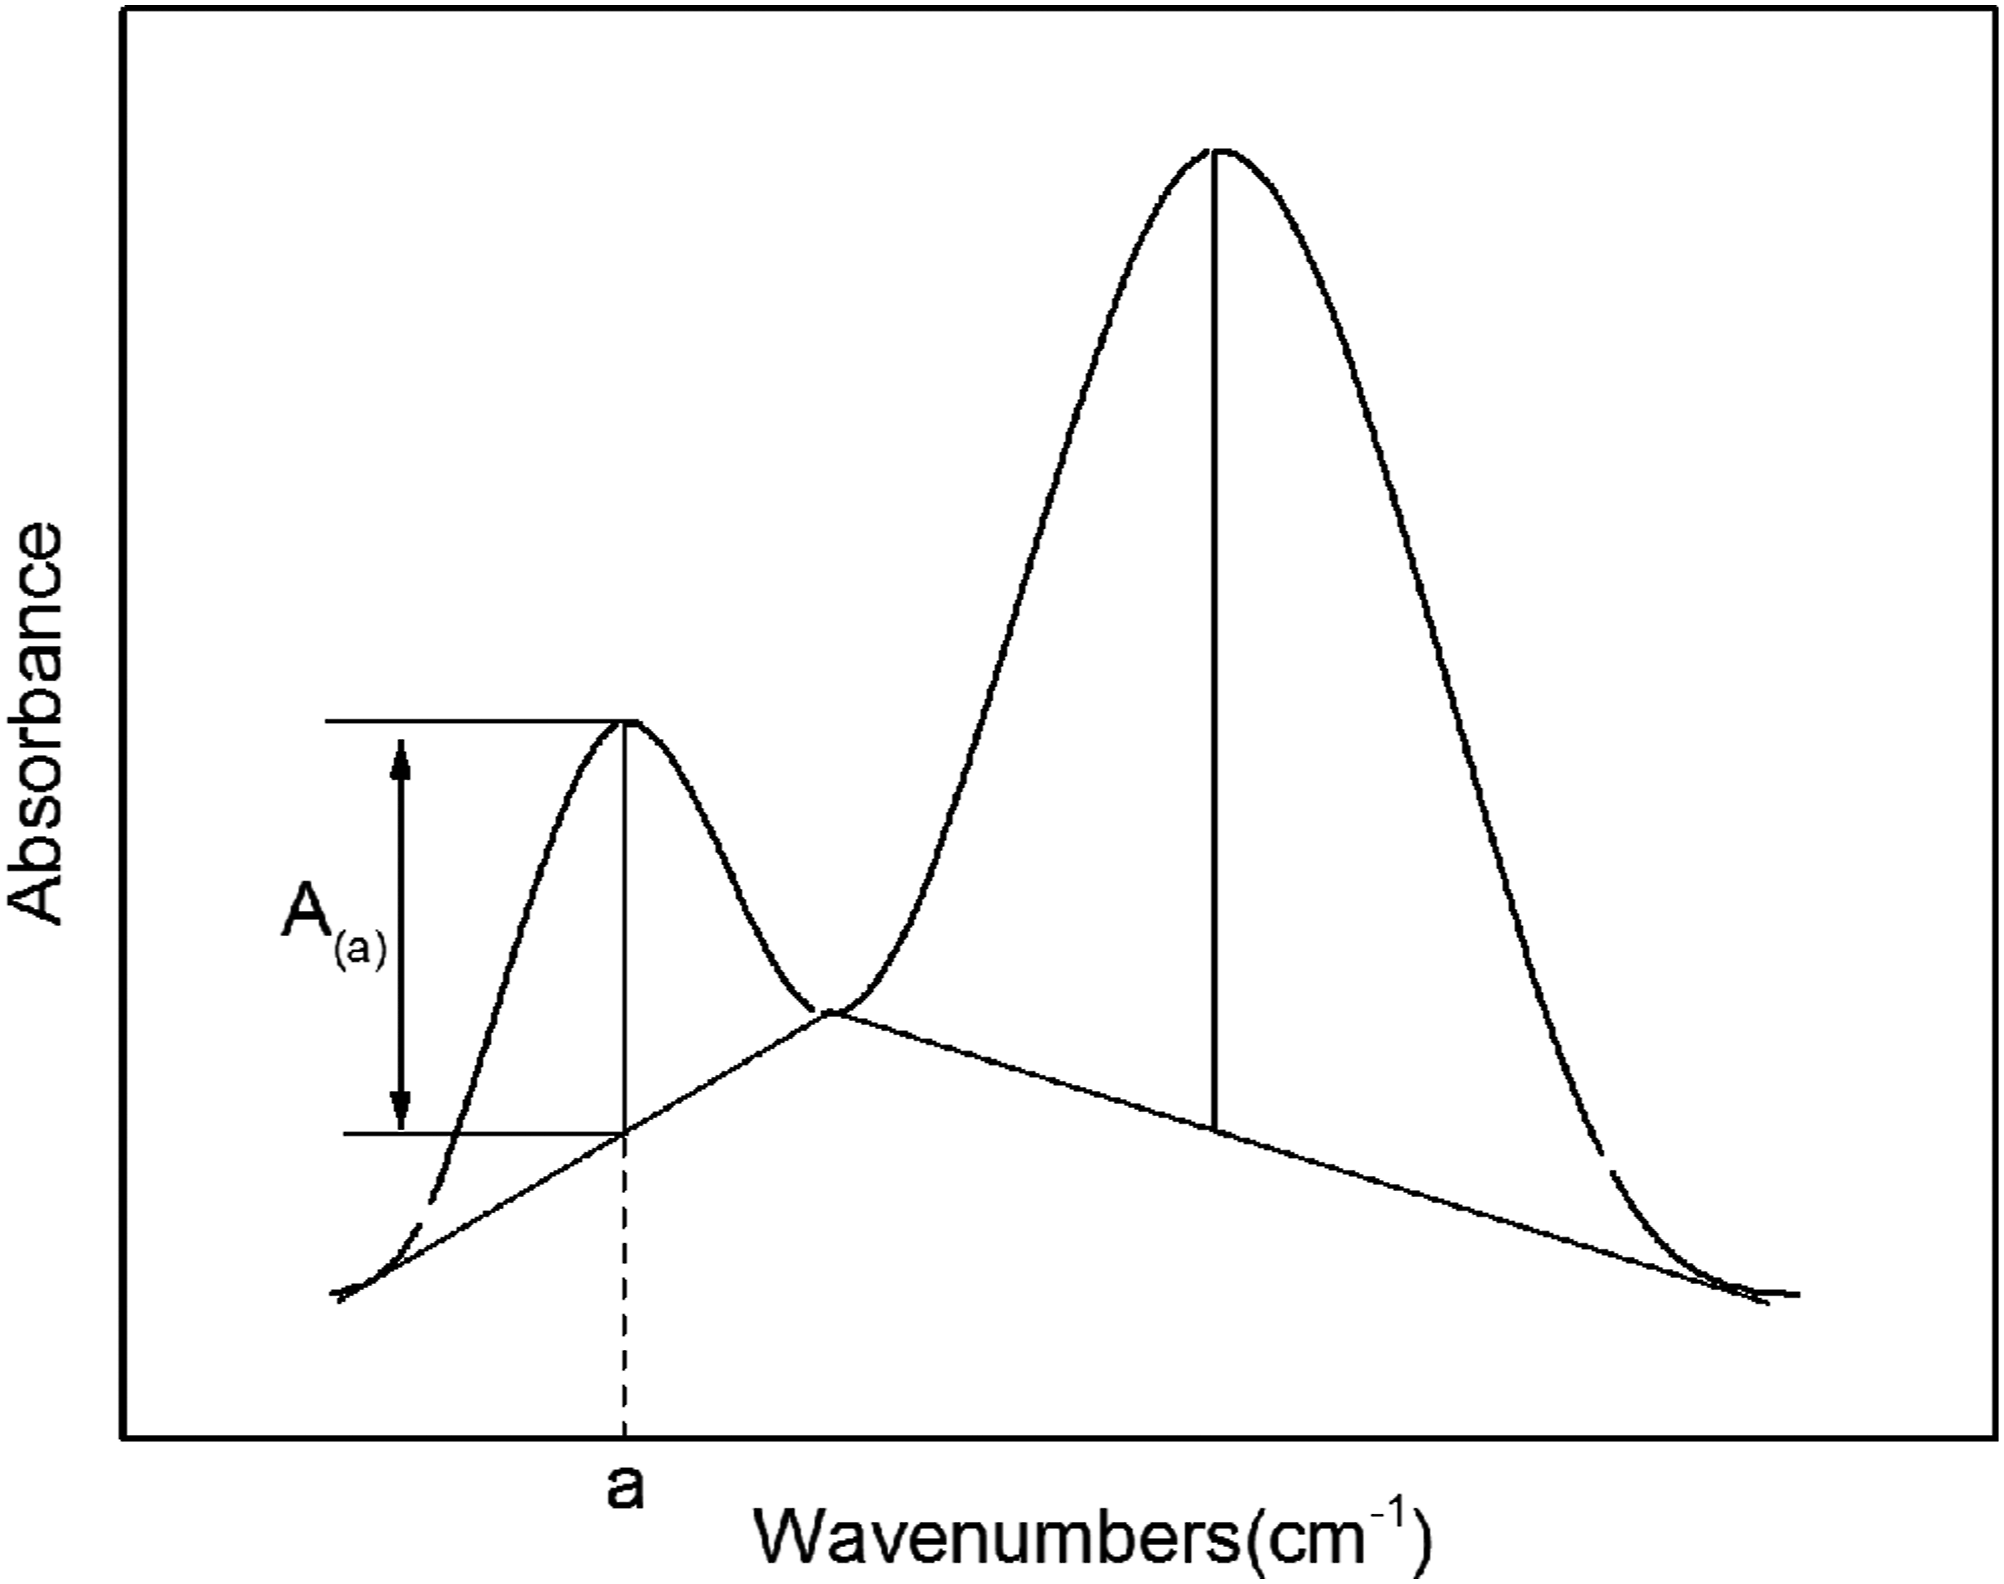
Drawing method of baseline.
TG-MS(NETZSCH STA 409-MS-Skimmer) was employed to separate and identify the volatiles during the curing process. 7 ± 2 mg resin sample was heated from room temperature to 300°C under helium gas protection at a heating rate of 10°C/min. The gas products released during curing were measured and the ion scanning mode was selected.
The curing temperature was decided by Differential Scanning Calorimetry, Setaram DSC141. The test method refers to ‘Plastics-Phenolic resins-Determination of heats and temperatures of reaction by differential scanning calorimetry’ (ISO 11409). The phenolic resin was heated from room temperature to 300°C under nitrogen protection at a heating rate of 10°C/min.
Results and discussion
Chemical structure
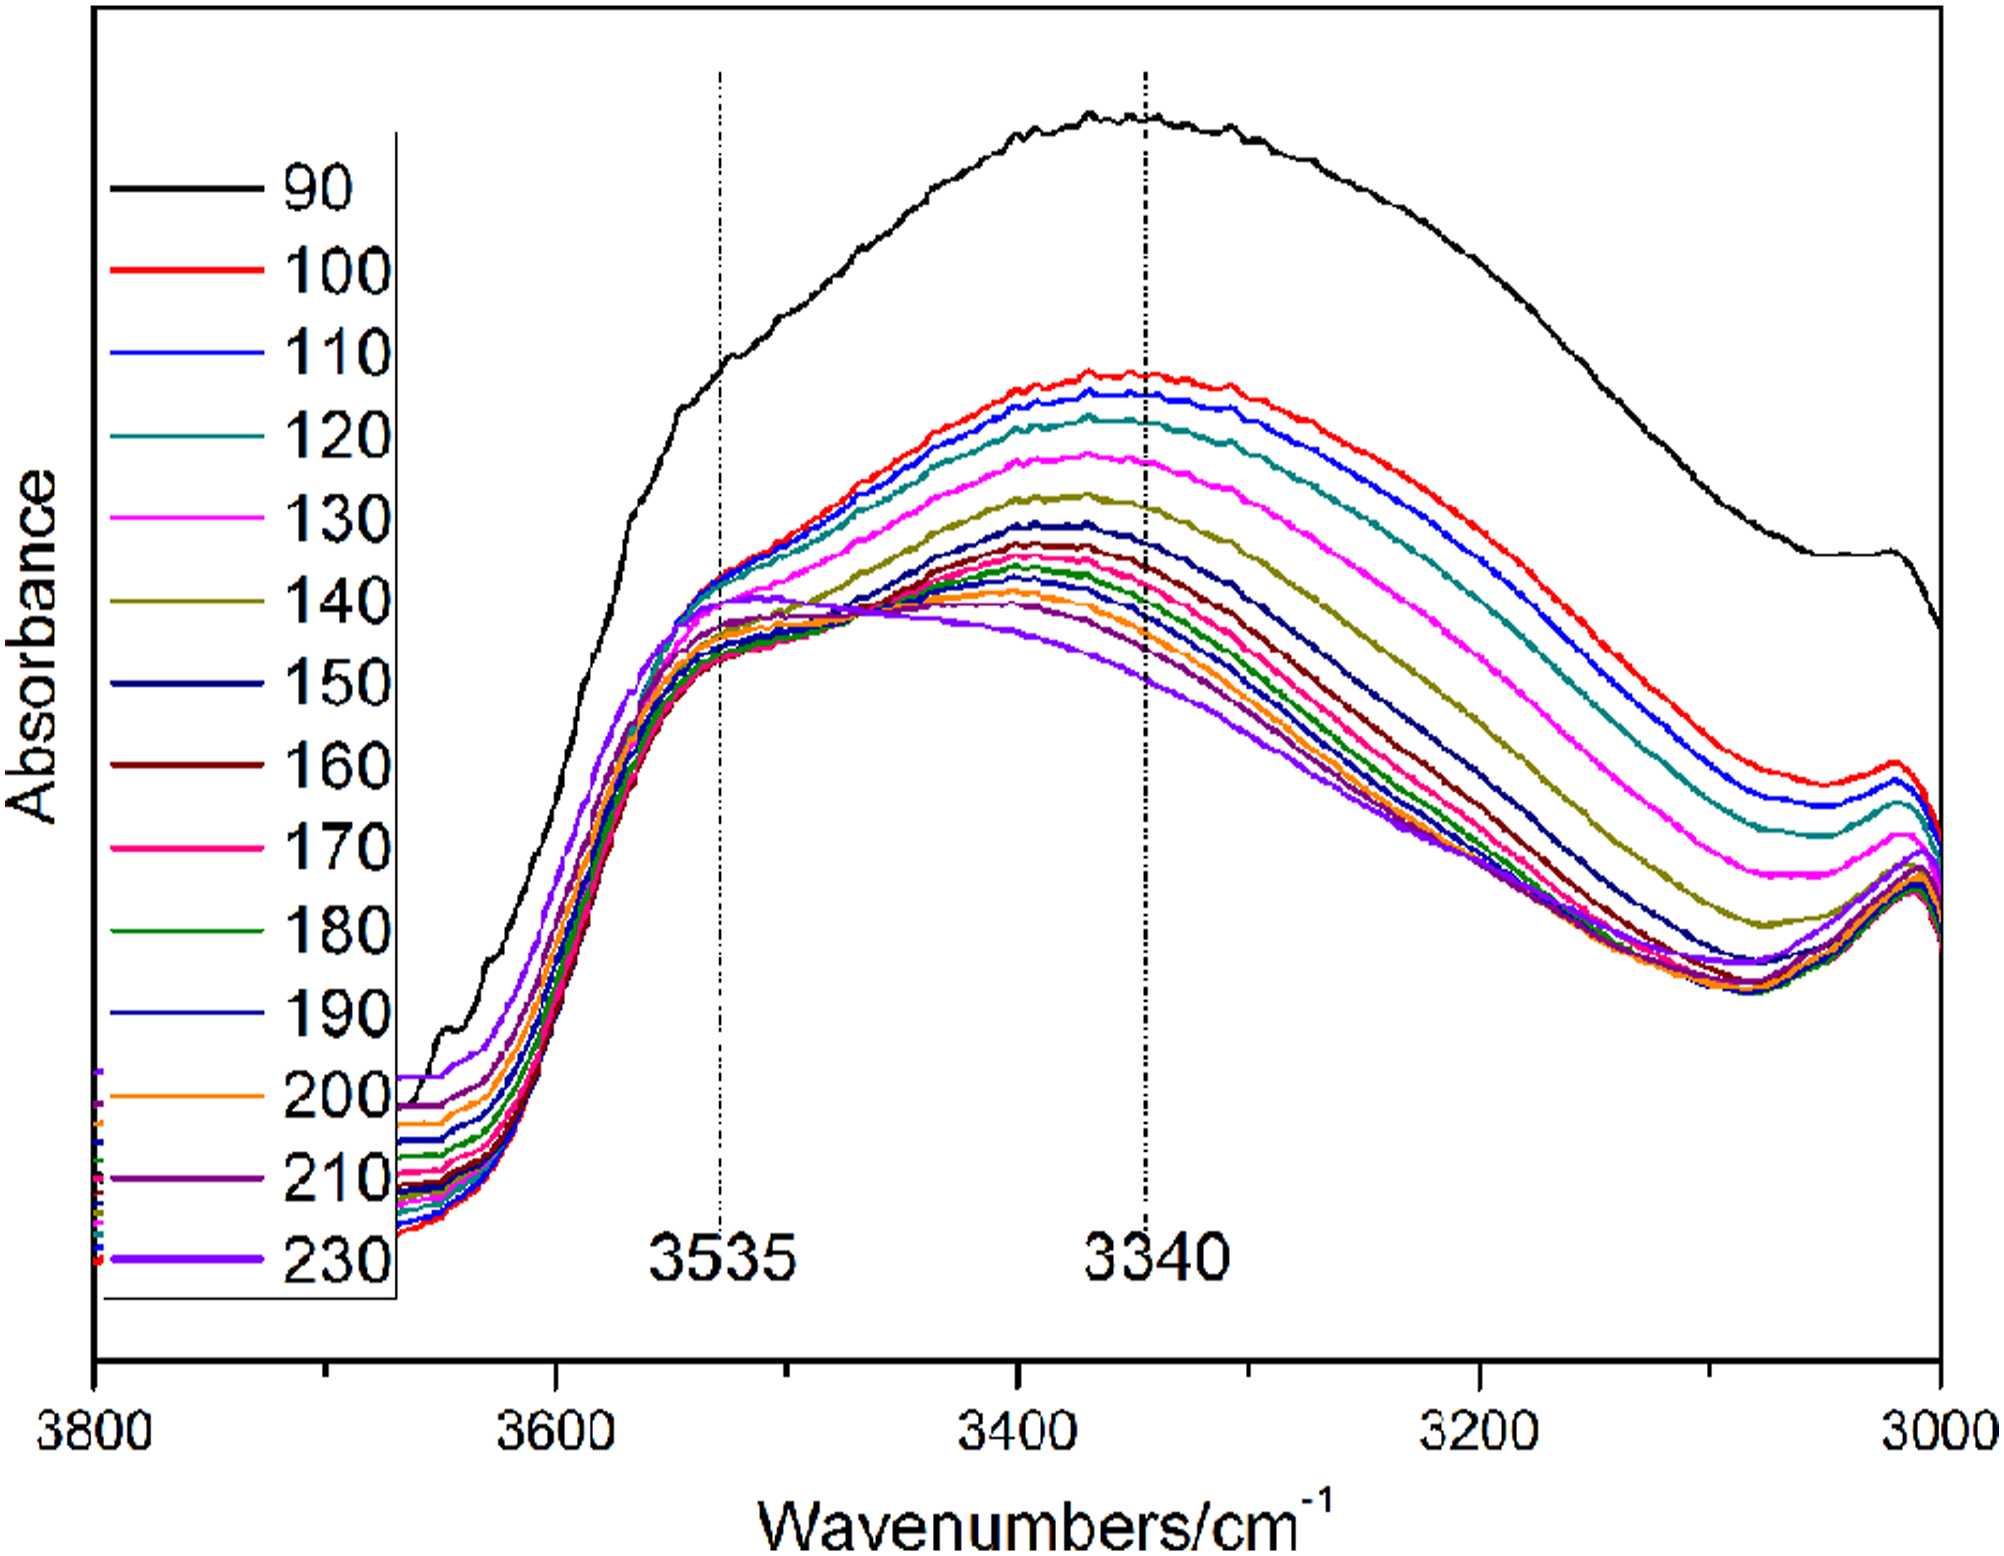
Figure 2 shows the variable temperature FTIR spectra of phenolic resin catalyzed by Ba(OH)2. The absorption peak at 3300–3500 cm−1 is the O-H stretching vibration. The C-H stretching vibration of methylene is in the range of 2810–2960 cm−1. The carbonyl absorption peak is at 1654 cm−1. The C=C absorption peak of benzene ring is at 1610 cm−1. The absorption peaks at 1440 cm−1, 1455 cm−1, 1480 cm−1 corresponds to o-o methylene, o-p methylene, and p-p methylene, respectively. The structural formula of the methylene with different substitution positions is shown in Figure 3. The characteristic absorption peaks of ether bond and hydroxymethyl are at 1055 cm−1 and 1010 cm−1, respectively. The assignments of absorption peaks of phenolic resin are shown in Table 1. Variable temperature FTIR spectra of phenolic resin. The structural formula of different substituent methylenes. (a) o-o methylene; (b) o-p methylene; (c) p-p methylene.

Quantitative analysis of characteristic structure
The curing mechanism of phenolic resin is mainly based on the condensation reaction between hydroxymethyl and active hydrogen of phenol ring, and the condensation reaction between hydroxymethyl to form methylene and ether bond respectively, and release water, formaldehyde, and other small molecules. Therefore, the hydroxymethyl index, methylene index, and ether bond index of resin can be used to investigate the curing process of phenolic resin.
Analysis of FTIR spectra of phenolic resin.

Curing reaction mechanism
Figure 4 shows the infrared spectrum of the methylene absorption peak at variable temperature. According to Figure 3, the curve of the methylene index is shown in Figure 5. At the initial stage of curing reaction, i.e. 90–120°C, it can be seen that the slope of the growth curve of p-p methylene is obviously larger than that of o-p and o-o. Presumably, the main reaction is the dehydration polycondensation reaction of p-hydroxymethyl with para active hydrogen of phenol ring, which can be observed from the decrease of hydroxyl (Figure 6) and hydroxymethyl (Figure 7). It is worth noting that the slope of the hydroxymethyl index is positive when the curing temperature is less than 100°C (Figure 8). The hydroxymethyl index increases slightly with the increase of curing temperature, which may be caused by the condensation reaction of a small amount of free formaldehyde in the liquid resin. According to Figure 8, the ether index doesn’t decrease in the range of 90–120°C, which indicates that free formaldehyde is not produced by the cleavage of the ether bond. According to the slope of the curve, in this stage, the importance of the main reaction from high to low is as follows: ①dehydration polycondensation reaction of p-hydroxymethyl with para active hydrogen of phenol ring to form p-p methylene; ②dehydration polycondensation reaction of o-hydroxymethyl with ortho active hydrogen of phenol ring to form o-o methylene; ③the dehydration condensation between hydroxymethyl and hydroxymethyl to form a small amount of ether bond. Figure 9 shows the relationship between the amount of water released and the temperature during the curing process, which supports the release of a large amount of water from 90∼120°C. In addition, the curve slope of o-p methylene tends to be zero from 90 ∼ 120°C, which indicates that it is difficult to form o-p methylene at this stage. Variable temperature FTIR spectra of methylene peak. The methylene index varying with temperature. Variable temperature FTIR spectra of hydroxyl peak. Variable temperature FTIR spectra of hydroxymethyl and ether peak. The hydroxymethyl index varying with temperature. TG-MS spectra of releasing H2O during the curing process of phenolic resin.

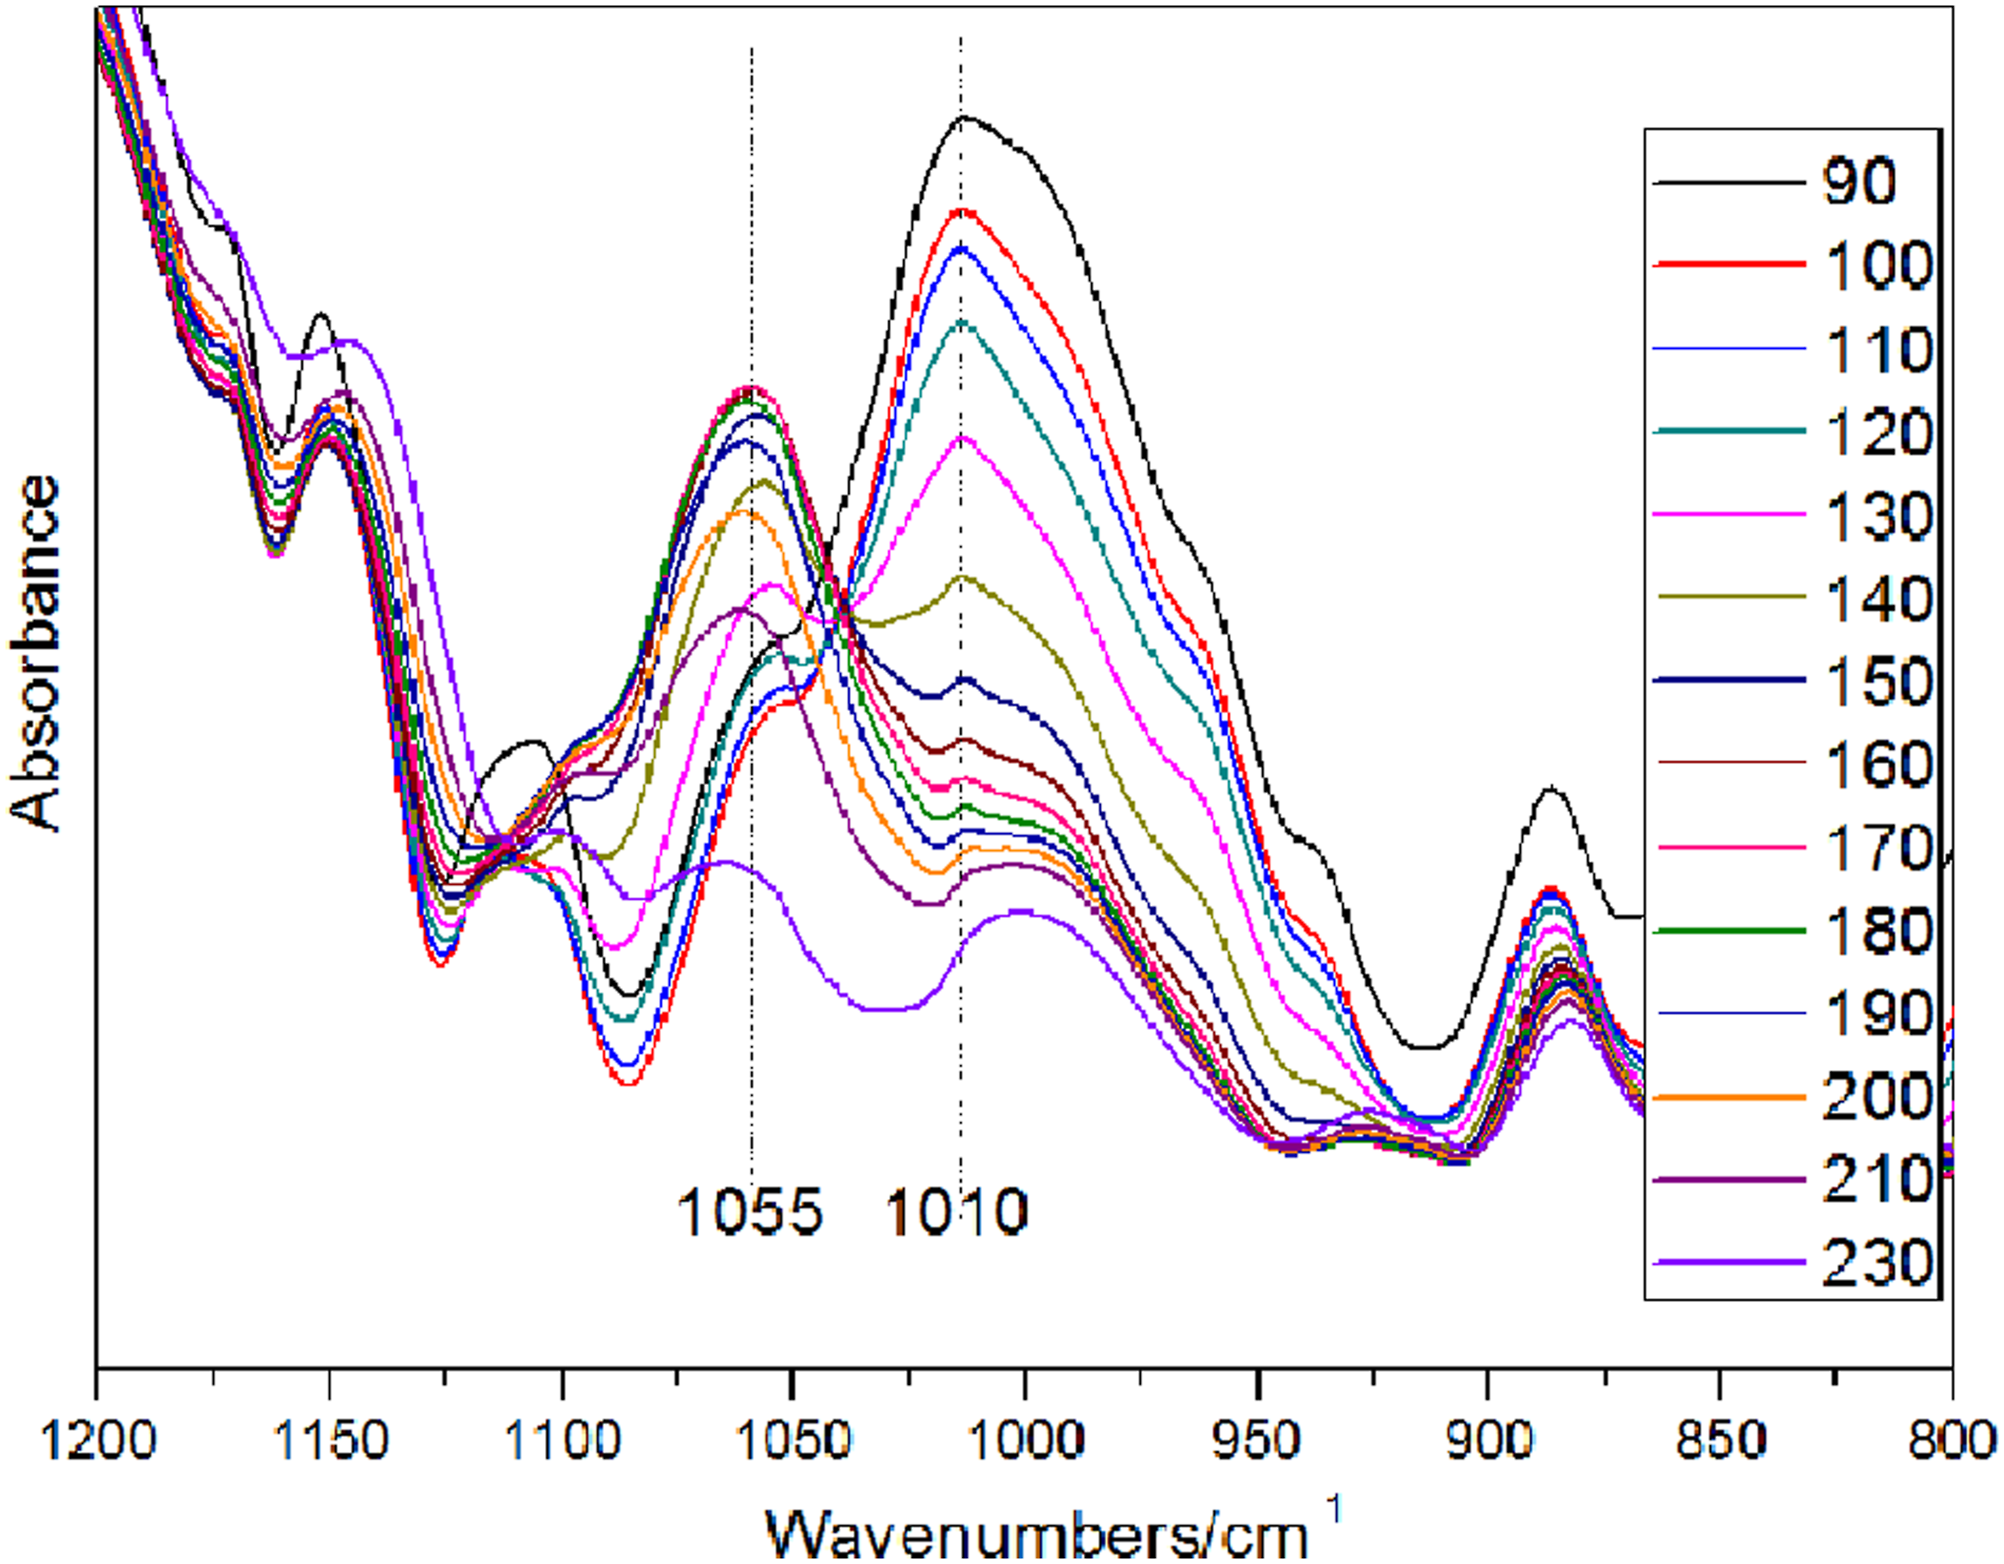


In the next stage of 120–160°C, the curve slope of o-p methylene increases with the rise of curing temperature (Figure 5), which indicates that the formation rate of o-p methylene begins to increase. The p-p methylene has the highest formation rate at this stage, followed by o-p methylene and o-o methylene. At the same time, the curve slope of the ether index increases, which infers that the formation rate of the ether bond enlarges (Figure 10). In addition, according to the release gas analysis of resin during the curing process by TG-MS (Figure 11), the initial temperature for the rapid release of formaldehyde is above 135°C, which also means that a large number of ether bonds begin to break. In conclusion, according to the slope of methylene index curve, it can be speculated that the main reactions at this stage are ①the condensation reaction of p-hydroxymethyl with para active hydrogen of phenol ring to form p-p methylene and water, ②the condensation reaction of o-hydroxymethyl with ortho active hydrogen of phenol ring to form o-o methylene and water, ③the condensation reaction of o-hydroxymethyl with para active hydrogen of phenol ring to form o-p methylene and water, ④the dehydration condensation reaction between hydroxymethyl and hydroxymethyl to form ether bond, ⑤the breaking reaction of ether bond to form formaldehyde. This is the intense curing reaction stage of phenolic resin. The ether index varying with temperature. TG-MS spectra of releasing phenol and formaldehyde during the curing process of phenolic resin.

With the rise of curing temperature, the methylene index reached the highest value in the range of 160–190°C. It can be observed that the formation rate of o-p methylene and o-o methylene gradually exceeds that of p-p methylene according to the curve slope in Figure 5. The ether index reaches the highest value and begins to show a downward trend (Figure 10). The slope of the curve becomes smaller and the formation rate of the ether bond begins to be lower than the decomposition rate. It is speculated that the resin presents the post-curing stage in this stage, that is, the molecular structure with higher cross-linking density is formed. The main curing reaction has been completed. The main reaction at this stage is the breaking of the ether bond. It can be seen from TG-MS analysis (Figure 11) that the formaldehyde emission increases sharply at this stage, which verifies that a large number of ether bonds break to form formaldehyde at this stage.
The slope of the p-p methylene index of phenolic resin is negative when the curing temperature is above 190°C, which indicates that there are other reactions consuming p-p methylene. Presumably, this is most likely the dehydration reaction between phenolic hydroxyl and p-p methylene, which consumes an amount of p-p methylene. It may also be the dehydration reaction between the p-p methylene and a small amount of formaldehyde to form a propyl bridged structure. In addition, the ether index tends to zero above 230°C (Figure 10), which indicated the ether bond breaks completely.
Figure 10 shows the TG-MS spectra of releasing H2O during the curing process of phenolic resin. It can be seen that water is always releasing during the whole curing process of phenolic resin. There is a fluctuation area in the amount of water generated between 120°C and 180°C. This indicates that the phenolic resin is in the stage of violent curing reaction, which is confirmed by the previous mechanism analysis. Figure 11 shows the TG-MS spectra of releasing phenol 29 and formaldehyde during the curing process of phenolic resin. It can be observed that free phenol starts to release from 70°C and reaches the peak value near 160°C. Therefore, it can be inferred that part of free phenol will inevitably be lost during the curing process of phenolic resin, resulting in the increase of the actual mole ratio of formaldehyde to phenol.
Figure 12 shows the variable temperature FTIR spectra of the carbonyl group. It is worth noting that the carbonyl group starts to form from 160°C. Its content increases with the rise of temperature. Combined with the trend of ether index varying with temperature (Figure 8), it can be seen that the ether index decreases rapidly after reaching the peak value from 160°C, accompanied by the formation of the carbonyl group and the release of formaldehyde. The released formaldehyde by ether bond-breaking may promote the formation of carbonyl structure. It is generally believed that excessive carbonyl groups will reduce the heat resistance of the resin. Therefore, the curing process of the phenolic resin should avoid the formation of excessive carbonyl groups as far as possible. Variable temperature FTIR spectra of the carbonyl group.
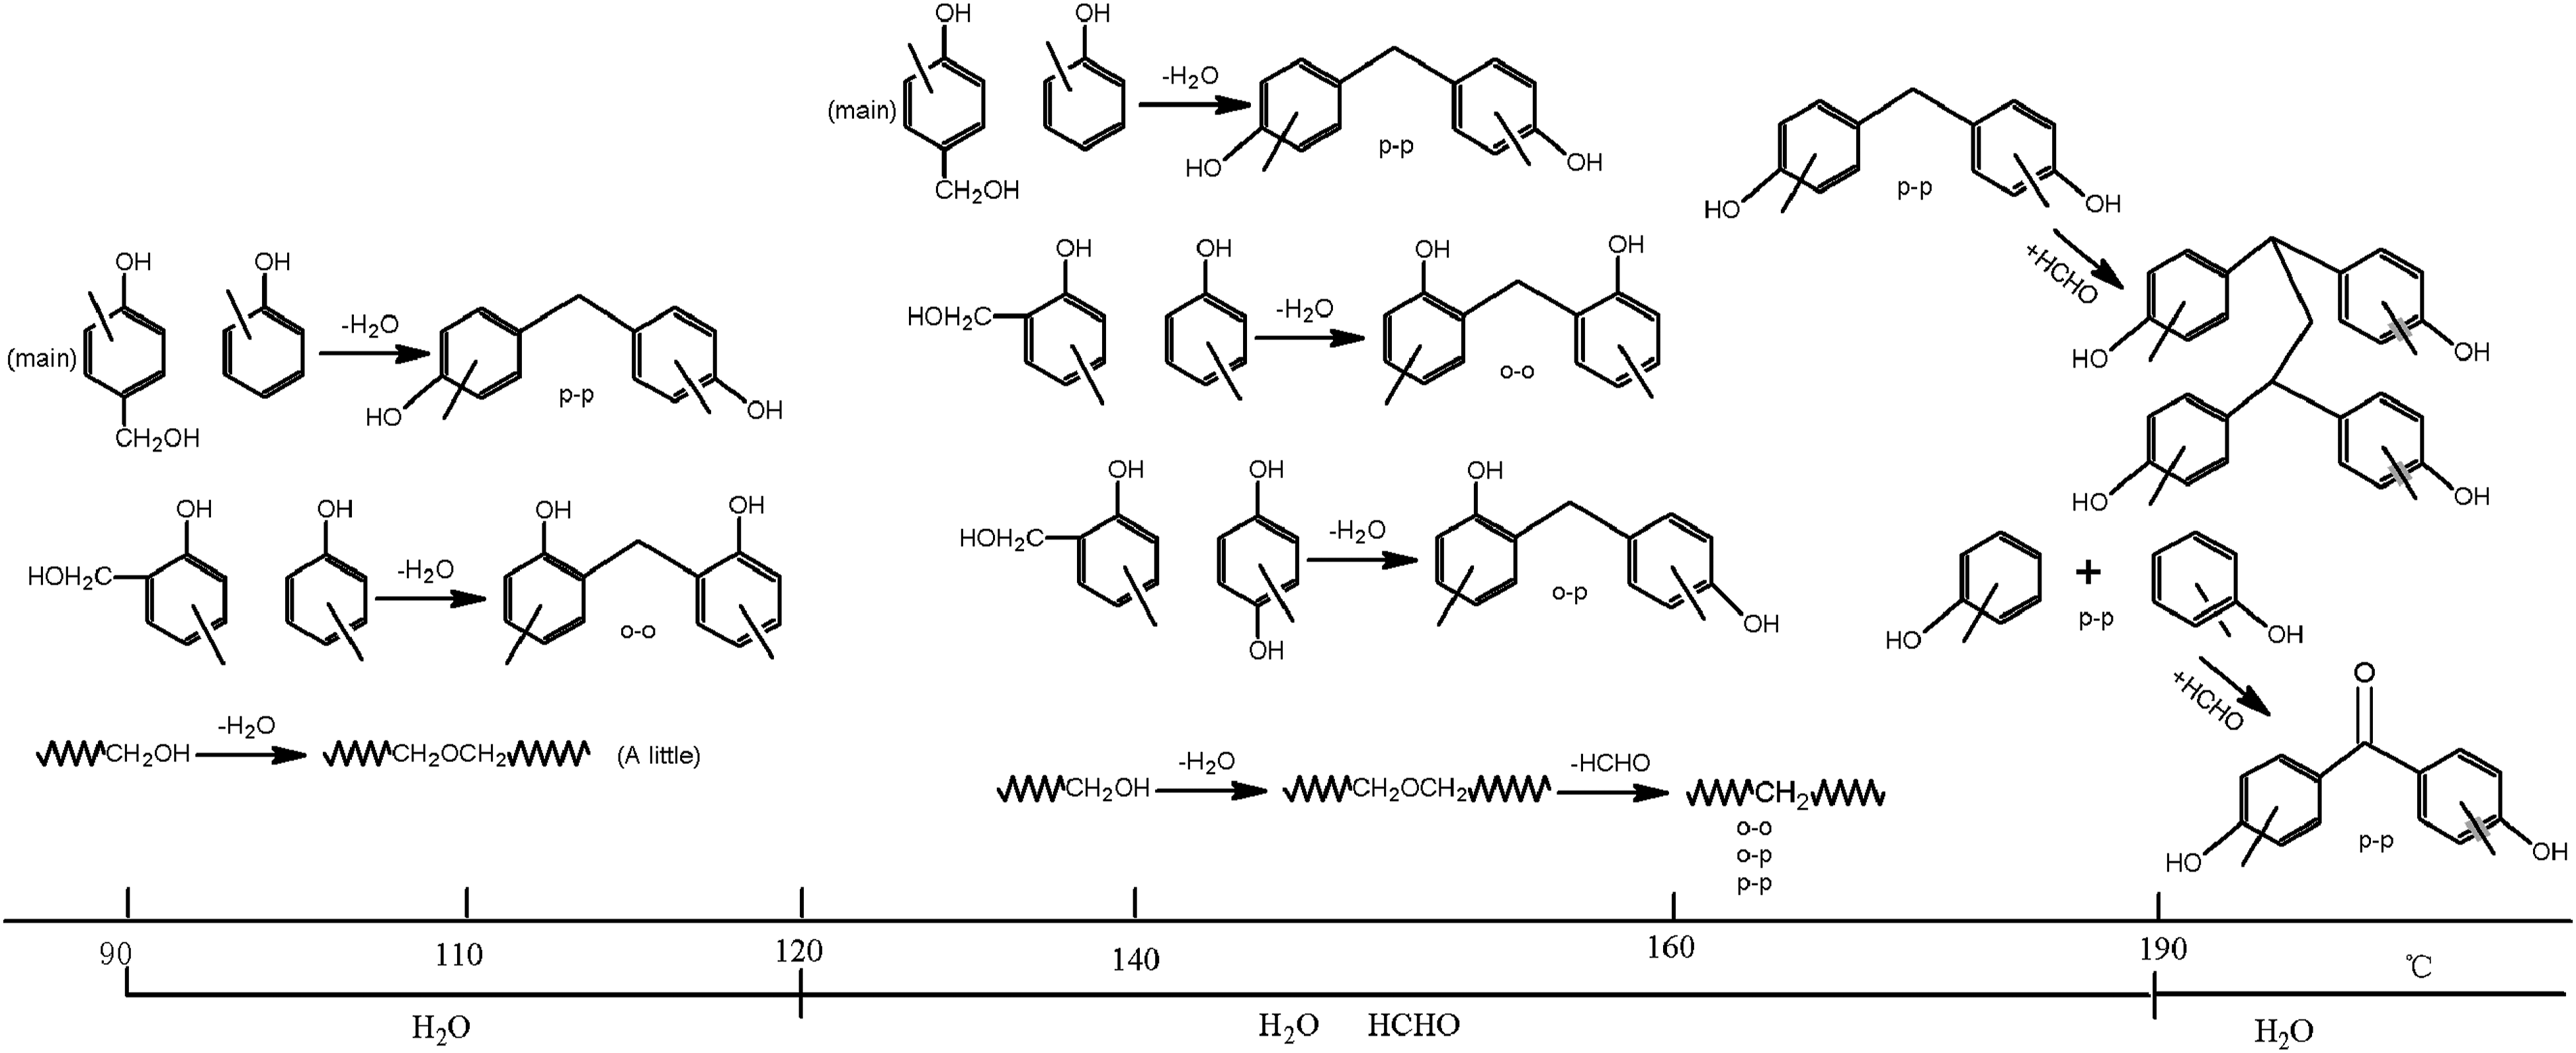
Figure 13 shows the DSC curve of phenolic resin. It can be seen that the curing temperature range of the resin is about 133–220°C. The peak temperature is at 178°C. These are consistent with the temperature range previously analyzed. In conclusion, the curing mechanism evolution of phenolic resin from 90°C to 230°C is shown in Figure 14, which provides technical support for the curing process design of phenolic resin-based composites. DSC curve of phenolic resin. Structure evolution of phenolic resin with curing temperature.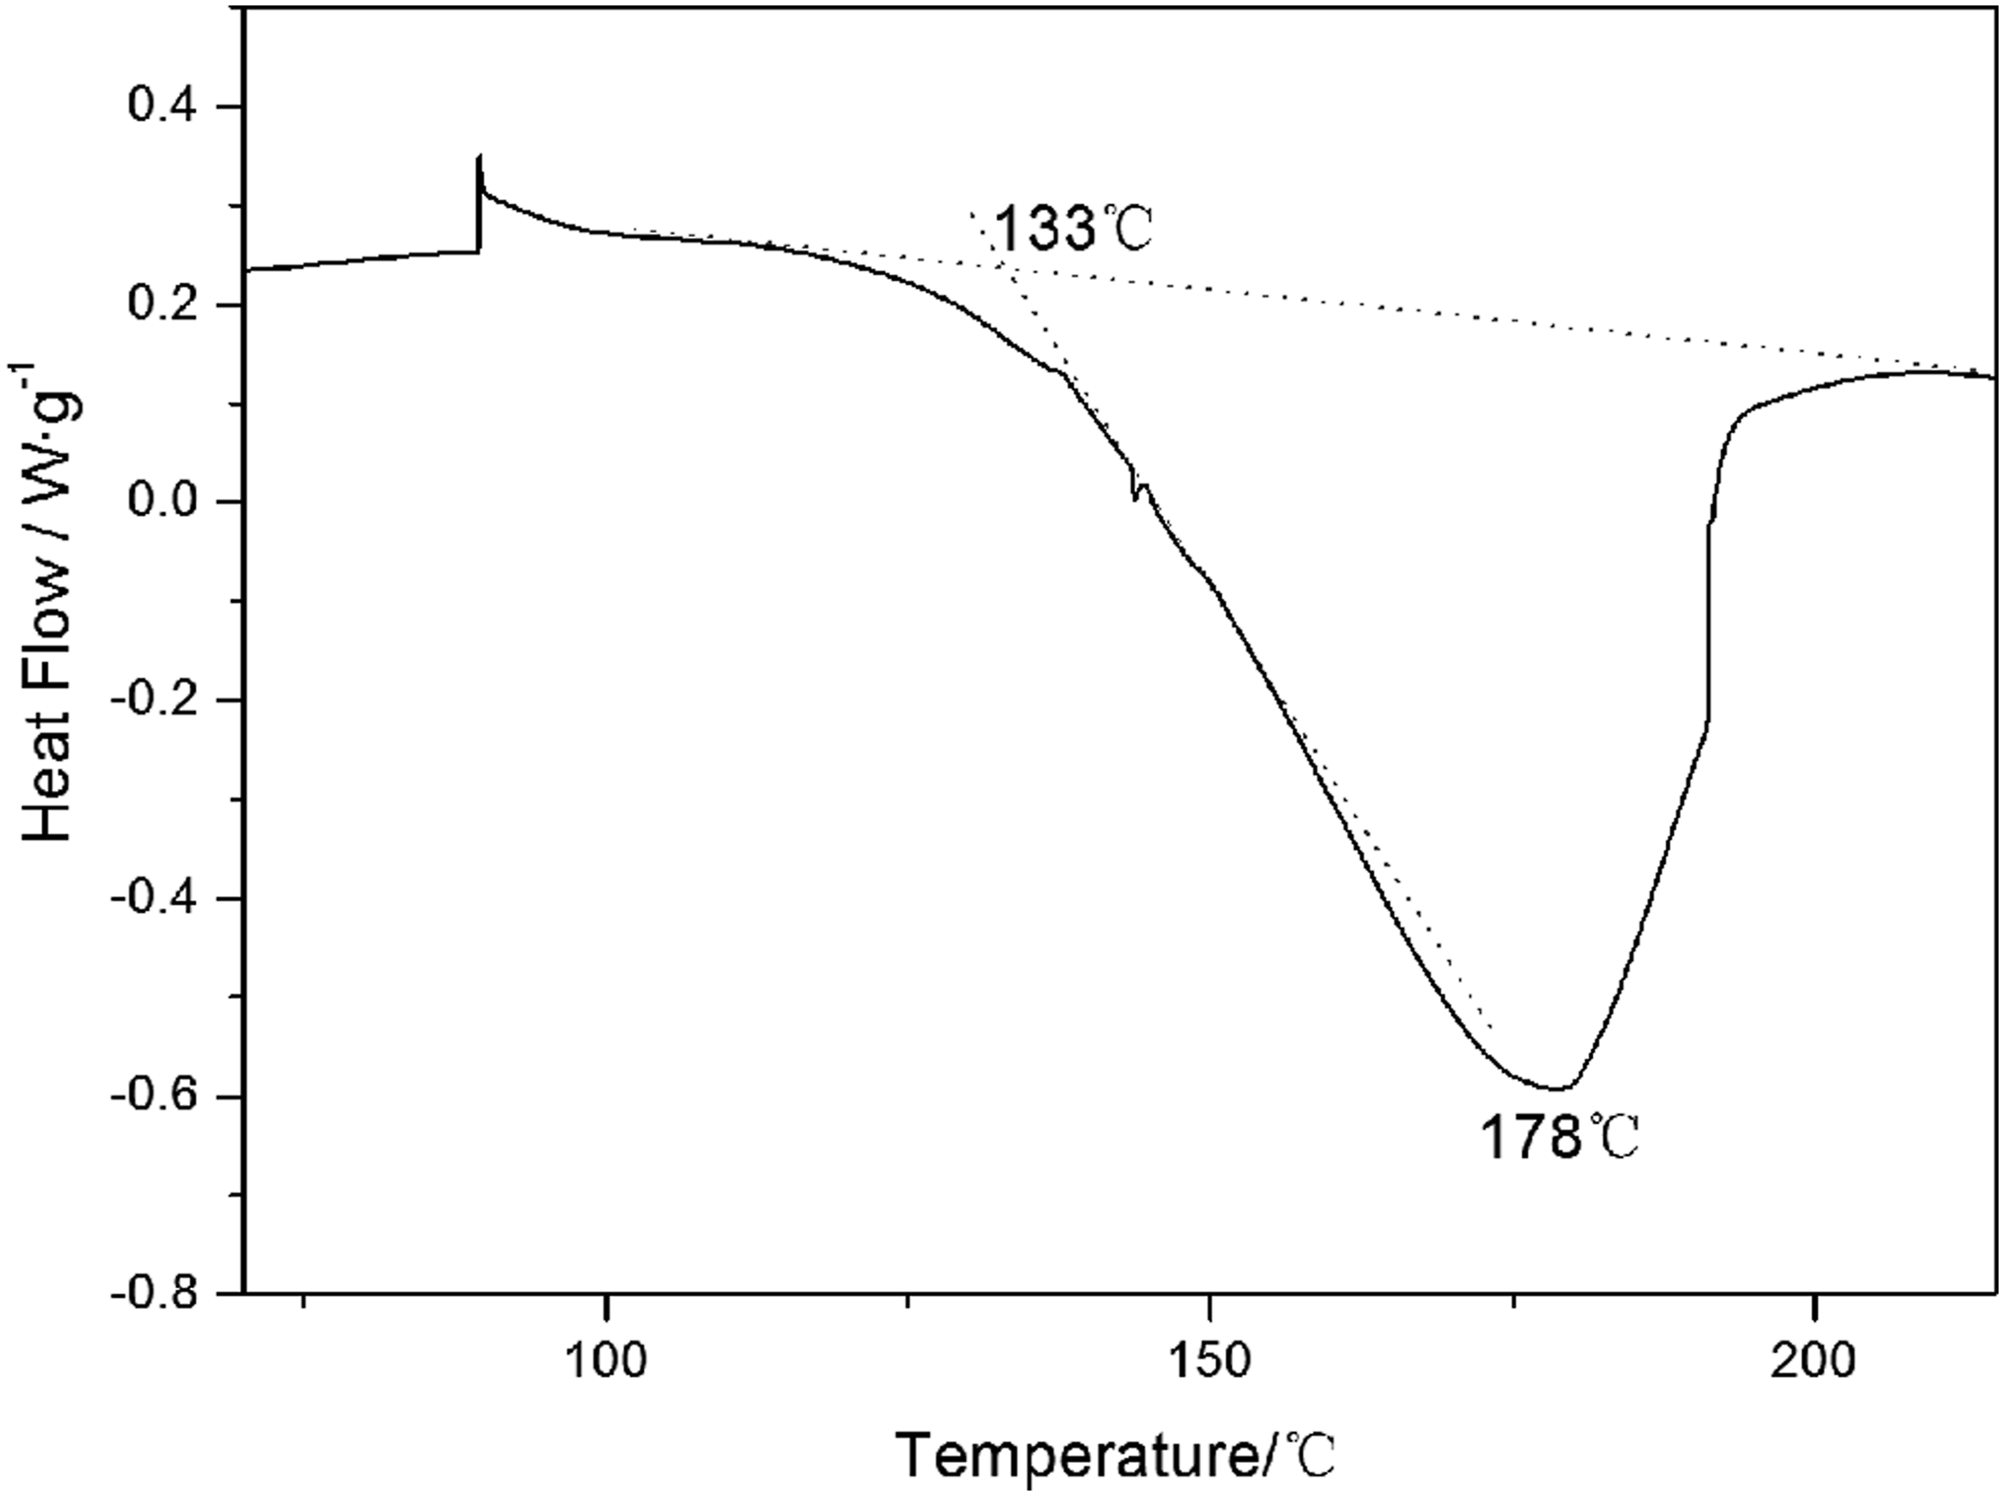
Conclusions
The quantitative analysis of hydroxymethyl, methylene, and ether bonds of phenolic resin was investigated. Combined with the analysis of the gas products released during the curing process, the main curing reactions of phenolic resin from 90°C to 230°C were described. It can be divided into four stages: (1) from 90°C to 120°C, the main reactions are the condensation reaction between para-hydroxymethyl and para-active hydrogen of phenol ring to form p-p methylene and water, followed by the condensation reaction between ortho-hydroxymethyl and ortho-active hydrogen of phenol ring to form o-o methylene and water, the dehydration condensation between hydroxymethyl and hydroxymethyl to form a small amount of ether bond. It is difficult to form o-p methylene. (2) From 120°C to 160°C, the main reactions are the condensation reaction of para-hydroxymethyl with para-active hydrogen of phenol ring to form p-p methylene and water, followed by the condensation reaction of ortho-hydroxymethyl with ortho-active hydrogen of phenol ring to form o-o methylene and water, and the condensation reaction of ortho-hydroxymethyl hydrogen with para-active hydrogen of phenol ring to produce o-p methylene and water. (3) From 160°C to 190°C, the main reactions are the breaking of the ether bond to form formaldehyde and the formation of the carbonyl group. (4) Above 190°C, the main reactions are the dehydration reaction between phenolic hydroxyl and phenolic hydroxyl, and condensation reaction between methylene and formaldehyde to form a propyl bridged structure. The ether bond is almost completely broken above 230°C. In this paper, the curing mechanism evolution of phenolic resin was investigated based on variable temperature FT-IR and TG-MS. In general, this work serves as a novel approach to investigate the curing mechanism of phenolic resin. The achievement may be useful for the rational design of the curing process of phenolic composite.
Footnotes
Acknowledgements
The authors would like to thank Na Huang for helpful discussions.
Author contributions
Investigation: Honglin Hu.
Data curation: Liang Liu.
Methodology: Liqin Jiang.
Validation: Wei Wang.
Roles/Writing - reviesed: Honglin Hu, Ying Zhang.
Supervising: Yunhua Yang, Jinming Wang.
Declaration of conflicting interests
The author(s) declared no potential conflicts of interest with respect to the research, authorship, and/or publication of this article.
Funding
The author(s) disclosed receipt of the following financial support for the research, authorship, and/or publication of this article: This work was supported by the grant No. 2019-JCJQ-ZD-278-00, National Natural Science Foundation of China (U2037206).
Data availability statement
The data used to support the findings of this study are available from the corresponding author upon request.