
Abstract
In this study, blends of polypropylene
Introduction
Wood (WF) as lignocellulosic reinforcing material is an attractive filler for thermoplastic matrices due to its low cost, high specific strength, wide availability, and renewability. In recent years, lignocellulosic filler reinforced polymer composites has been widely utilized for decks, guardrails, and automotive parts.1–3 Polypropylene (PP) is one of the cheapest plastic materials and is used extensively in various applications such as electronic components, automobile parts, textiles, food packaging, and garbage bags. 4 Because of its good mechanical, physical, chemical resistance, and gas barrier properties, PP is mainly preferred in many applications such as plastic films, plastic bags, etc.5,6 However, the PP products are hydrophobic and non-biodegradable in nature. This feature makes it difficult to dispose of the packaging films after short-term use. Packaging films pollute the environment by accumulating inland sites and the oceans. 7 Recycling these products is not a viable option because it results in a low-quality product. Plastic waste management is a suitable option for resolving the biodegradability of packaging films. The degradability of PP can be improved by mixing it with biodegradable polymers such as polylactic acid, starch, cellulose, polyhydroxybutyrate, and polycaprolactone. 8 In the biodegradation process, the products are broken down into small by-products and consumed by microorganisms as an energy source.
Nowadays, commonly used biopolymers generally are starch-based polymers, including polylactic acid (PLA) and polyhydroxybutyrate (PHB), and they are biocompatible and biodegradable material. 9 Both PLA and PHB have some limitations in packaging applications, including their low shelf-life, high cost, fragile nature, etc. Various studies carried out on blends of PP with biopolymers have determined that with blending of PP with biopolymers, the degradation time of the obtained blends in nature decreased. Various compatibilizers were found to improve the miscibility between PP and biopolymers. 7 Polyhydroxybutyrate (PHB), like other biopolymers, has been produced by fermentation in the presence of various bacteria as an intracellular reserve material. 10 At least 75 different bacterial species are known to accumulate PHB as intracellular granules. Moreover, PHB is most commonly produced from microorganisms belonging to the Alcaligenes, Azobacter, Bacillus, and Pseudomonas genera. 11 Under limited nitrogen and in the presence of an abundant carbon source, some bacteria can produce up to 60–80% of their weight in PHB. 12 The incorporation of bio-based reinforcing materials in biopolymers can improve the mechanical properties of the obtained composites.13,14 Tensile, bending, impact, and hardness tests are the basic, most common, and widely used characterization techniques for fiber-reinforced composites. 15 In a study, Ploypetchara et al. 16 studied their characterization and the blends of PP and PLA. It was found that scanning electron microscopy (SEM) showed a two phases system between PP and PLA, and the blending of PP with PLA was typical immiscible. The mechanical properties of neat PP increased with the adding PLA. However, elongation at break was drastically decreased due to the adding PLA. In another study, Pachekoski et al. 17 studied the thermal, mechanical, and morphological properties of polyhydroxybutyrate and polypropylene blends. The obtained results showed that the PHB/PP blends had high mechanical properties, and the blending of PHB with PP was immiscible. It was found that the crystallinity and mechanical properties of the blends decreased while the loading rate of PHB increased. In a similar study, Oliveira et al. 18 studied morphology and mechanical properties of polypropylene and polyhydroxybutyrate blends and their nanocomposites. The obtained results showed that the blending between PP and PHB was immiscible. The compatibilizer used (PP-g-MA) improved the morphological structure of the blends; however, the addition of the nanoparticle to PP/PHB blends generally decreased the mechanical properties due to the heterogeneous dispersion of nanoparticles. Similar results were also found in the blends of PP with PHB or PLA.19–23
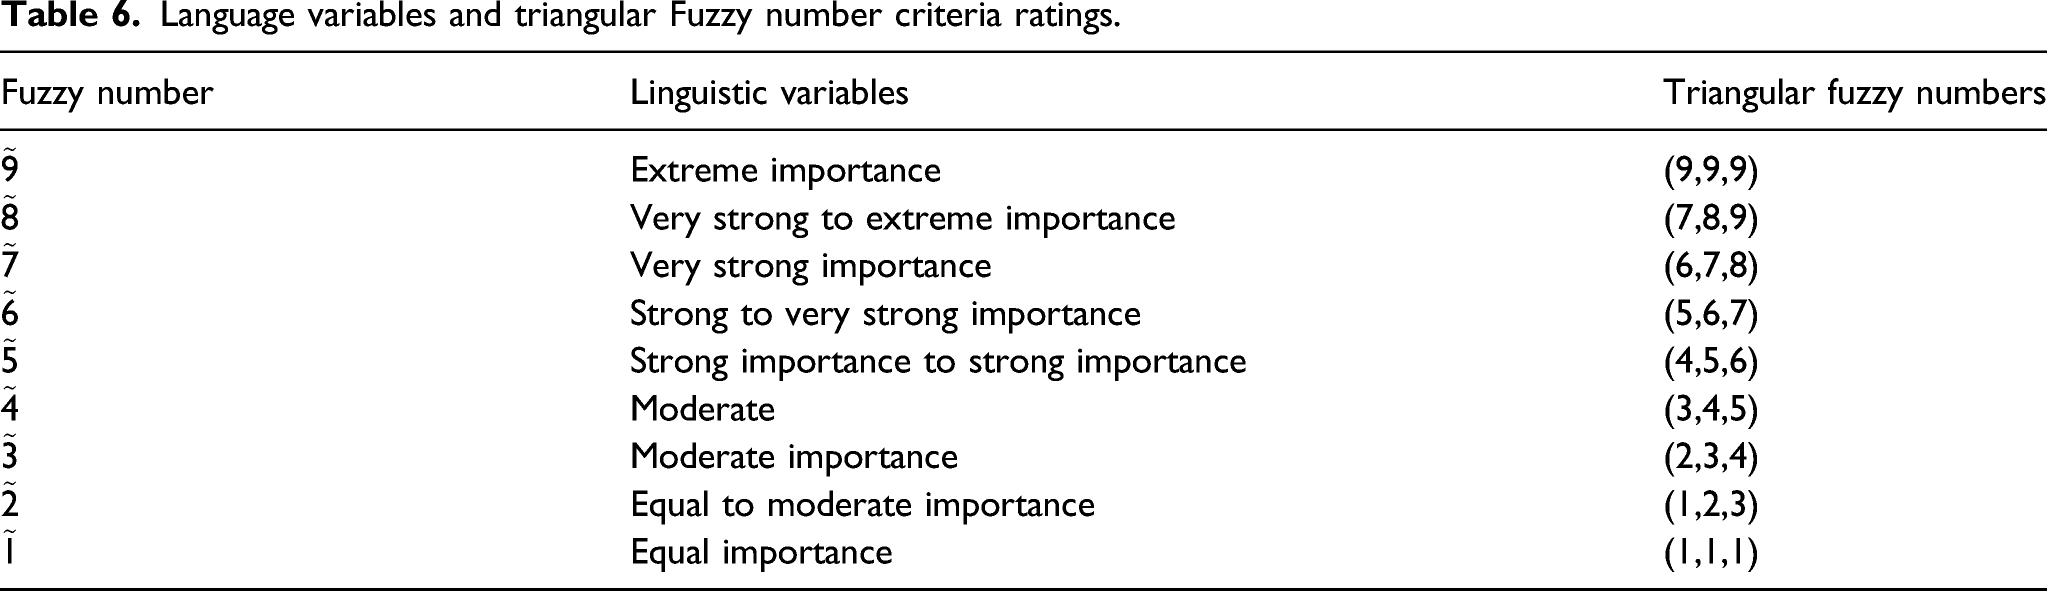
The results obtained after an experimental study were generally evaluated with different methods to find the optimum properties, and many researchers have taken advantage of new techniques such as multi-criteria decision methods. 24 Multi-criteria decision aiding (MCDA) methods can provide an appropriate way to find the best decision,25,26 Because words are less precise than numbers, the concept of linguistic variable serves the purpose of providing a measure of an approximate characterization of a phenomenon that is too complex or misidentified to be appropriate to their explanation by traditional quantitative terms. 27 In other words, conquering the language world with the army of the mathematical realm could be seen as a difficult but very important task. To accomplish this task, the Fuzzy sets theory was introduced by Zadeh.28,29 Also, gray relation analysis (GRA) is a way to convert all mechanical results (tensile, bending, and impact) into a single response data formation to solve the MCDA problems. 30 In the GRA method, the larger-better type quality characteristic provides better performance in the mechanical properties of biodegradable composites. Therefore, “bigger is better” was chosen for the optimization of the parameters.31–33 GRA method was used to determine the biopolymer composites with the best properties. Abifarin et al. 34 used the GRA to optimize fabrication parameters for the mechanical properties of 3D printed chitosan/PLA scaffold. Kasemsiri et al. 32 studied the optimization of biodegradable foam composites using the Taguchi method and Grey relational analysis. Sumesh and Kanthavel 33 studied optimizing various parameters influencing mechanical properties of banana/coir natural fiber composites using Grey relational analysis and artificial neural network. Also, Bellman and Zadeh 35 introduced the Fuzzy multi-response optimization route criteria decision method methodology by proposing to solve MCDA problems. Triangular Fuzzy numbers (TFNs) are used in this paper to assess the preferences of DMs. Triangular Fuzzy numbers are preferred for their ease of calculation and their relatively simple structure. Analytic Hierarchy Process (AHP) developed by Saaty 36 is a method that constructs both qualitative and quantitative data in a multi-criteria decision-making problem hierarchically. A Fuzzy extension of the AHP method suggested by Chang 37 develops Saaty’s AHP by integrating with Fuzzy set theory to make a decision in an uncertain environment. A Fuzzy extension of AHP is proposed in this study because of little computation time and is much simpler than other Fuzzy AHP procedures. A Fuzzy extension of AHP is employed to compute the weights of criteria. There are many Fuzzy AHP methods proposed by various authors.38–41 In the literature, several polymers and GRA methods were used together. These studies are generally based on optimizing the production methods or determining the filler quantities for mechanical properties of the composite.42–49 Multi-criteria decision-making (MCDM) methods to optimize the mixing amount with biopolymers (PLA, PHB) and wood filler into the petroleum-based polymers (PP) have not been encountered in the literature. The aim of this study was to conduct parameter optimization with Fuzzy and Grey relational analysis of physical, mechanical, thermal, and morphological properties of wood flour reinforced polypropylene/biopolymer blend composites.
Material and Methods
Materials
Polypropylene, PLA, and polyhydroxybutyrate (PHB) were obtained from Petkim (Izmit, Turkey) and GoodFellow Inc. (Huntingdon, England), respectively. Wood flour (Pinus sylvestrist L.) and polyethylene grafted maleic anhydride (MAPE) were used as a reinforcing filler and compatibilizer, respectively.
Preparation of samples
Mixture formulations.

Methods
Physical and mechanical properties
The physical properties of the composites were determined by water absorption (ASTM D 1037) and thickness swelling (EN 317) values, density analysis (ASTM D792-98), and color measurements (ISO 7724). After the samples were climatized at 20°C and 65% relative humidity for 24 h, the measurements were taken accordingly. Tensile and flexural tests were performed according to ASTM D 790-03 and D 638-03 standards, using a Zwick/Roell Z010 5 kN tester. The test speed was set at 3 mm/min for flexural and tensile analysis. The notched impact strength was tested according to ASTM D 256-06. The notches were formed using the Polytest Ray-Ran (UK) NotchVis device. Impact strength analyses were performed using the Zwick Roell HIT5.5P instrument. Mechanical properties were determined by performing seven repeat measurements for each sample.
Thermal Properties
The thermal properties of 5-mg samples were determined by thermogravimetric analysis (TGA) with a Perkin Elmer test device. Measurements were performed from room temperature up to 600°C at incremental increases of 10°C/min. Measurements were taken under nitrogen flow at 20 mL/min to prevent oxidation. The temperatures at which the composites lost 10, 50, and 85% of their mass (T10%, T50%, and T85%) and the temperature at which they decomposed at the highest rate (DTGmax) were determined. In addition, the melting temperature (Tm) and degradation temperature (Td) of the composites were determined by derivative thermal analysis (DTA).
Morphological Characterization
The morphological characterization of the samples was examined using SEM. Measurements were made using the Tescan MAIA3 XMU-SEM device under 5 kV increasing voltage. In order to increase the surface conductivity, the samples were coated with gold using a Denton spray coater.
Fourier transform infrared spectroscopy and X-ray diffraction
Structural analyses were determined by Fourier transform infrared spectroscopy (FTIR) and X-ray diffraction (XRD). The FTIR analysis was performed using a Shimadzu IRAffinity-1 FTIR (Japan) spectrometer at a resolution of 2 cm−1 in the wavelength range of 700–4000 cm−1. The XRD analysis was carried out using a Rigaku Smartlab device with 40 kV voltage and 30 mA electric current.
Fuzzy and Grey Relation Analysis
Fuzzy and Grey relational analysis methods were used for the selection of the best sample, and the results obtained from the methods were compared with each other.
Fuzzy AHP is used to determine the importance weights of criteria. For Fuzzy pairwise comparisons of the criteria and sub-criteria, Chang’s
37
extent analysis is used. The stages of the extent analysis are summarized as below.50–52 First of all, it is necessary to aggregate group decisions. Geometric mean operations are commonly used within the application of the AHP for aggregating group decisions
53

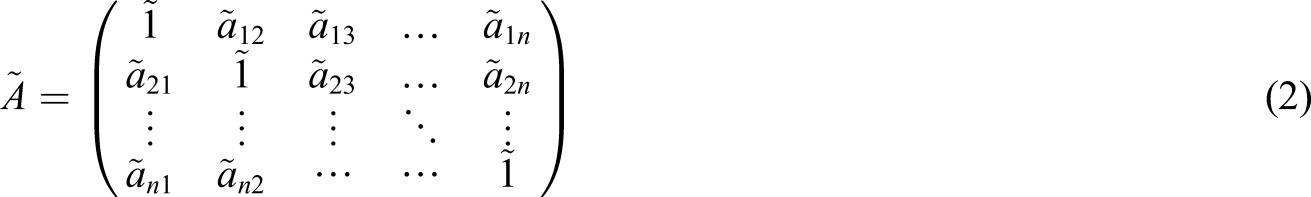
Let 
All elements of 
In order to obtain 
Then, in order to obtain 

The center of area method
54
was utilized to defuzzify the triangular Fuzzy numbers into corresponding best nonFuzzy performance (BNP) values.
Finally, criteria weights are obtained by normalizing the BNP values.
The Grey relational analysis is a common method to optimize more than one performance feature. The steps used in this method include 55 :
Experimental design and implementation: The n-dimensional series consisting of the obtained data (x
0
) is expressed in equation (10).
After normalizing the data, the normalized data is weighted. When normalizing the data, depending on the problem, the appropriate equation is used: “Larger is Better”, “Smaller is Better”, or “Nominal is the Best”. In the study, Larger is Better (Equation (11)) was used because high mechanical properties were desirable.
Here, i = 1,…, m; k = 1,…,n., m is the number of experimental data, and n is the number of responses; x i (k) denotes the original sequence, x i * (k) the sequence after the data preprocessing, max x i (k) the largest value of x i (k), min x i (k) the smallest value of x i (k), and x the desired value.
A normalized decision matrix is then created (Equation (12)).
The ranking scores of the factors or options are calculated using equation (13).
Here, ξ in the range of [0,1] is defined as the discriminant coefficient or the contrast control coefficient; ξ = 0.5 is commonly used in studies in the literature; 
The Grey relational grade is then calculated. If the importance levels of the criteria in the decision matrix are equal, the Grey relational grade (Γ0i) is found using equation (15).
Results and Discussion
Physical properties
Density analysis and Duncan’s test results.
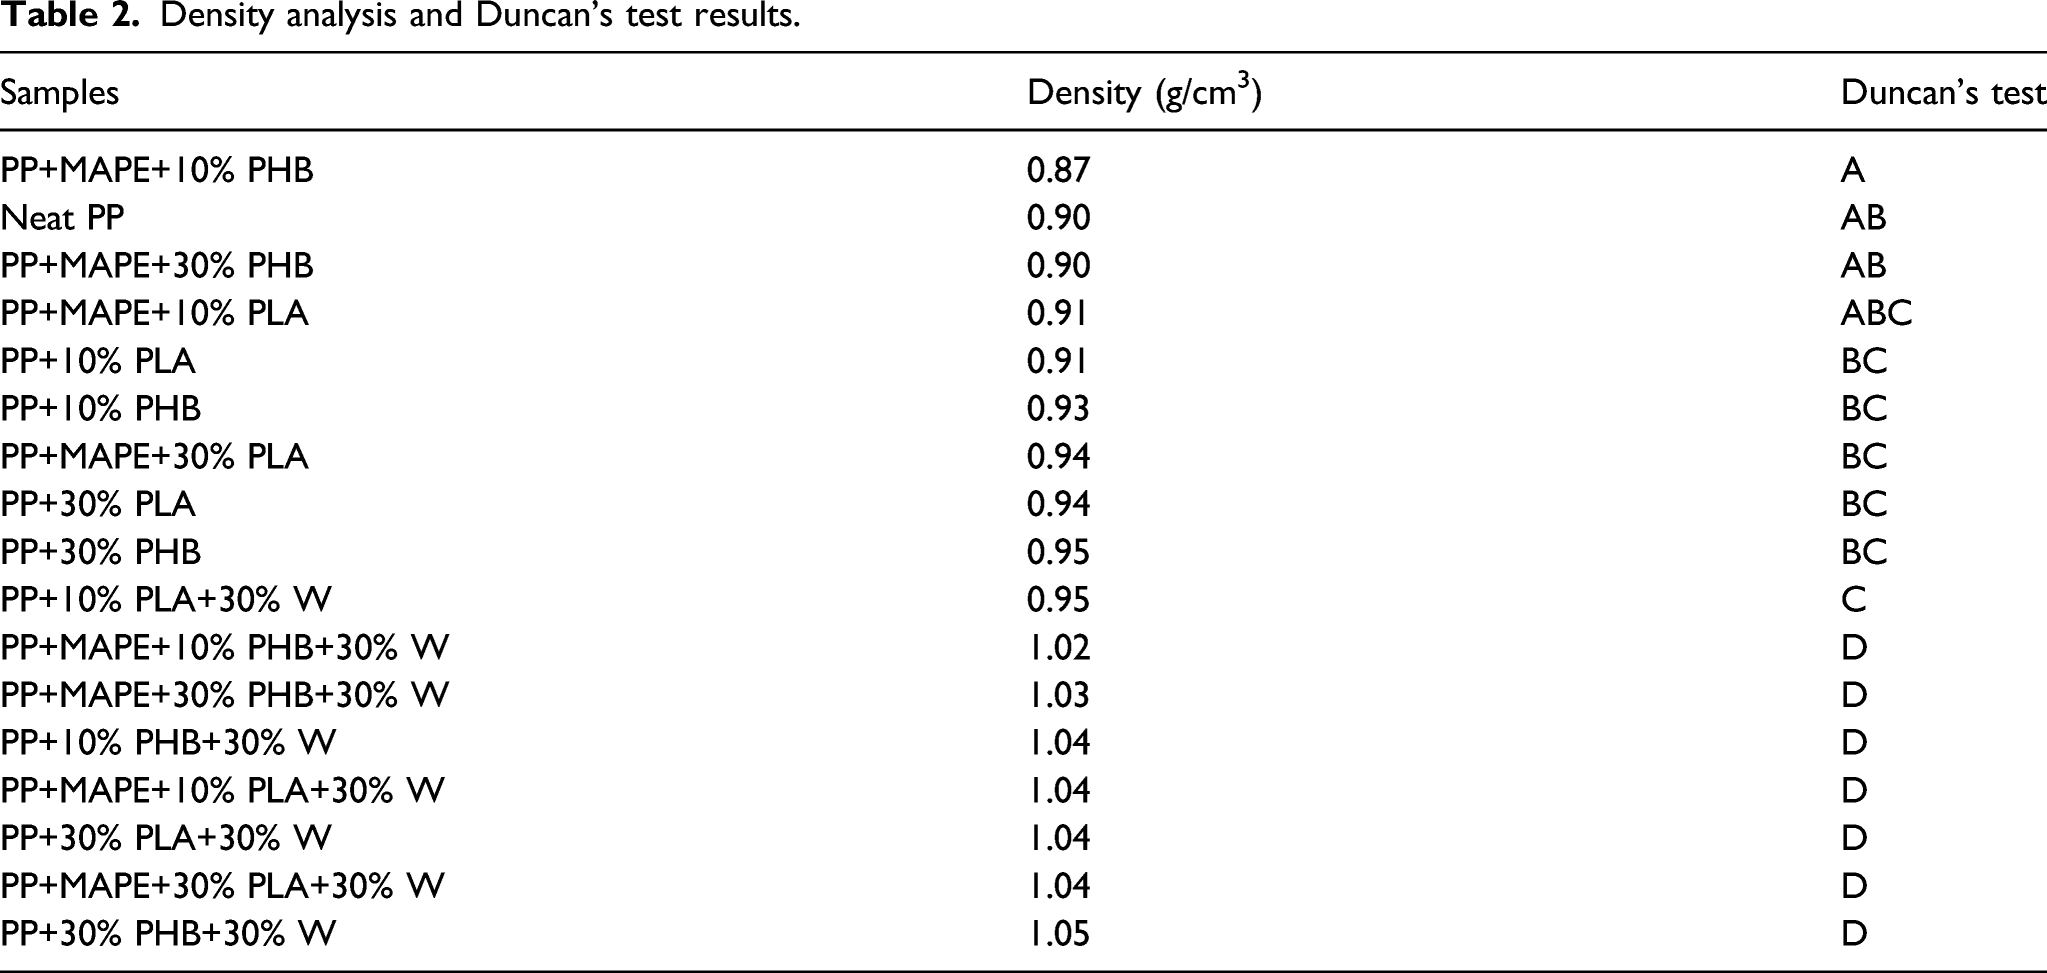
Figure 1 shows the amount of water absorption and thickness swelling of samples at the end of the 20th, 50th, and 250th days. The least thickness swelling was obtained in the neat PP samples. The highest amount of swelling was seen in the PP+30%PLA+30%W samples at the end of the 250th day. The PP swelling amount with 10% PLA was 2, 3, and 4% at the end of the 20th, 50th, and 250th days, respectively. When PLA was increased from 10% to 30%, these values were 5, 6, and 7%. Many studies have reported that the bonding between the matrix and the polymer affects the swelling and water absorption of the composites.58–63 On the other hand, with the 10% PLA addition, water absorption increased by 4, 5, and 6% at the end of the 20th, 50th, and 250th days, respectively. When the amount of PLA was increased from 10% to 30%, this value was seen as 6, 7, and 8%. Adding 10% PHB to the PP caused 2, 4, and 5% increased swelling, respectively. When PHB was increased from 10% to 30%, these values were 5, 6, and 7%, respectively. The additions of PLA and PHB increased the thickness swelling and water absorption rates of the PP. This ratio increased even more with the addition of wood flour. PP composites with additions of PLA, PHB, MAPE, and wood flour: (a) thickness swelling, (b) water absorption.
Color analysis results of mixtures.

Mechanical properties
Averages of mechanical properties and some statistical data of bio polymer composites.
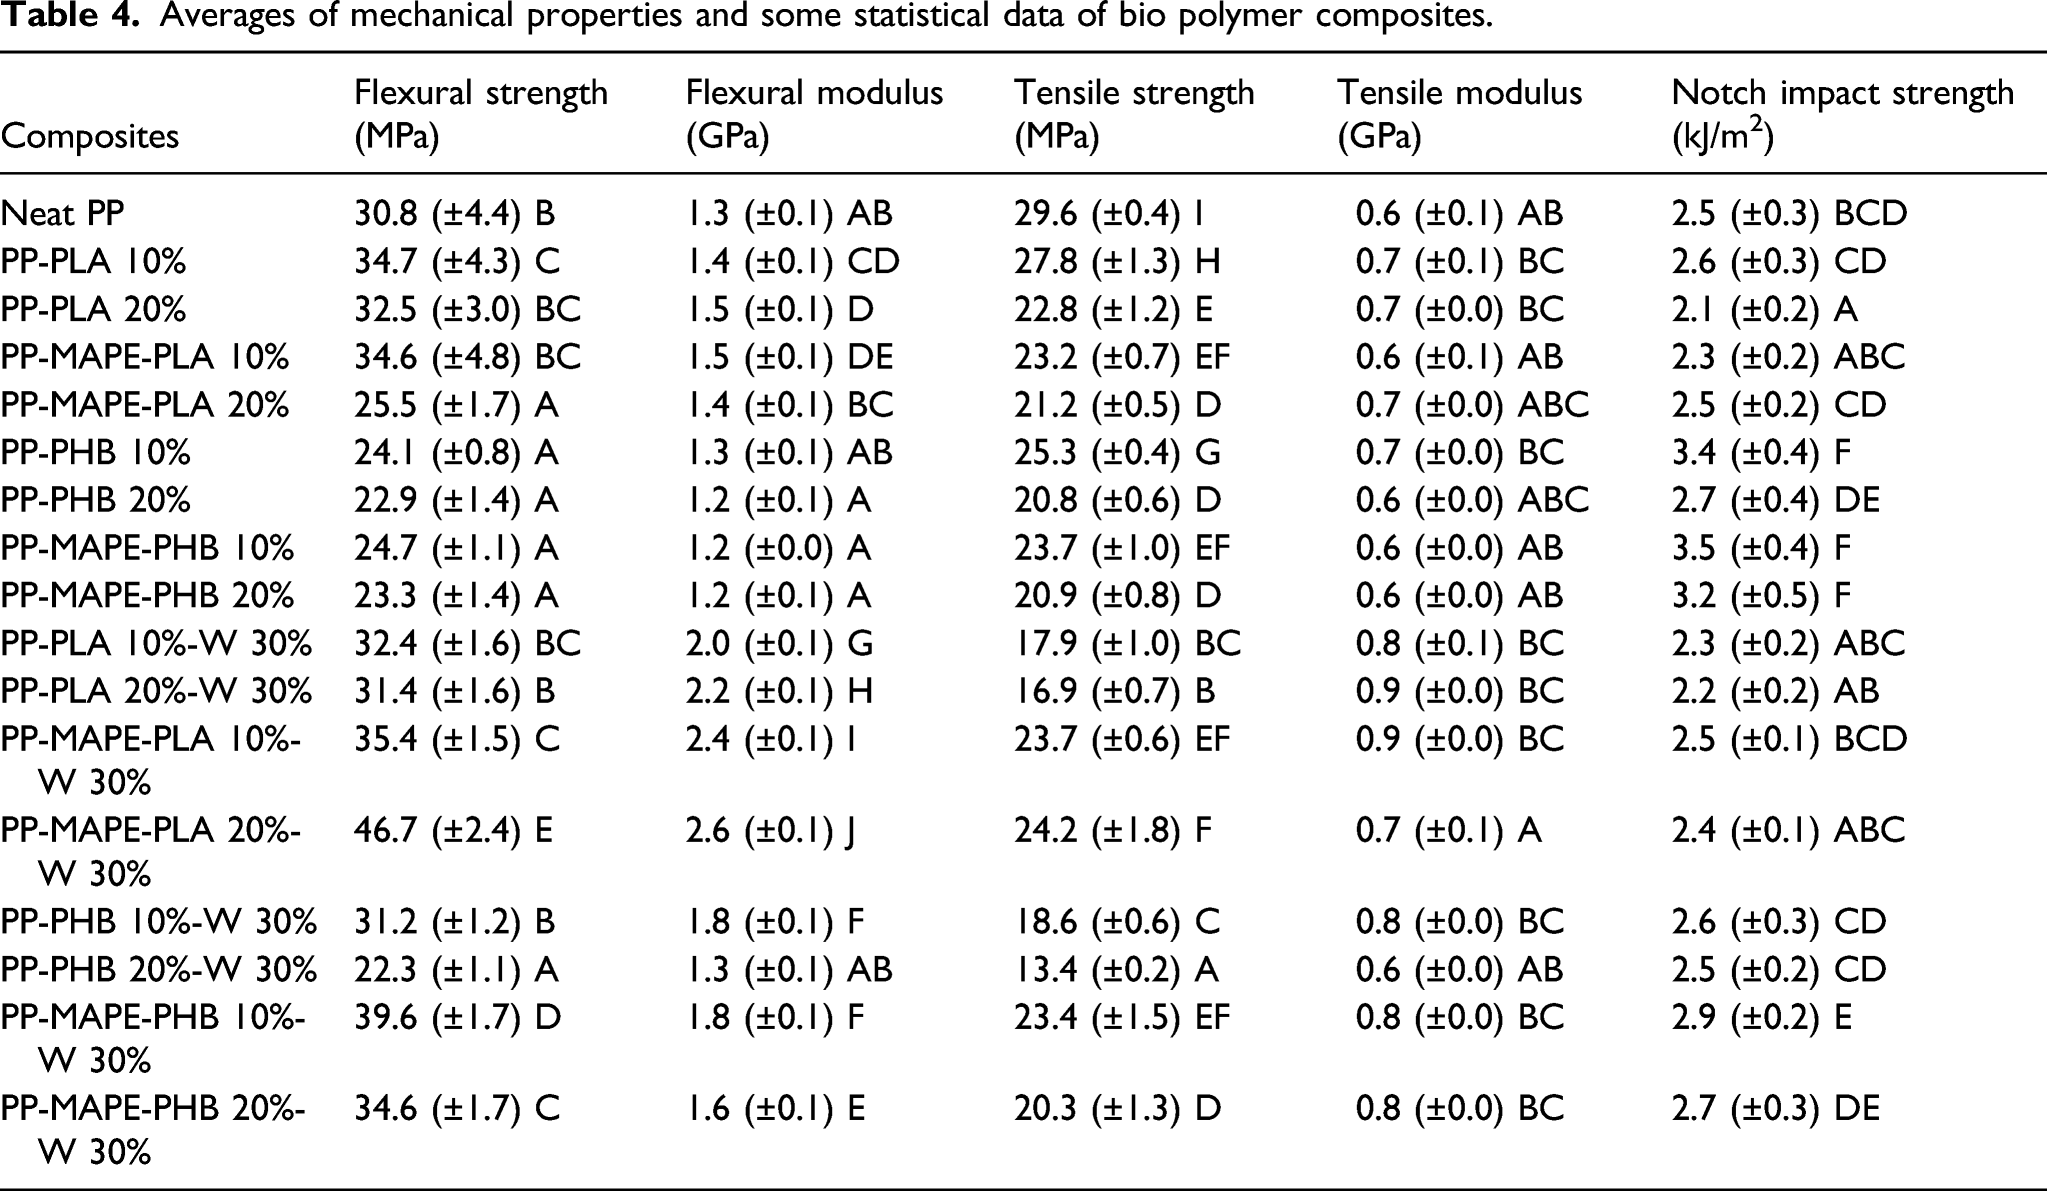
The addition of MAPE and wood flour generally increased the tensile modulus of elasticity of the composites (Figure 2(b)). The cellulose fiber in wood flour affects the mechanical properties positively, whereas lignin affects it negatively.
65
The tensile strength of the PP and PLA composites was better when the addition of wood flour was used with the MAPE compatibilizer (Figure 2(a)). PP samples with added PLA and PHB: (a) tensile strength, (b) tensile modulus of elasticity.
Figure 3(a) shows that the addition of MAPE reduced the flexural modulus values of the PP/PLA and PP/PHB composites. On the other hand, the addition of wood increased the flexural modulus in contrast to the tensile strength (Figure 2(a)). The flexural strength values of the PLA and PHB mixtures made with PP increased with the addition of PLA, whereas it decreased slightly as the PLA ratio increased. On the other hand, the addition of PHB caused the flexural strength of the composites to decrease from 30.8 MPa to 24.1 MPa (for 10% PHB) and to 22.9 MPa when the PHB ratio was increased to 30%. When 3% MAPE was added to the PP composites, a general 5% reduction was seen in flexural strength. Adding 30% wood flour to the PP samples generally caused a 3% increase in flexural strength. The simultaneous addition of 30% W and MAPE to the PP samples caused an overall average increase of 37% in the flexural strength of the samples (Figure 3(b)). According to these results, it was determined that the addition of MAPE and wood flour at the same time significantly increased the flexural strength of the composites. Therefore, compatibilizing chemicals in composites is an important factor for improving mechanical properties. PP samples with added PLA and PHB: (a) Flexural modulus, (b) flexural strength.
Adding 10% PLA to the PP increased the impact strength by 4%, whereas 30% PLA decreased it by 17%. Likewise, a 10% PHB addition increased the impact strength value by 39%, but the addition of 30% PHB increased the strength less (10%). These results demonstrate that the mixing ratios of PP, PLA, and PHB had adverse effects of over 10% (Figure 4(a)). The fact that the impact strength was lower, especially when compared with the mixtures with MAPE added, also shows that the degree of bonding remained at lower rates without the addition of MAPE. Impact strength: (a) PP samples with added PLA and PHB, (b) samples with added MAPE and wood flour.
According to Figure 4, 3% MAPE added to the PP composites did not create a significant difference in the PP+10% PLA mixtures; however, MAPE increased the impact strength values in the PP+30% PLA and PP+10% and 30% PHB samples. The addition of 30% W (wood flour) to the PP samples reduced the impact strength values of the composites by an average of 12%. After adding 3% MAPE to the samples with wood flour, a 9% increase in impact strength values was detected (Figure 4(b)). However, they were lower than the control sample value. Nevertheless, MAPE increased the adhesion between the wood and plastic.
Morphological characterization
First, PLA and PHB biopolymers were added to the PP composites at a rate of 30%, and their morphological properties were examined. Then, the differences in the morphology of the samples were examined after adding 3% MAPE and 30% W (wood flour).
In the SEM images of PP+30% PLA+W, the wood flour is seen as small particles in the matrix (Figure 5(f)). Moreover, the wood particles display poor interaction with the matrix. The fibers are seen to break, and the particles are not homogeneous. The PP+PLA+ wood combination is not sufficiently mixed, and gaps are also seen within the fiber matrix. With the addition of MAPE to the PP+30% PLA+wood mixture, the holes within the wood matrix are closed, as seen in Figure 5(g). It is also striking that the structure is more homogeneous, as the addition of MAPE increased the fiber-matrix interaction. In the PP+30% PHB+W composite images, the wood is not homogeneously distributed in some parts. In addition, the gaps between the particles of wood and the areas where the particles are clumped together are not homogeneous (Figure 5(h)). When MAPE was added to the matrix, wood flour showed a more homogeneous distribution (Figure 5(g)). In addition, it was observed that the gaps between the wood and the matrix were closed, and the composite structure was better than in the non-MAPE sample. SEM images of PP samples with added PLA and PHB: (a) Neat PP, (b) PP+30% PLA, (c) PP+MAPE+30% PLA, (d) PP+30% PHB, (e) PP+MAPE+30% PHB, (f) PP+30% PLA+30% W, (g) PP+MAPE+30% PLA+30% W, (h) PP+30% PHB+30% W, (i) PP+MAPE+30% PHB+30% W.
Thermal properties
When Figure 6(a) is examined, it is seen that the composite with the best thermal stability is pure PP. While PP-PLA composites lost all their mass around 450 degrees when wood flour was added to the composite thermal stability increased (Figure 6(b)). The addition of MAPE improved thermal stability only in PP-PLA composite (Figure 6(c)). The addition of wood flour increased the thermal stability of the composite more than MAPE (Figure 6(d)). TGA curves of PP composites: (a). With added PLA, PHB, (b). With added wood flour, (c). With added PLA, MAPE and wood flour, (d). With added PHB, MAPE, and wood flour.
When Figure 7(a) is examined, the PP+30% PHB composite is seen to form a peak between 250 and 300°C, whereas, in the PP+30% PLA composite, the peak is beyond this point, between 275 and 375°C. On the other hand, Neat PP produced a single peak, and the mass loss at the highest speed was between 400 and 420°C. Upon examination of Figure 7(b), it was determined that the addition of MAPE and wood flour reduced the peak point of the composites, which shows the mass loss at the highest speed, between 400–450°C; however, new peaks were formed between 250 and 300°C and 300 and 350°C. Figure 7(c) shows that the addition of 3% MAPE carried the peak seen in PP+30% PHB between 250 and 300°C further (300–350°C) and reduced the peak point, indicating mass loss at maximum speed. In the PP+30% PLA composite, the addition of 3% MAPE did not change the location of the first peak but moved the second peak further (430–450°C). It also increased the mass loss at top speed. In Figure 7(d), the DTG curves of all composites are given in the same graph, which shows that the DTG curves of the PP+30% PLA+MAPE and PP+30% PHB+MAPE composites differed from those of the other composites. In the PP+30% PLA+MAPE composite, the peak point is at the most advanced point (430–450°C). The amount of hemicellulose in the wood flour had reduced the thermal stability of the composite.
64
DTG curves of PP composites: (a) with added PLA and PHB, (b) with added MAPE (3%), (c) with added MAPE and 30% wood flour, (d) all composites compared.
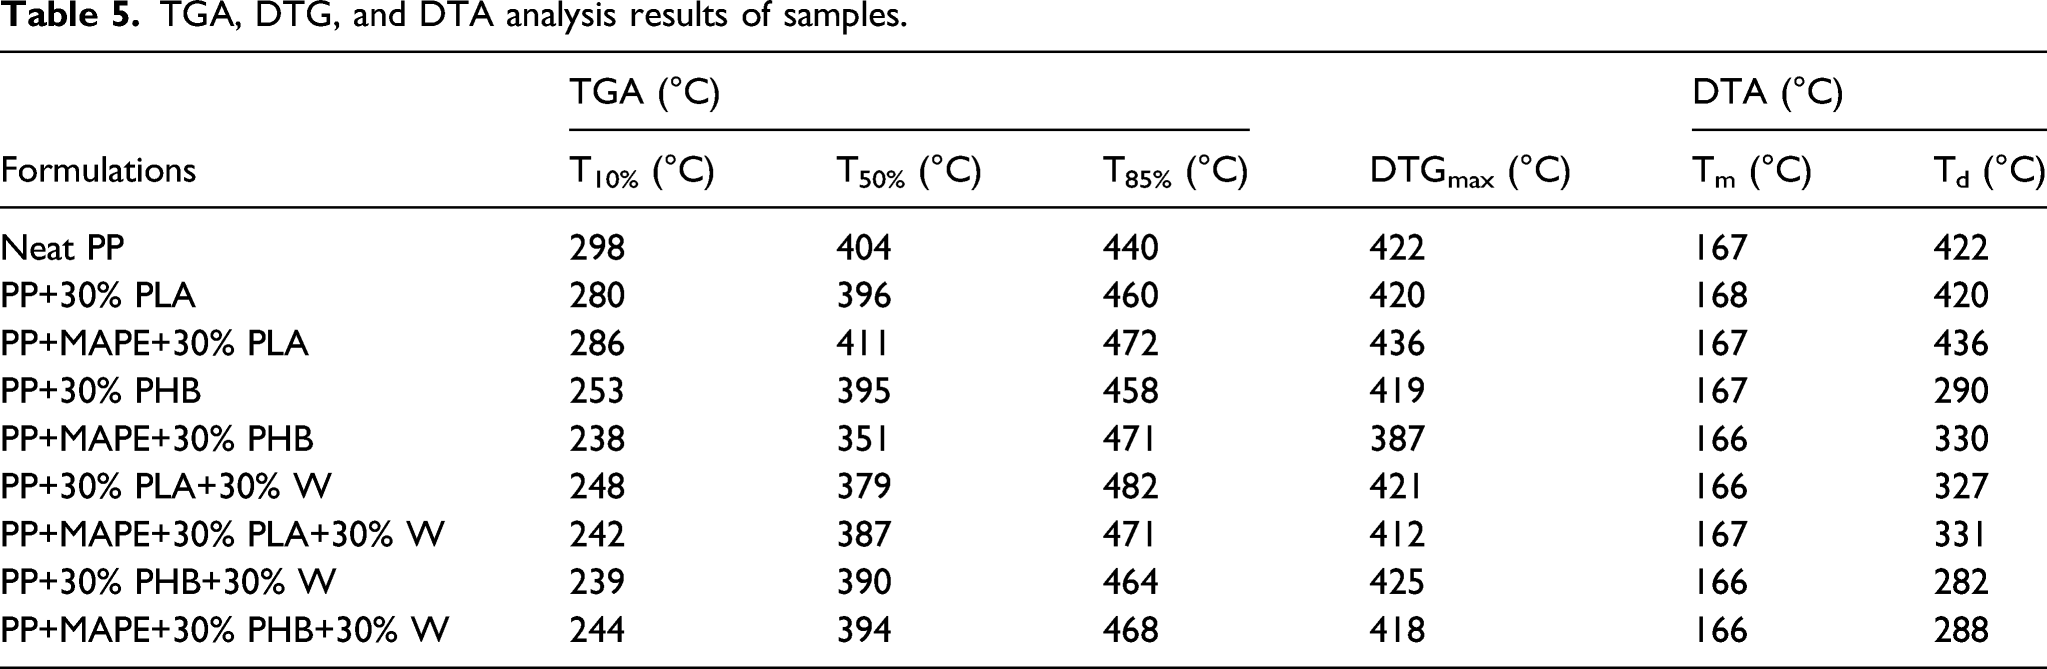
TGA, DTG, and DTA analysis results of samples.
Structural Properties
The FTIR analyses of samples with PLA, MAPE, and wood flour added to the PP are given in Figure 8(a). The FTIR analyses of samples with PHB, MAPE, and wood added to the PP are given in Figure 8(b). The FTIR analysis shows an O-H bond at 3000 cm−1, 3350 cm−1, and 3400–3500 cm−1; a C-H bond at 2880 cm−1 and 2800–2900 cm−1; a C-O-C bond between 1100 and 1160 cm−1; a C-O bond between 1035 and 1060 cm−1; a C-H bond at 1300 cm−1; and a CH2 bond at 1400 cm−1.66,67 FTIR analysis of samples: (a) PP blends with added wood flour, PLA, and MAPE, (b) PP mixtures with added wood flour, PHB, and MAPE.
In Figure 8(a), no different peak points were detected between the samples. In general, the chemical contents of the PP and the composites with added PLA, MAPE, and wood flour were found to be similar. Figure 8(b) demonstrates that the PHB, MAPE, and wood flour added to the PP did not make a significant difference in the chemical structure of the samples. The transmittance peaks of the samples were obtained at similar wavelengths.
Fuzzy MCDM results
Language variables and triangular Fuzzy number criteria ratings.
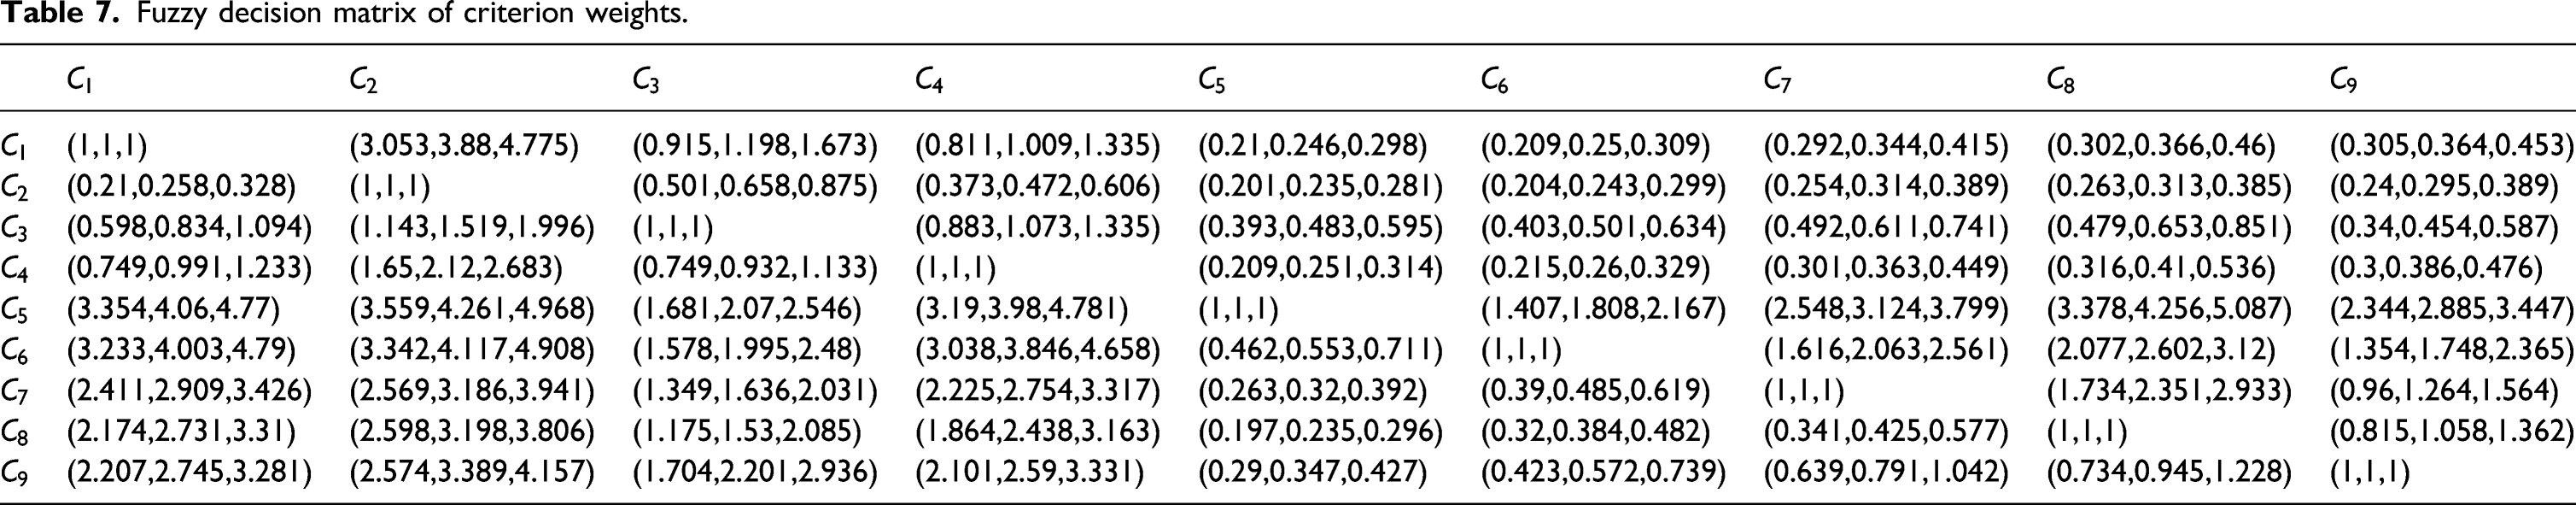
Fuzzy decision matrix of criterion weights.
Weight of Fuzzy AHP, BNP, normalized BNP (or weights), and ranking of each criterion.

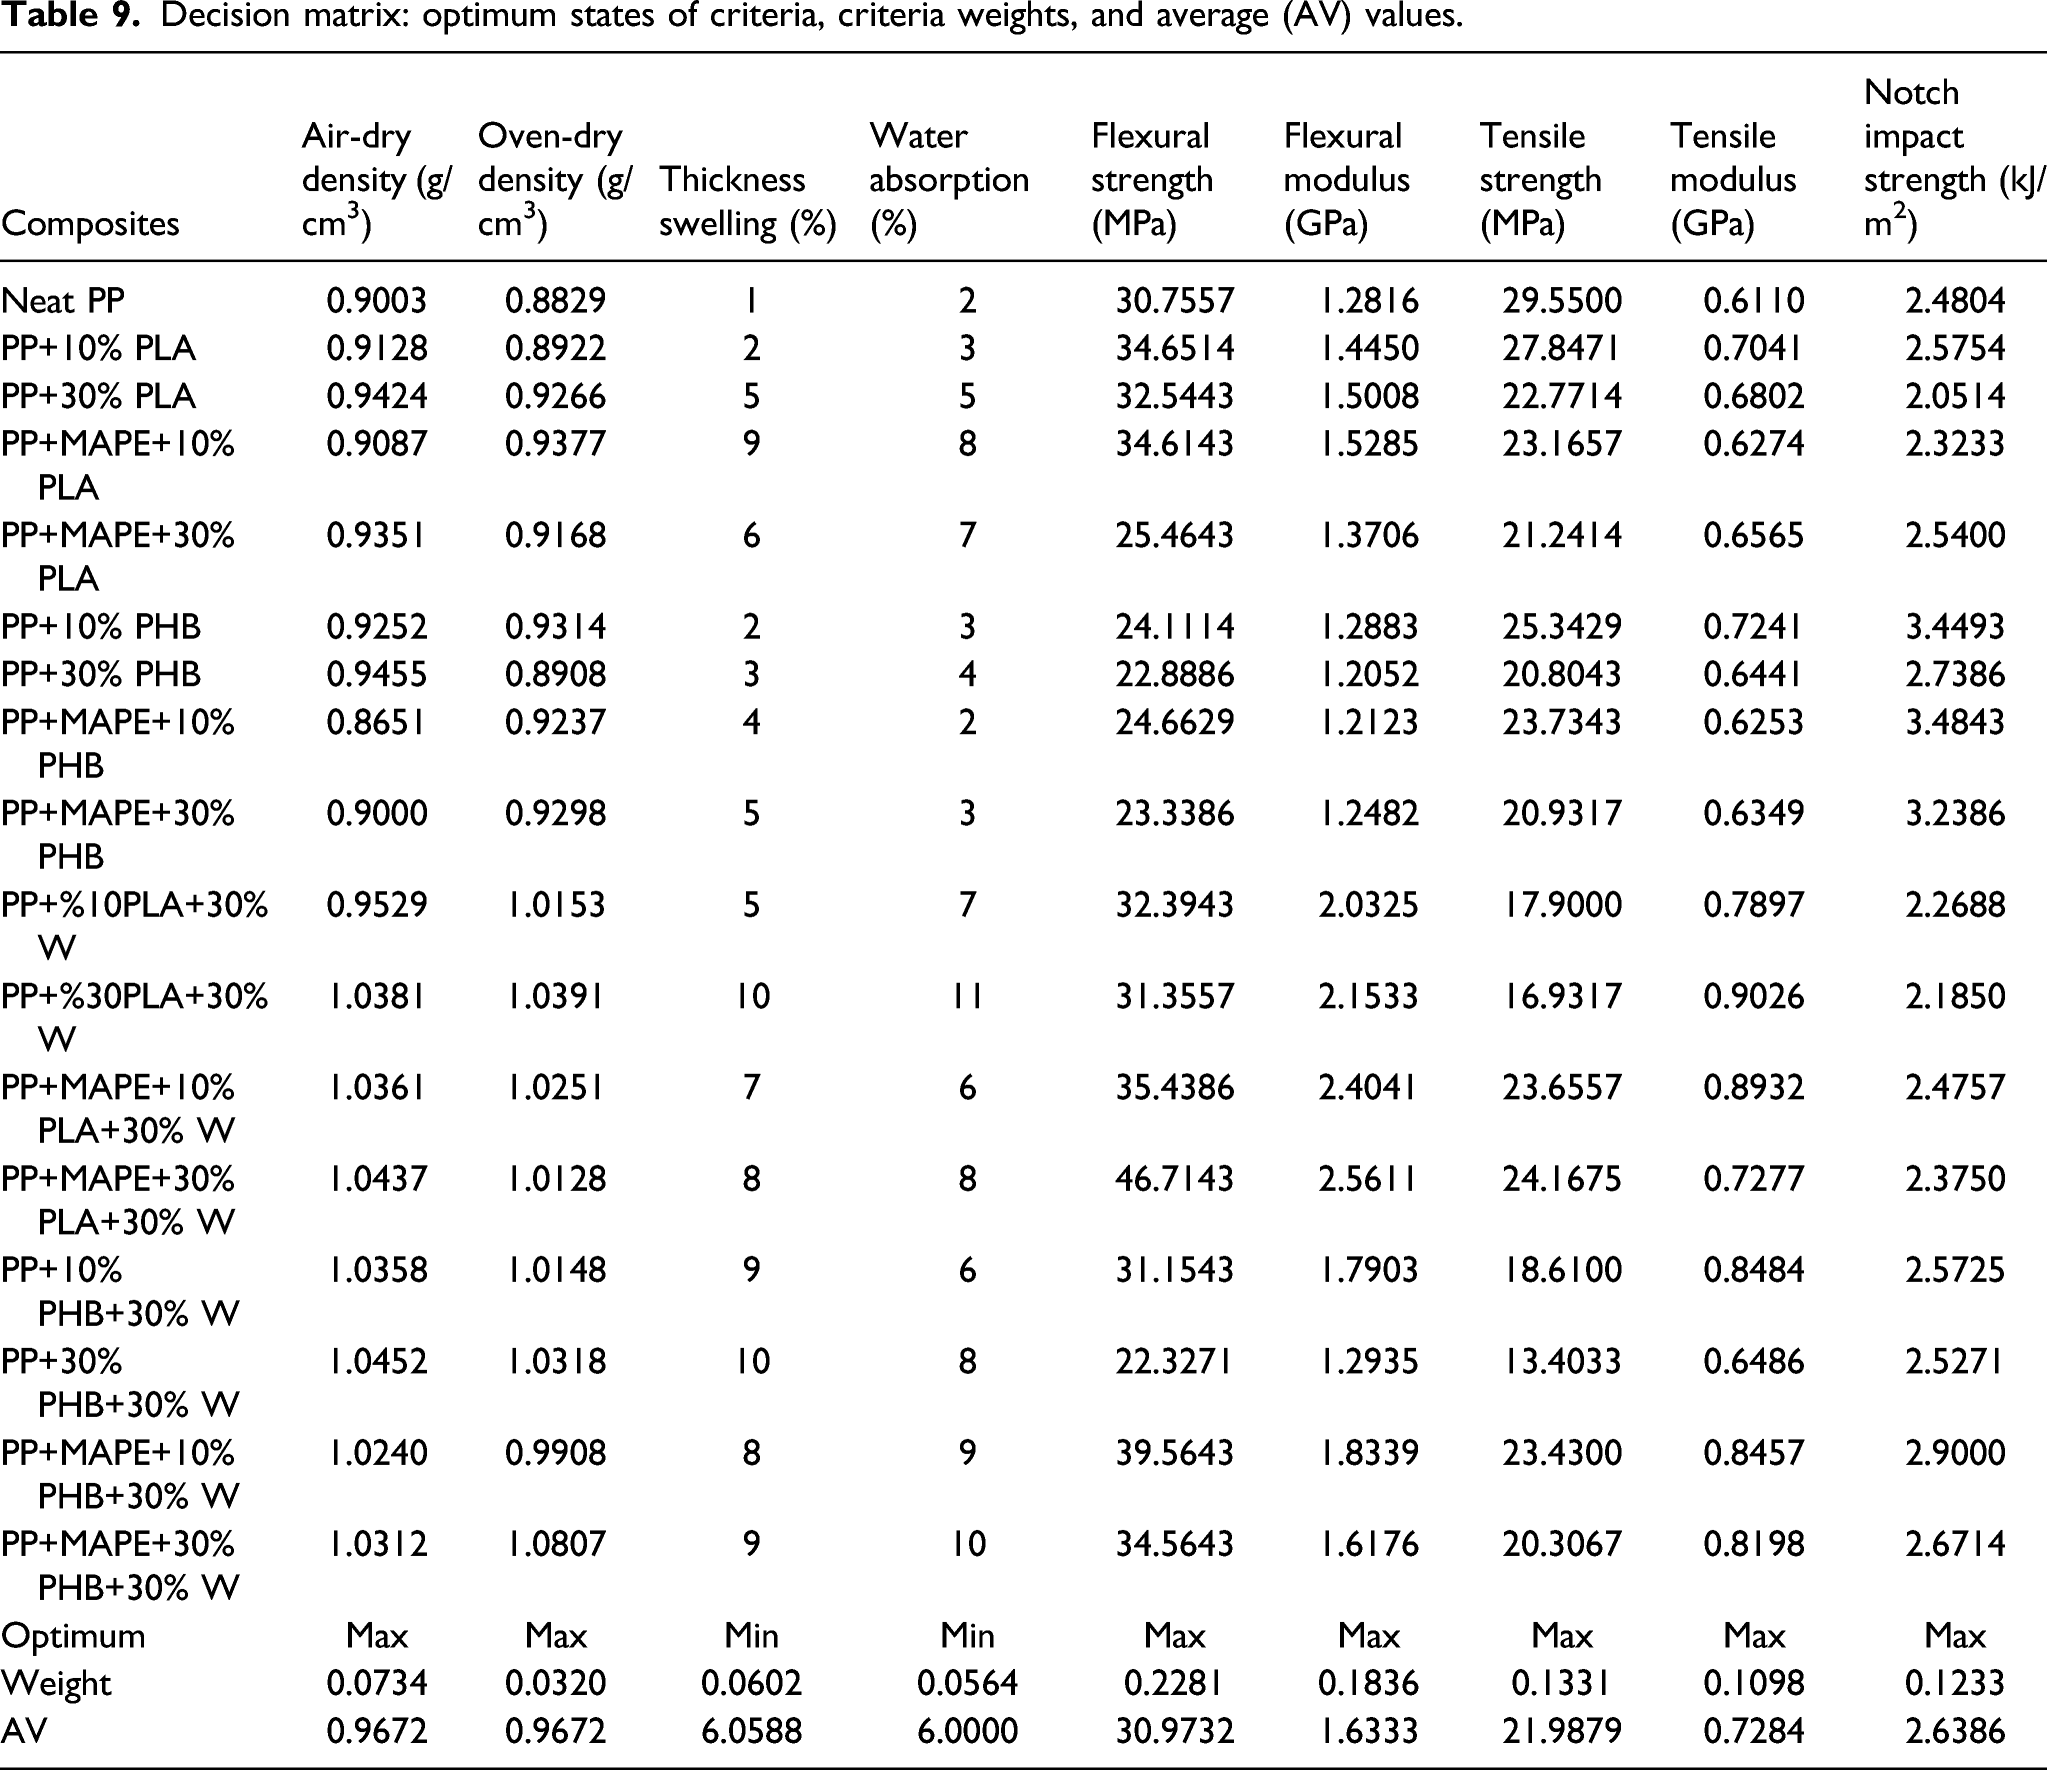
Decision matrix: optimum states of criteria, criteria weights, and average (AV) values.
Positive distances from average matrix.

Negative distances from average matrix.

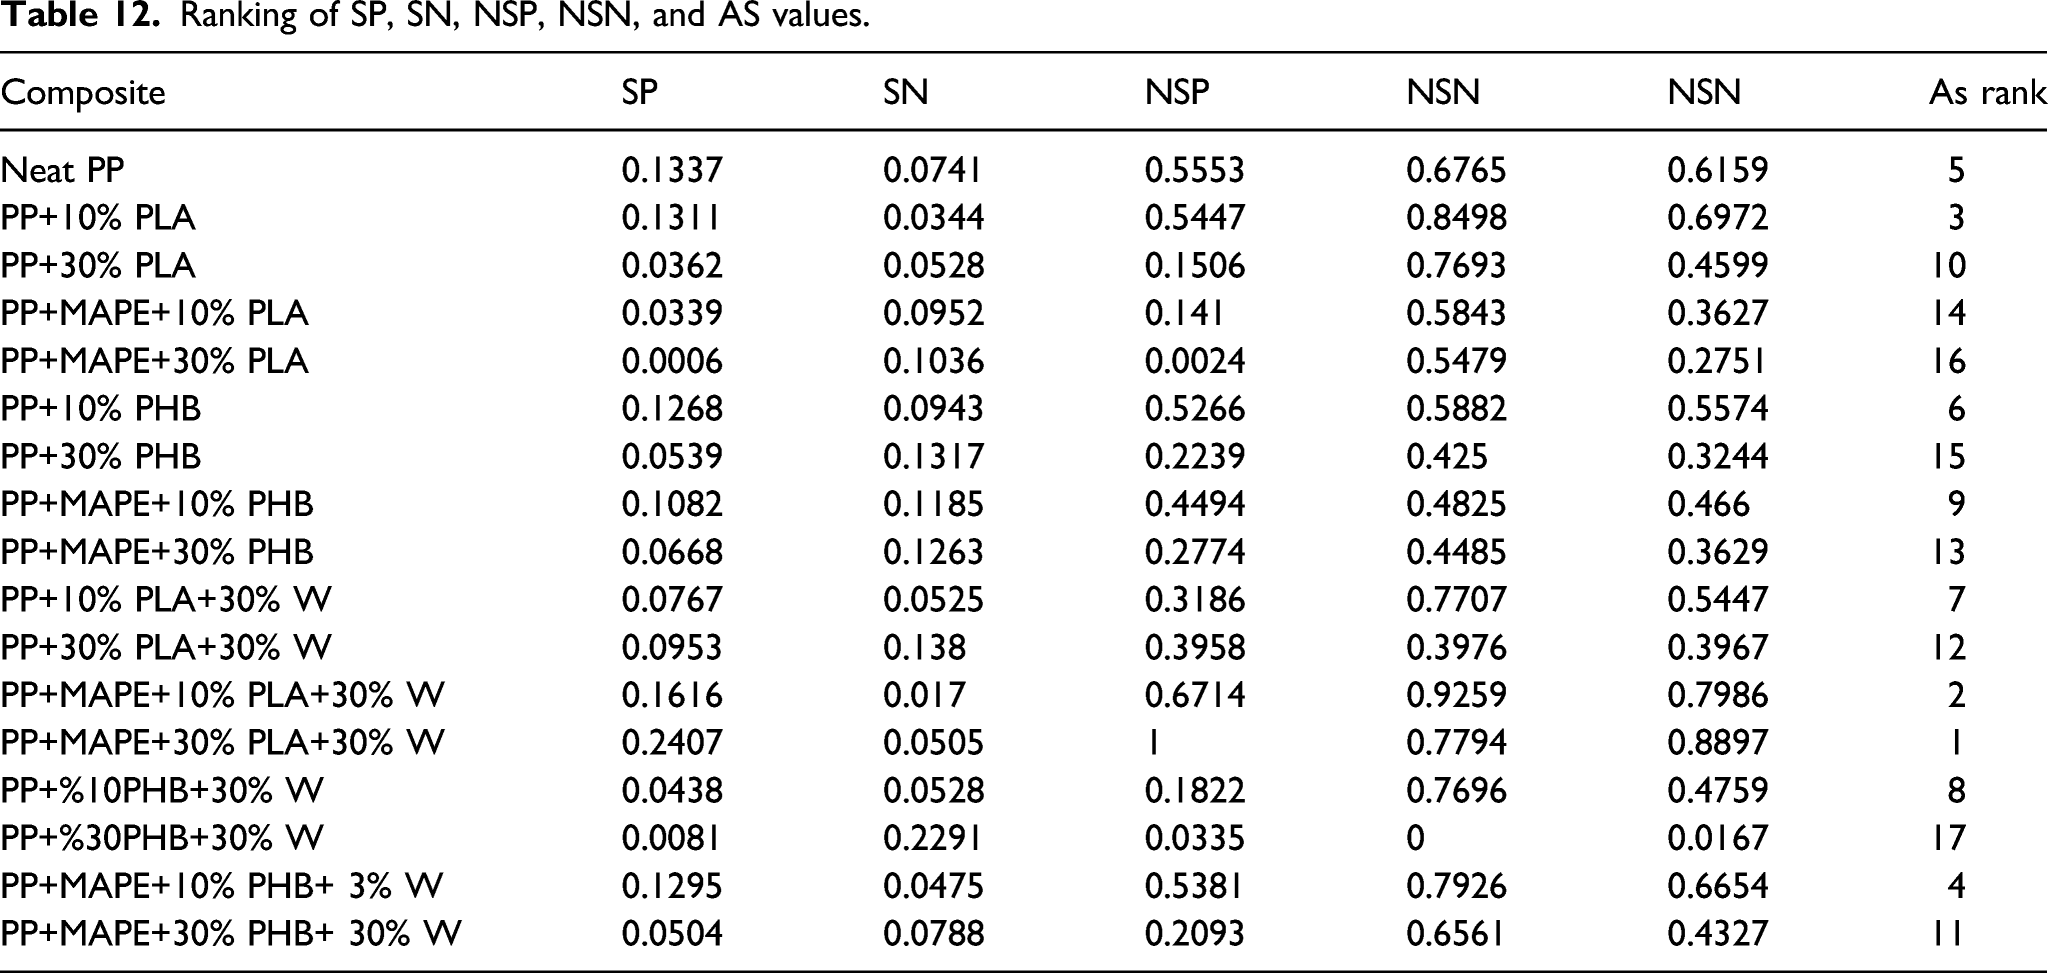
Ranking of SP, SN, NSP, NSN, and AS values.
Grey relational analysis results
Grey relational analysis results.

Conclusions
The study investigated the thermoplastic composites of PP-biopolymer blends and WF, and the obtained results were simulated with Fuzzy and Grey MCDM methods to determine the blends with the best properties. According to the obtained results, the PLA added to PP increased the density more than the added PHB. It was determined that the addition of heat-treated wood flour along with PLA reduced the density. Likewise, adding heat-treated and untreated wood flour to the PP + PHB composites reduced the density. Wood flour also increased the amount of water absorption and thickness swelling of the composites. The optimum amount of water absorption was obtained from the PP+30% PLA+30% W samples at the end of the 250th day. The amount of wood flour could be increased in composites to be used for insulation purposes. When the PP biopolymer was mixed with PLA and PHB, the tensile strength and tensile modulus values were generally seen to decrease. The addition of wood flour increased the tensile modulus values of the samples. The samples using the MAPE compatibilizer yielded better tensile strength and tensile modulus results than the samples without it. Adding 10% PLA or PHB to PP composites increased the notched impact strength, but it decreased when the ratio was 30%.The addition of 3% MAPE to the PP composites did not lead to a statistically significant difference in the PP+PLA samples. It was determined that the addition of 30% W (wood flour) to the PP samples generally reduced the strength values of the composites by 12%. After adding 3% MAPE to the samples along with wood flour, a 9% increase in tensile strength values was detected. However, it was still lower than the control sample with this increase. The SEM images revealed that 30% PLA added to the PP presented a homogeneous distribution in the matrix. Although homogeneously dispersed in the PP matrix, the PHB polymer was not as homogeneous dispersed as the PLA. The SEM images showed that the addition of 3% MAPE enabled the fillers to form a homogeneous distribution in the matrix.
In the characterization of the PP polymer composites, the TGA analysis determined that, except for the T85% value, the addition of PLA, PHB, wood flour, and MAPE reduced the thermal stability. The chemical structures of the samples were found to be similar in both the PP and the composites in which PLA, MAPE, and wood flour were added. The sample with the best characteristics was determined by using Grey and Fuzzy MCDM methods. The PP+MAPE+30% PLA+30% W was found to be the sample with the best characteristics, followed by that of the PP+MAPE+10% PLA+30% W. The third-ranking sample according to the Fuzzy method was the PP+10% PLA, but according to the Grey relational method, it was the neat PP. The results of the MCDM methods determined that the addition of MAPE, wood flour (W), and PLA had improved the physical and mechanical properties of the composites. It is not recommended to mix polymer combinations at very high speeds in a mechanical mixer or to allow the temperature of the polymers to rise above room temperature. Otherwise, the polymers would be exposed to a preheating process before pressing and might undergo thermal decomposition, weakening the mechanical properties of the composites. Furthermore, mixing polymer combinations at high speeds for a long duration in a mechanical crusher is not recommended.
Footnotes
Acknowledgements
This paper was prepared from Dr thesis study of Orhan Kelleci under the supervision of Deniz Aydemir from Bartin University Faculty of Forestry, Turkey. The authors wish to thank Kahramanmaras Sutcu Imam University Faculty of Forestry for allowing the use of laboratory facilities.
Declaration of conflicting interests
The author(s) declared no potential conflicts of interest with respect to the research, authorship, and/or publication of this article.
Funding
The author(s) disclosed receipt of the following financial support for the research, authorship, and/or publication of this article: This work was supported by the Bartin University, Department of Scientific Research Project (grant number 2018-FEN-CD-002).