
Abstract
The aim of this study is to investigate the effects of recycling on the mechanical properties of Elium resin reinforced by flax fibers. A thermocompression recycling process is investigated and applied to production waste of thermoplastic composites. Five recycling operations are carried out on the initial material. Specimens are tested under static and fatigue tensile tests. In addition, the acoustic emission technique is used to identify damage mechanisms evolution during mechanical tests. Recorded events are post processed by the k-means unsupervised pattern recognition algorithm. The classes of acoustic emissions obtained are correlated with scanning electron microscopy observations to justify the existence of damage mechanisms detected. Results of static tests show that the ultimate tensile properties of the composites studied decrease with recycling operations. However, an increase in the elastic modulus is reported. In the fatigue tests, results show that stiffness, hysteresis loop and loss factor are affected by recycling operations. Also, a decrease in the life time with reprocessing conditions is observed. In acoustic tests, depending on the recycling operations, two or three classes of events are detected. The acoustic characteristics of these classes are compared. Then, a correlation between these AE classes of events and damage mechanisms observed is proposed.
Keywords
Introduction
Fiber reinforced thermoplastics, are increasingly used to replace metals in numbers of industrial, namely in sporting and transport applications.1-5 This is mainly due to the materials’ recyclability and the fact they can be easily reground and reused. Compared to conventional materials, they also present good stiffness, excellent chemical and impact resistance, and offer greater design flexibility at a relatively low price.6,7 Besides the need of recyclable composite, natural reinforcements such as flax fibers are generally used to reduce the negative impact of composite waste on the environment. They are biodegradable 8 and they have lower cost and comparatively good thermal and mechanical properties. 9 Natural fibers exhibit specific properties similar to those of synthetic glass fibers. 10
Generally, thermoplastics are more recyclable than thermosets. Our study concerns a novel liquid thermoplastic, Elium resin. In literature, there is little service experience in recycling bio-sourced composite made by this resin. Thus, it is necessary to assess this subject, both technically and economically. Different recycling techniques have been studied for the last two decades such as mechanical processes (mainly grinding), pyrolysis, solvolysis, and other thermal processes.11-13 Dylan et al. 14 studied the feasibility of recycling composite wind turbine blade components made from Elium resin and reinforced with glass fibers. Their results prove that glass fibers, recovered by dissolution, maintain tensile strength (160 N/g, mass/normalized force) and present only 12% reduced stiffness compared to unrecycled material. In addition, the authors demonstrate that the material becomes stiffer (12 GPa compared to 10 GPa) and stronger (150 MPa compared to 84 MPa) after the injection and grinding process. They show also that the wind turbine blades can be down-cycled by thermoforming into other products such as skateboards. Our interest is particularly in a recycling method based on a thermocompression process. In the literature, one can some work dealing with the effects of a thermomechanical recycling process on polypropylene composites properties such as that of Bahlouli et al. 6 Their results show that the material undergoes a decrease in failure stress and impact energy as well as molecular weight. They explain this by the succession of polymer scission chains. Other studies concerning the recycling of polypropylene alone can be also identified such as Aurrekoetxea et al. 15 On the one hand, they report that five cycles of recycling are necessary to observe significant loss in mechanical behavior. On the other hand, an increase in the yield stress and the Young’s modulus with reprocessing was reported. They explain the improvement in these properties by the increase in the crystallization rate with recycling.
Another part has been developed in this work concerning the identification of damage mechanisms by the acoustic emission (AE) technique. In this context; many approaches were proposed in the literature.16-20 De Rosa et al. 20 present a review of AE applications in studies on natural fiber composites. They highlight the damage evolution, the crack propagation and the failure mechanisms detection. In addition, they develop a correlation between the acoustic emission bursts and the microscopic observations to identify the damage mechanisms. A number of studies also exist, in which AE features analysis is assisted by unsupervised method and associated with principal component analysis (PCA).21-24 This method can lead to reliable classification of AE events into specific damage modes. 25 Various unsupervised method can be used for clustering AE events such as Kohonen’s neural network, 26 k-means algorithm 27 and Fuzzy C-Means clustering method (FCM).23,28
Huguet et al. 29 classify detected acoustic signals with the Kohonen Self- Organising Map methods. They prove that the pattern recognition technique can lead to a reliable identification of AE data and a better understanding of the damage modes. Monti et al. 21 use the K-mean algorithm to classify the different acoustic signals detected during tensile tests carried out on flax/Elium composite. They show high repeatability of the data clustering by using five classification parameters: amplitude, duration, rise time, number of counts to peak and absolute energy. In addition, they use the sentry function to discuss the effects of the acoustic energy generated during fracture on the mechanical behavior of the material. They also validate the AE results with microscopic analysis. Results show that matrix cracking and fiber-matrix debonding are the first effects observed. Then, fiber pullout and fiber breakage accumulate to cause final failure. Habibi et al. 24 studied the damage mechanisms of short-flax fiber/epoxy composites. They identify the AE events of damage modes according to their amplitudes using the K-mean algorithm: matrix cracking (42–60) dB, fiber-matrix debonding (60–80) dB and fiber breakage (70–90) dB. Monti et al. 21 summarized also some research that have classified the AE signals based on the events amplitude. Several amplitude ranges were related to matrix cracking (35–45, (42–60) dB, etc.), fiber–matrix debonding ((45–60), (60–70) dB, etc.), matrix–matrix friction ((40–55) dB), fiber–matrix friction ((55–85) dB), fiber pullout ((60–80) dB), fiber cracking ((35–60) dB) and fiber breakage ((70–100), (80–96) dB, etc.). Oz et al.30, 31 have investigated the damage progression in unidirectional carbon fiber reinforced polymers. They identify damage modes under an optical microscope and correlated with k-means algorithm. They show that matrix cracks and fiber/matrix debonding in resin pockets have high amplitude and duration characteristics, whereas delamination’s have low amplitude and mid-duration characteristics and fiber breaks have high average frequency characteristics. Also, they validate the correlations between the AE clusters and damage modes with a finite element model. Arumugam et al.,23,28 studied the mechanical properties and the AE response in glass-epoxy composites using FCM associated with PCA and parametric analysis. Time–frequency analyses was performed for discriminating damage mechanism such as: matrix micro-cracking, delamination, fiber breakage, and matrix macro-cracking. They develop also a noise study based on Discrete wavelet transform to identify the noise associated with each signal.
The aim of this paper is to investigate the recyclability of the innovative flax/Elium composite. Recently, we have studied the vibration behavior of recycled Elium resin as well as recycled flax/Elium composite. 32 In this work, static and fatigue tensile tests were carried out on recycled materials. In addition, all tests were monitored by the AE technique in order to identify failure mechanisms.
Materials and manufacturing
Elium resin
In this study, Elium resin is used. It is a recently liquid thermoplastic resin composed of 2-propenoic acid, methyl ester or methyl (methacrylate) monomer and acrylic copolymers.33,34,35 The main advantage of this recently developed resin is the low viscosity of 100cP which allows polymerization at relativity low temperatures even at room temperature and it is suitable for VARI and RTM processes. To activate this resin, peroxide (CH50x) can be used. It can be cured at room temperature and demolded after 4 h. The recommended peroxide ratio is from 2% (slow reactivity) to 3% (higher reactivity).
Unrecycled and recycled composites
The unrecycled composite with a fiber volume fraction equal to 35% is manufactured with structure comparable to that of recycled materials. The fibers in this composite are small bundles oriented in a random way. A liquid resin infusion process is used to produce this composite.
A thermocompression process is used for manufacturing recycled materials (Figure 1). It consists of reshaping the waste into the desired component by the combined action of temperature and pressure. Manufacturing and recycling processes of the studied bio-composites.
The recycled material is a short fiber reinforced composite because the initial continuous fiber composite must be cut into small-grained composites before any compression process. The small rectangular particles of composites are placed between two steel plates which form the compression mold measuring 450 × 450 mm2. Then, using a 40-ton TCE press machine manufactured by DK Technologies, the recycling process is carried out by compression of the materials between two hot plates. Five recycling operations are carried out flax/Elium composites waste.
The unrecycled and recycled composite specimens are denoted by CRi. The symbol “i” indicates the number of times they are recycled (i = (0, 1, 2, 3, 4, 5)).
Experimental setup and research methodology
Tensile tests and AE procedure
Specimens are subjected to uniaxial loading in static and fatigue tests according to the standard test method ASTM D3039/D3039 M.
36
The tests are carried out with a tensile machine equipped with a 10 kN load cell. The tensile specimens have rectangular geometries (250 × 30 × 3 mm3). The experimental set-up is shown in Figure 2. Minimum of five specimens are tested at a strain rate of 0.5 mm/min at room temperature. The strain in the tensile direction is measured by means of an extensometer with a gauge length of 12.5 mm. Fatigue tests are performed using sinusoidal waveform at a controlled displacement with a frequency of 5 Hz. Mean displacement dmean is kept constant and set to 40% of displacement at failure measured in static tests. The amplitude of the waveform is about 20% of displacement at failure. Experimental setup of tensile tests associated with acoustic emission method.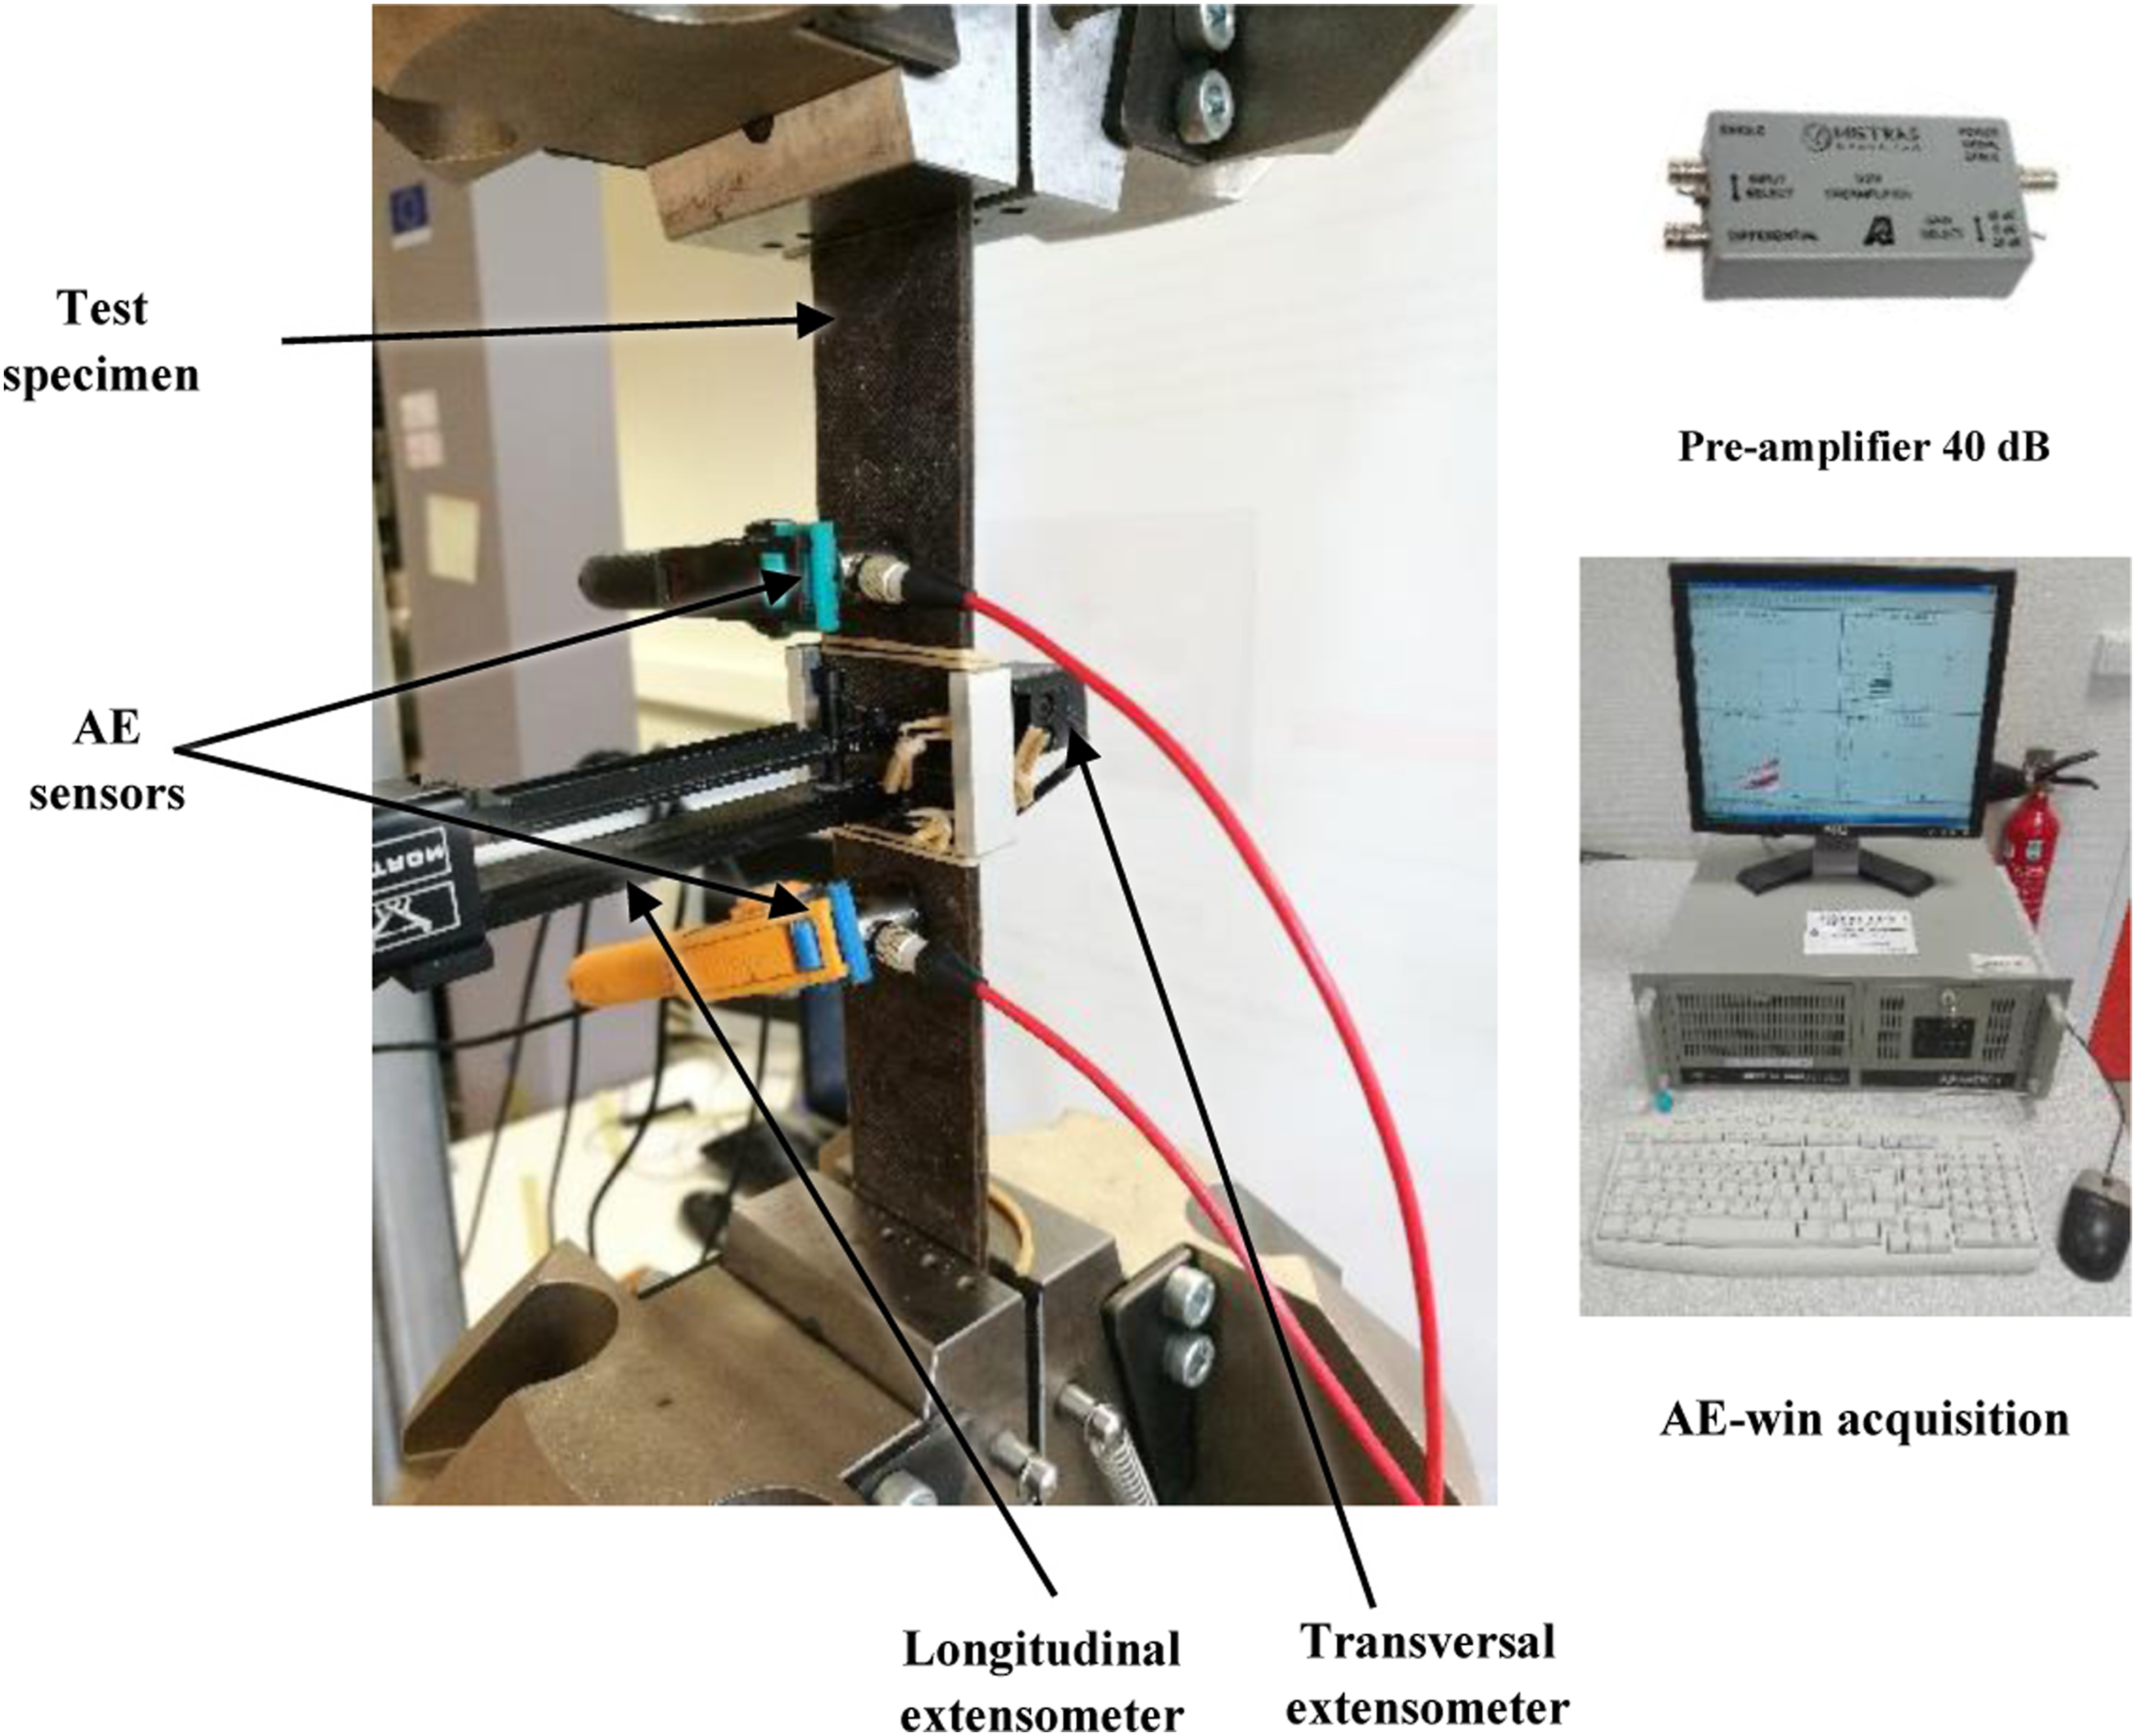
During static and fatigue tensile tests, the damage evolution is analyzed and identified by the AE technique (Figure 2). Two piezoelectric sensors with a bandwidth of 100 kHz to 1 MHz and a resonance peak of 300 kHz are coupled to the specimens. A coupling agent (silicon grease) is used between the sensors and the material surface. Only events recorded in the gauge length delimited by the two sensors (100 mm) were recorded. Recorded AE events are registered with a sampling frequency of 5 MHz. During structure loading, the output of each sensor is amplified through a low-noise preamplifier with a 40 dB gain. It is used to amplify the signals received and to remove any extraneous noise. Signals are furthered processed by the AEwin software. Pencil lead break tests are performed before each test. The role of these tests is to verify that the system is functioning properly and also to define an amplitude acquisition threshold. This parameter was set at 38 dB to avoid all detection of parasitic signals coming from the test machine or other external sources (noise). The AE data are dependent on temporal acquisition parameters, namely: PDT (Peak Definition Time), HDT (Hit Definition Time), and HLT (Hit Lockout Time). These temporal parameters are set to PDT = 50 μs, HDT = 100 μs and HLT = 200 μs. After tensile tests, microscopic analyses of failure mode are carried out by scanning electron microscopy (SEM) to detect damage mechanisms of failure profiles.
AE data processing
Acoustic emission data are processed with NOESIS.
37
The K-mean algorithm
27
is used for unsupervised pattern recognition for classifying processes. Five temporal parameters are selected: amplitude, duration, rise time, number of counts to peak, and absolute energy (Figure 3(a)). The k-mean algorithm was applied with Euclidian distance and a random initial partitioning. It was repeated several times with 1000 iterations each time, for a range of classes varying from 2 to 7. The accumulated acoustic data are separated into an optimal number of k clusters. The K-mean algorithm offers the best separation of data with regard to mathematical considerations, without really taking physics into account. (a) Characteristic of AE events and (b) the criterion Rij with number of classes.
Before the application of the algorithm, data sets are normalized by the following transformation

After each application of the algorithm, an average value of the Davies and Bouldin criterion Rij (D&B)
37
is calculated using equation (2)

The optimal number of class k is the one that minimizes the average value of the Davies and Bouldin criterion
Experimental results
Mechanical properties
Static behaviors of recycled composites
Measured stress/strain curves obtained from static tests are plotted in Figure 4 for CR0 and CR1 specimens. The behavior can be analyzed in two parts. The first part presents a short linear response which corresponds to the elastic domain. This zone is followed by a quasi-linear response which presents a decrease in rigidity up to fragile failure. The loss of stiffness appears at very low deformation and stress level. It should be noted that the unrecycled material CR0 presents an advantageous failure property ( Monotonic tensile test stress-strain curves for CR0 and CR1 specimens.
Figure 5 presents the effects of five recycling operations on the composites’ properties. From Figure 5(a), we can notice that the Young’s modulus E values increase with recycling operations. A progressive increase from 5.4 GPa (CR1) to 7.1 GPa (CR5) is observed. On the other hand, we notice a slight decrease in the ultimate strength and strain (Figures 5(b) and (c)). The strength decreases from 15.6 MPa (CR1) to 13 MPa (CR5). A significant decrease in the ultimate strain from 0.72% (CR1) to 0.23% (CR5) is observed. Recycling effect on the mechanical proprieties of the flax/Elium composites: a) Young Modulus, b) Failure strength and c) Failure strain.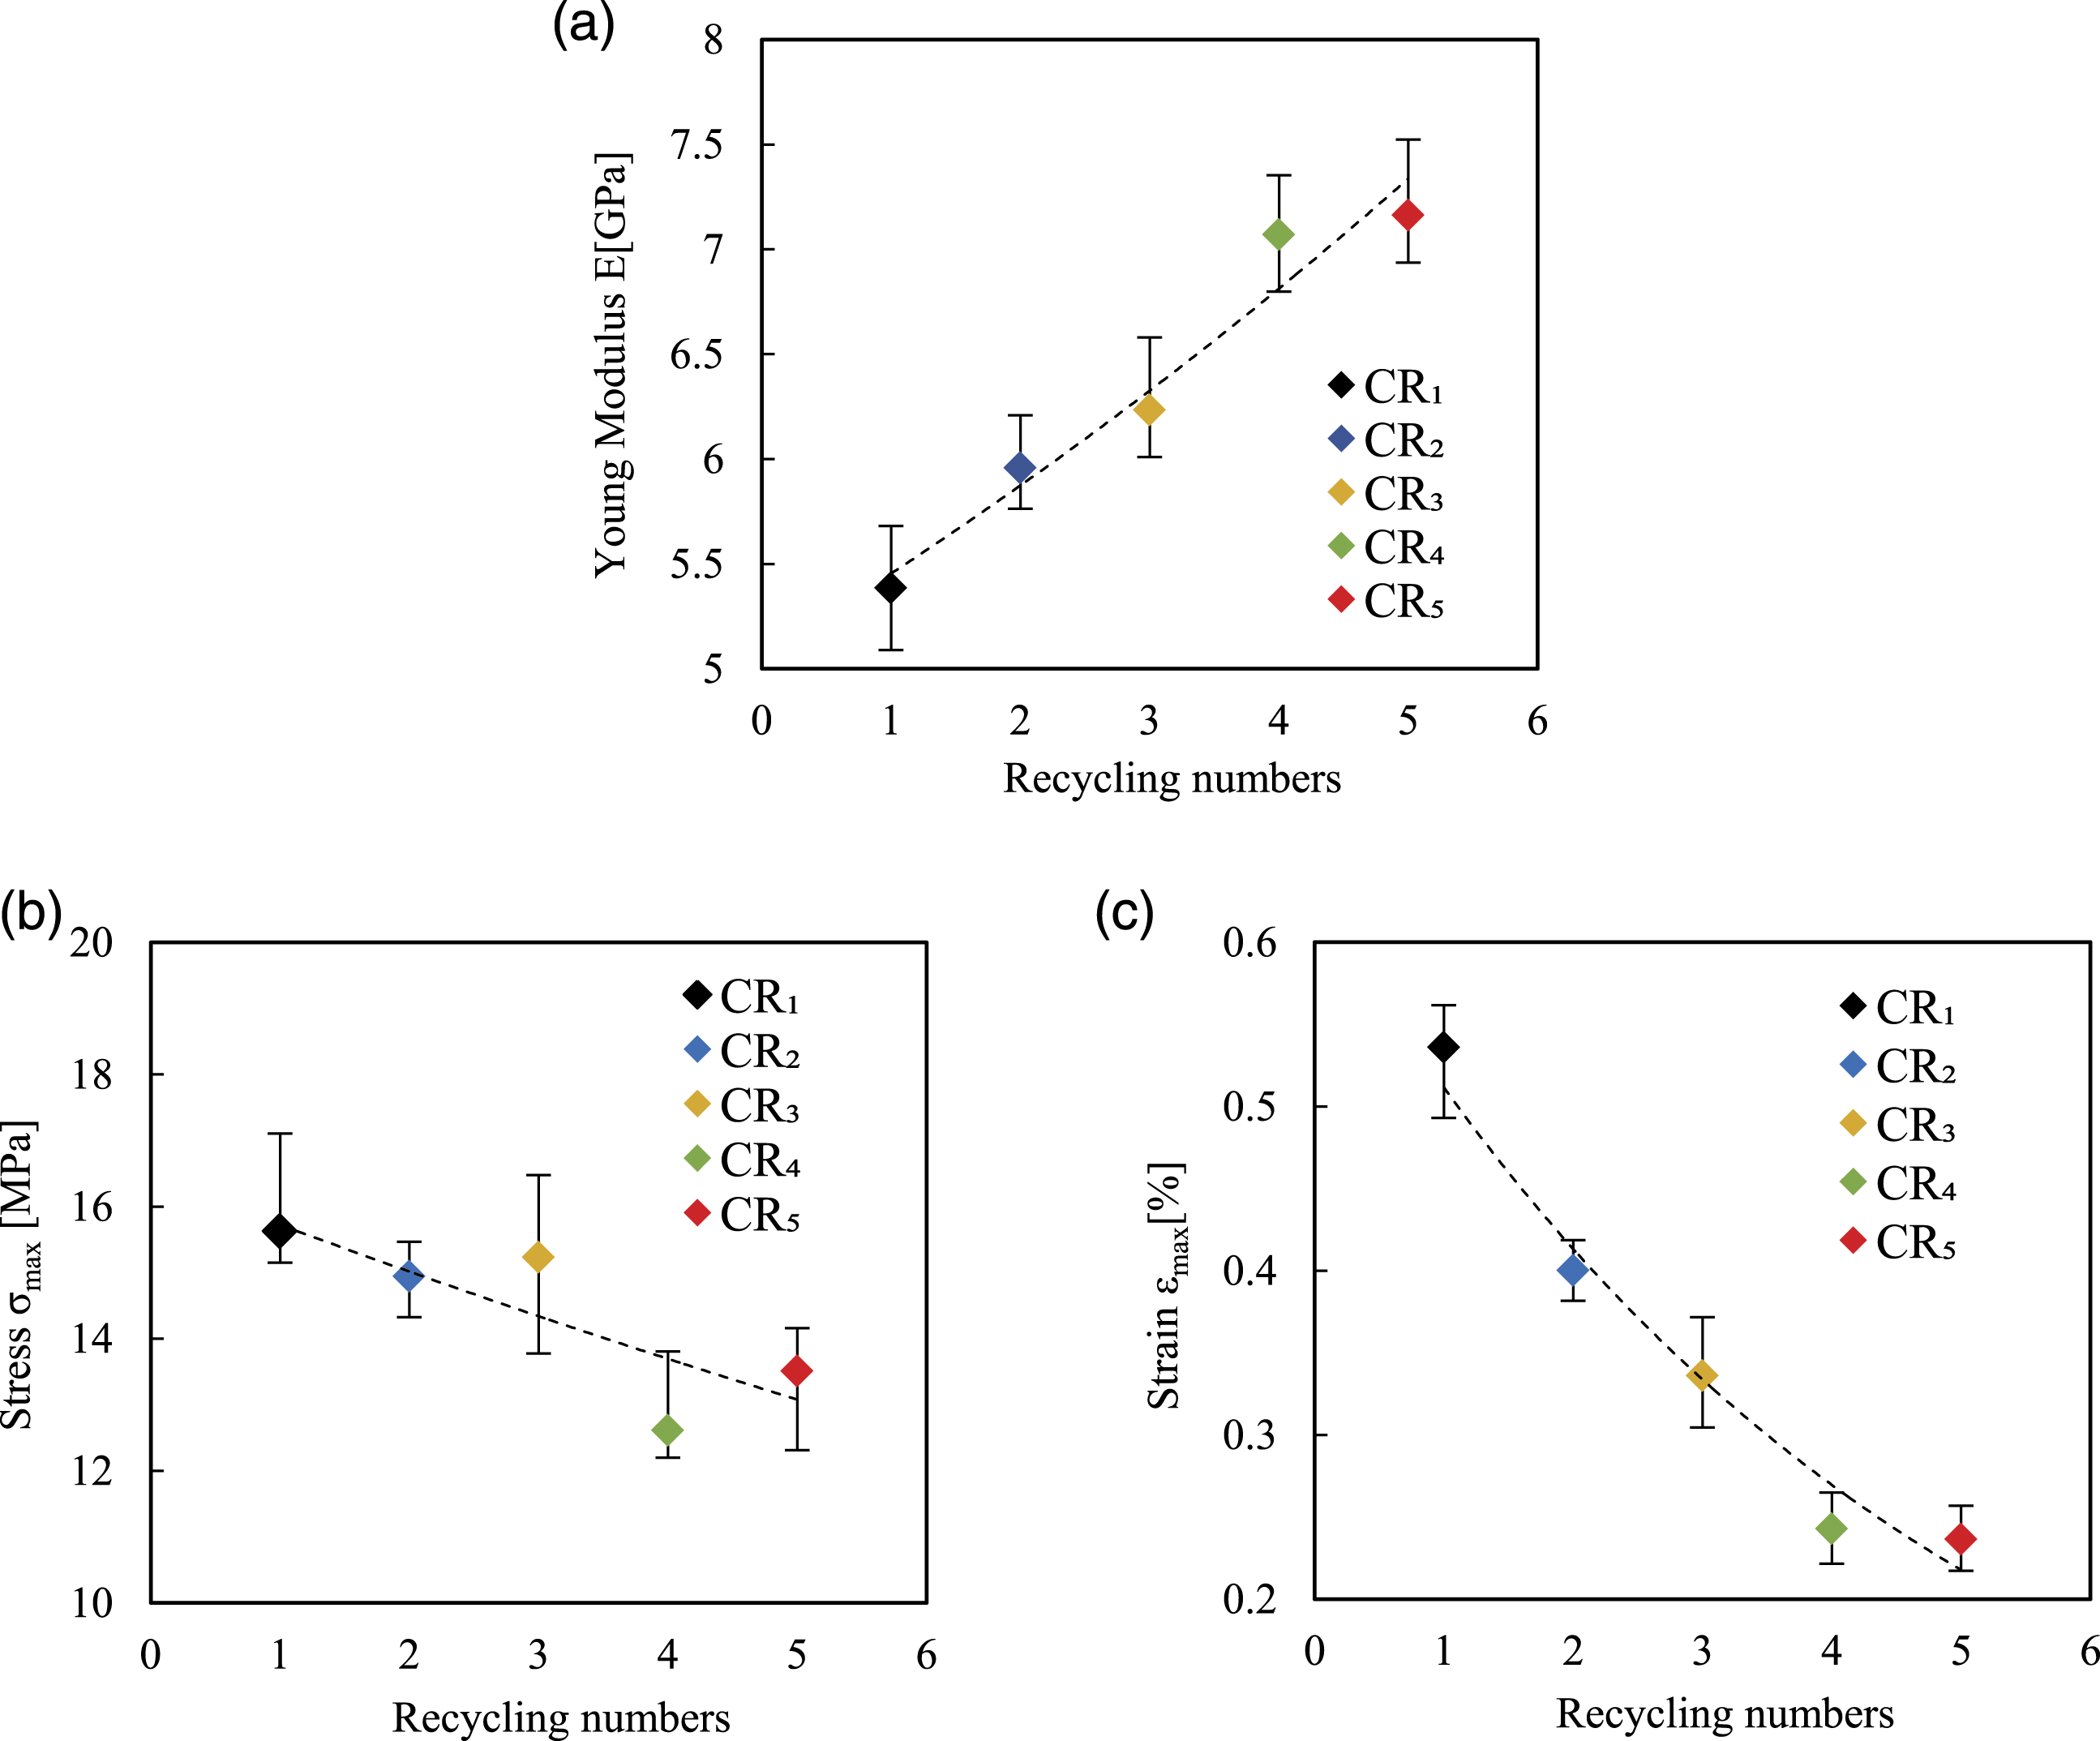
To explain this behavior, several hypotheses can be proposed. First, the reduction in failures properties can be explained by the recycling process conditions in which high temperature and great pressure are necessary. These conditions cause damages to the polymer and involve a deterioration of the fiber/matrix interface. This greatly affect the composite performance. Also, multiple cutting steps of composite waste into small grains is required before any compression process. This step reduces fiber length and consequently causes loss of failure performance. At fiber scale, the degradation of properties can be caused by the inherent lower thermal stability of lignocellulosic fibers. Composites reinforced with lignocellulosic fibers are more prone to undergo thermal degradation during processing than neat polymers. 38
In contrast, the recycling process seems to have a positive effect on the Young’s modulus. To explain this, the evolution of density as a function of recycling operations was investigated. 32 Results show that the density of the Elium resin as well as the flax/Elium composite rises with repeated recycling operations. This is mainly related to an increase in the degree of crystallinity of Elium resin. 32 Thus, the rise in the crystalline rate cause obviously an increase in rigidity and consequently an increase in Young’s modulus property.
Fatigue behaviors of recycled composites
During fatigue tests, the maximum load Fmax according to the number of cycles (N) is recorded. For unrecycled and recycled composites, the maximum load F
max
is normalized to the initial maximum applied load Fmax0. Figure 6 shows typical curves for stiffness reduction measured by (Fmax/Fmax0) as a function of the number of cycles The analysis of these results shows that recycled composites have similar fatigue behavior to that of the unrecycled composite. Three phases in the fatigue life are derived from the stiffness reduction curves. In the first phase, rapid stiffness reduction is observed. In the second phase, the decrease is slower, corresponding to the near total consumption of the fatigue life of the material and finally, in the third phase, which is very short, the loss of stiffness accelerates rapidly up to specimen failure. Stiffness degradation.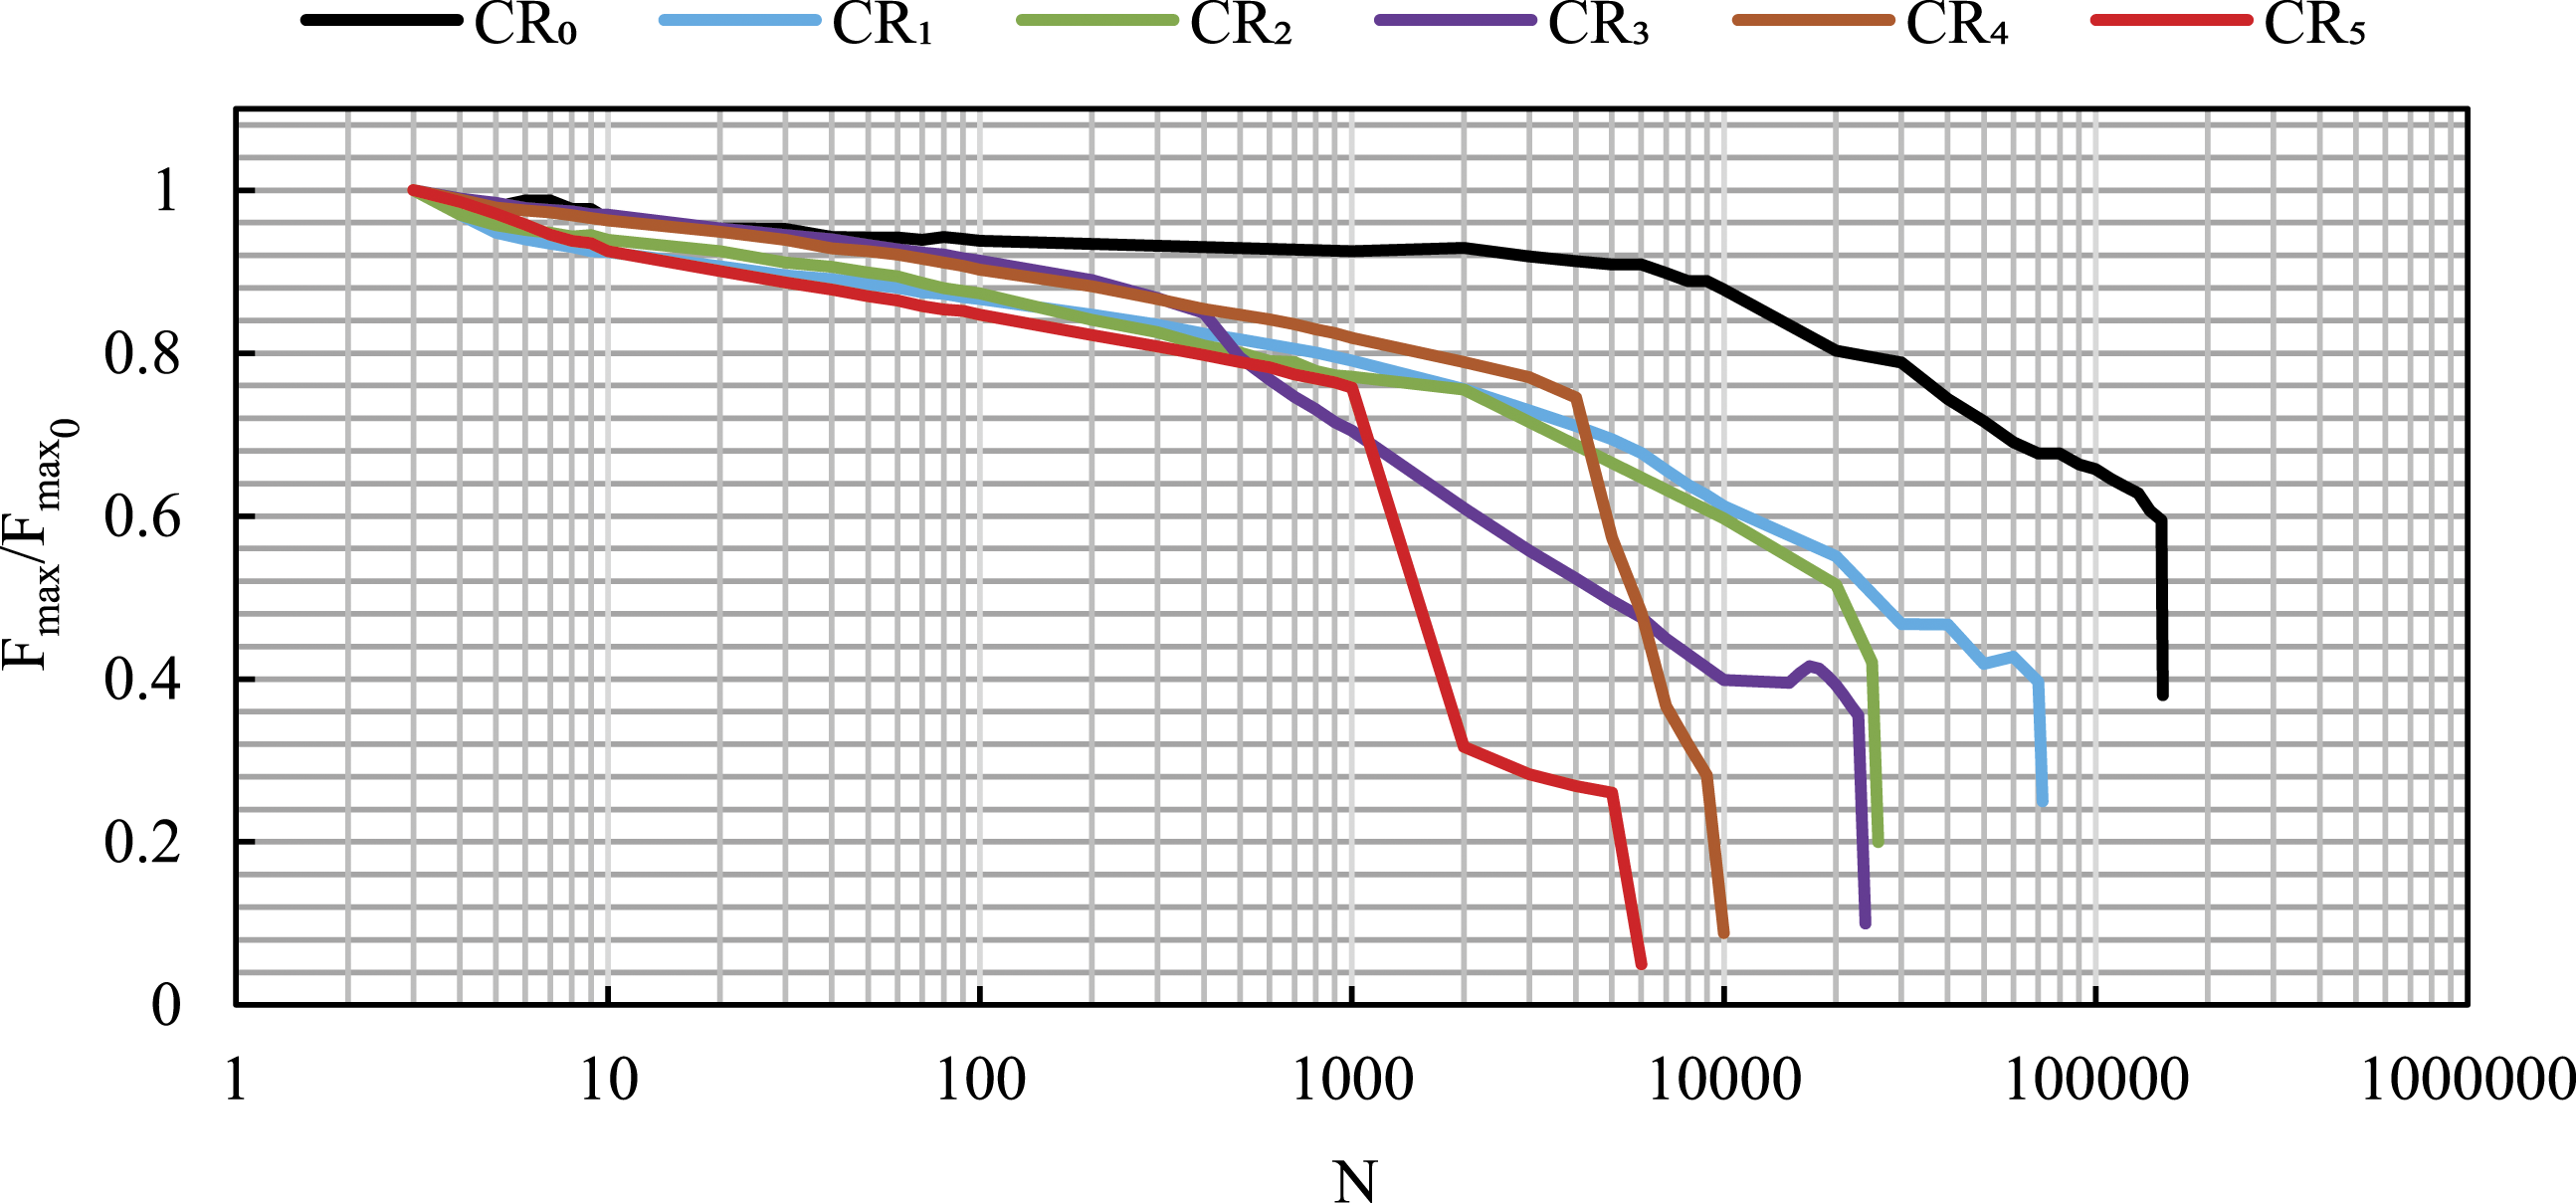
Fatigue life using two criteria’s N 20 and N f .

To explain the decrease of lifetime with repeated recycling, several hypotheses can be proposed. At first sight, the damage of the polymer, the deterioration of the fiber/matrix interface and the reduction in fiber length have a great influence on the stiffness properties and contributes widely to the evolution of damage. At second sight, the deterioration of composites’ performances may probably be related to the presence of residual stresses (tensile or compressive stresses). 40 These stresses can be existing in recycled materials without an external load being applied to the composite. During the thermocompression process, the material is subjected to high temperature and pressure causing the residual stresses to introduce and transferred between the matrix and the reinforcing fibers. Residual stresses can affect the stress–strain behavior as well as degrading the strength resulting in cracking, delamination and lower fatigue, and fracture toughness performance.41,42,43 Also, thermo-residual stresses can exist during the recycling process in the thermoplastic composites. 44 These stresses may exist when the recycled materials were cooling down from the high process temperature to the test temperature.
Damage analysis
Microscope analysis
In order to study damage mechanisms occurring during static and fatigue tests, several microscopic analyses are performed by SEM of the failure profiles (shown in Figure 7). Label 1 in Figure 7 shows a lot of unbounded interfaces between adjacent elementary fibers inside bundles, where the matrix cannot impregnate the fibers due to their very high density. Several cracks can be observed around them. Fiber–matrix interface debonding appear in every recycled specimen. Also, debonding between composite grains (bundles of fiber) are observed (Figure 7 label 2). Some cracks in matrices can also be observed but are quite hard to detect (Figure 7 label 3). Most of the time, they appear to be propagations of microcracks in the defects zone which can be present in the matrix (inclusions and porosities). These microcracks can cause interfacial debonding that appears close to an interface zone (interface between the composite grains). In this zone, friction between grains may also appears and causes delamination defects. These defects can give rise to complex defects related to fibers such as broken fibers, peeled fibers and torn fibers (Figure 7 label 4). Also, pulled-out fibers are observed. SEM observations of different failure profiles of unrecycled and recycled composite: a) CR0, b) CR1, c) CR2, d) CR3, e) CR4 and f) CR5.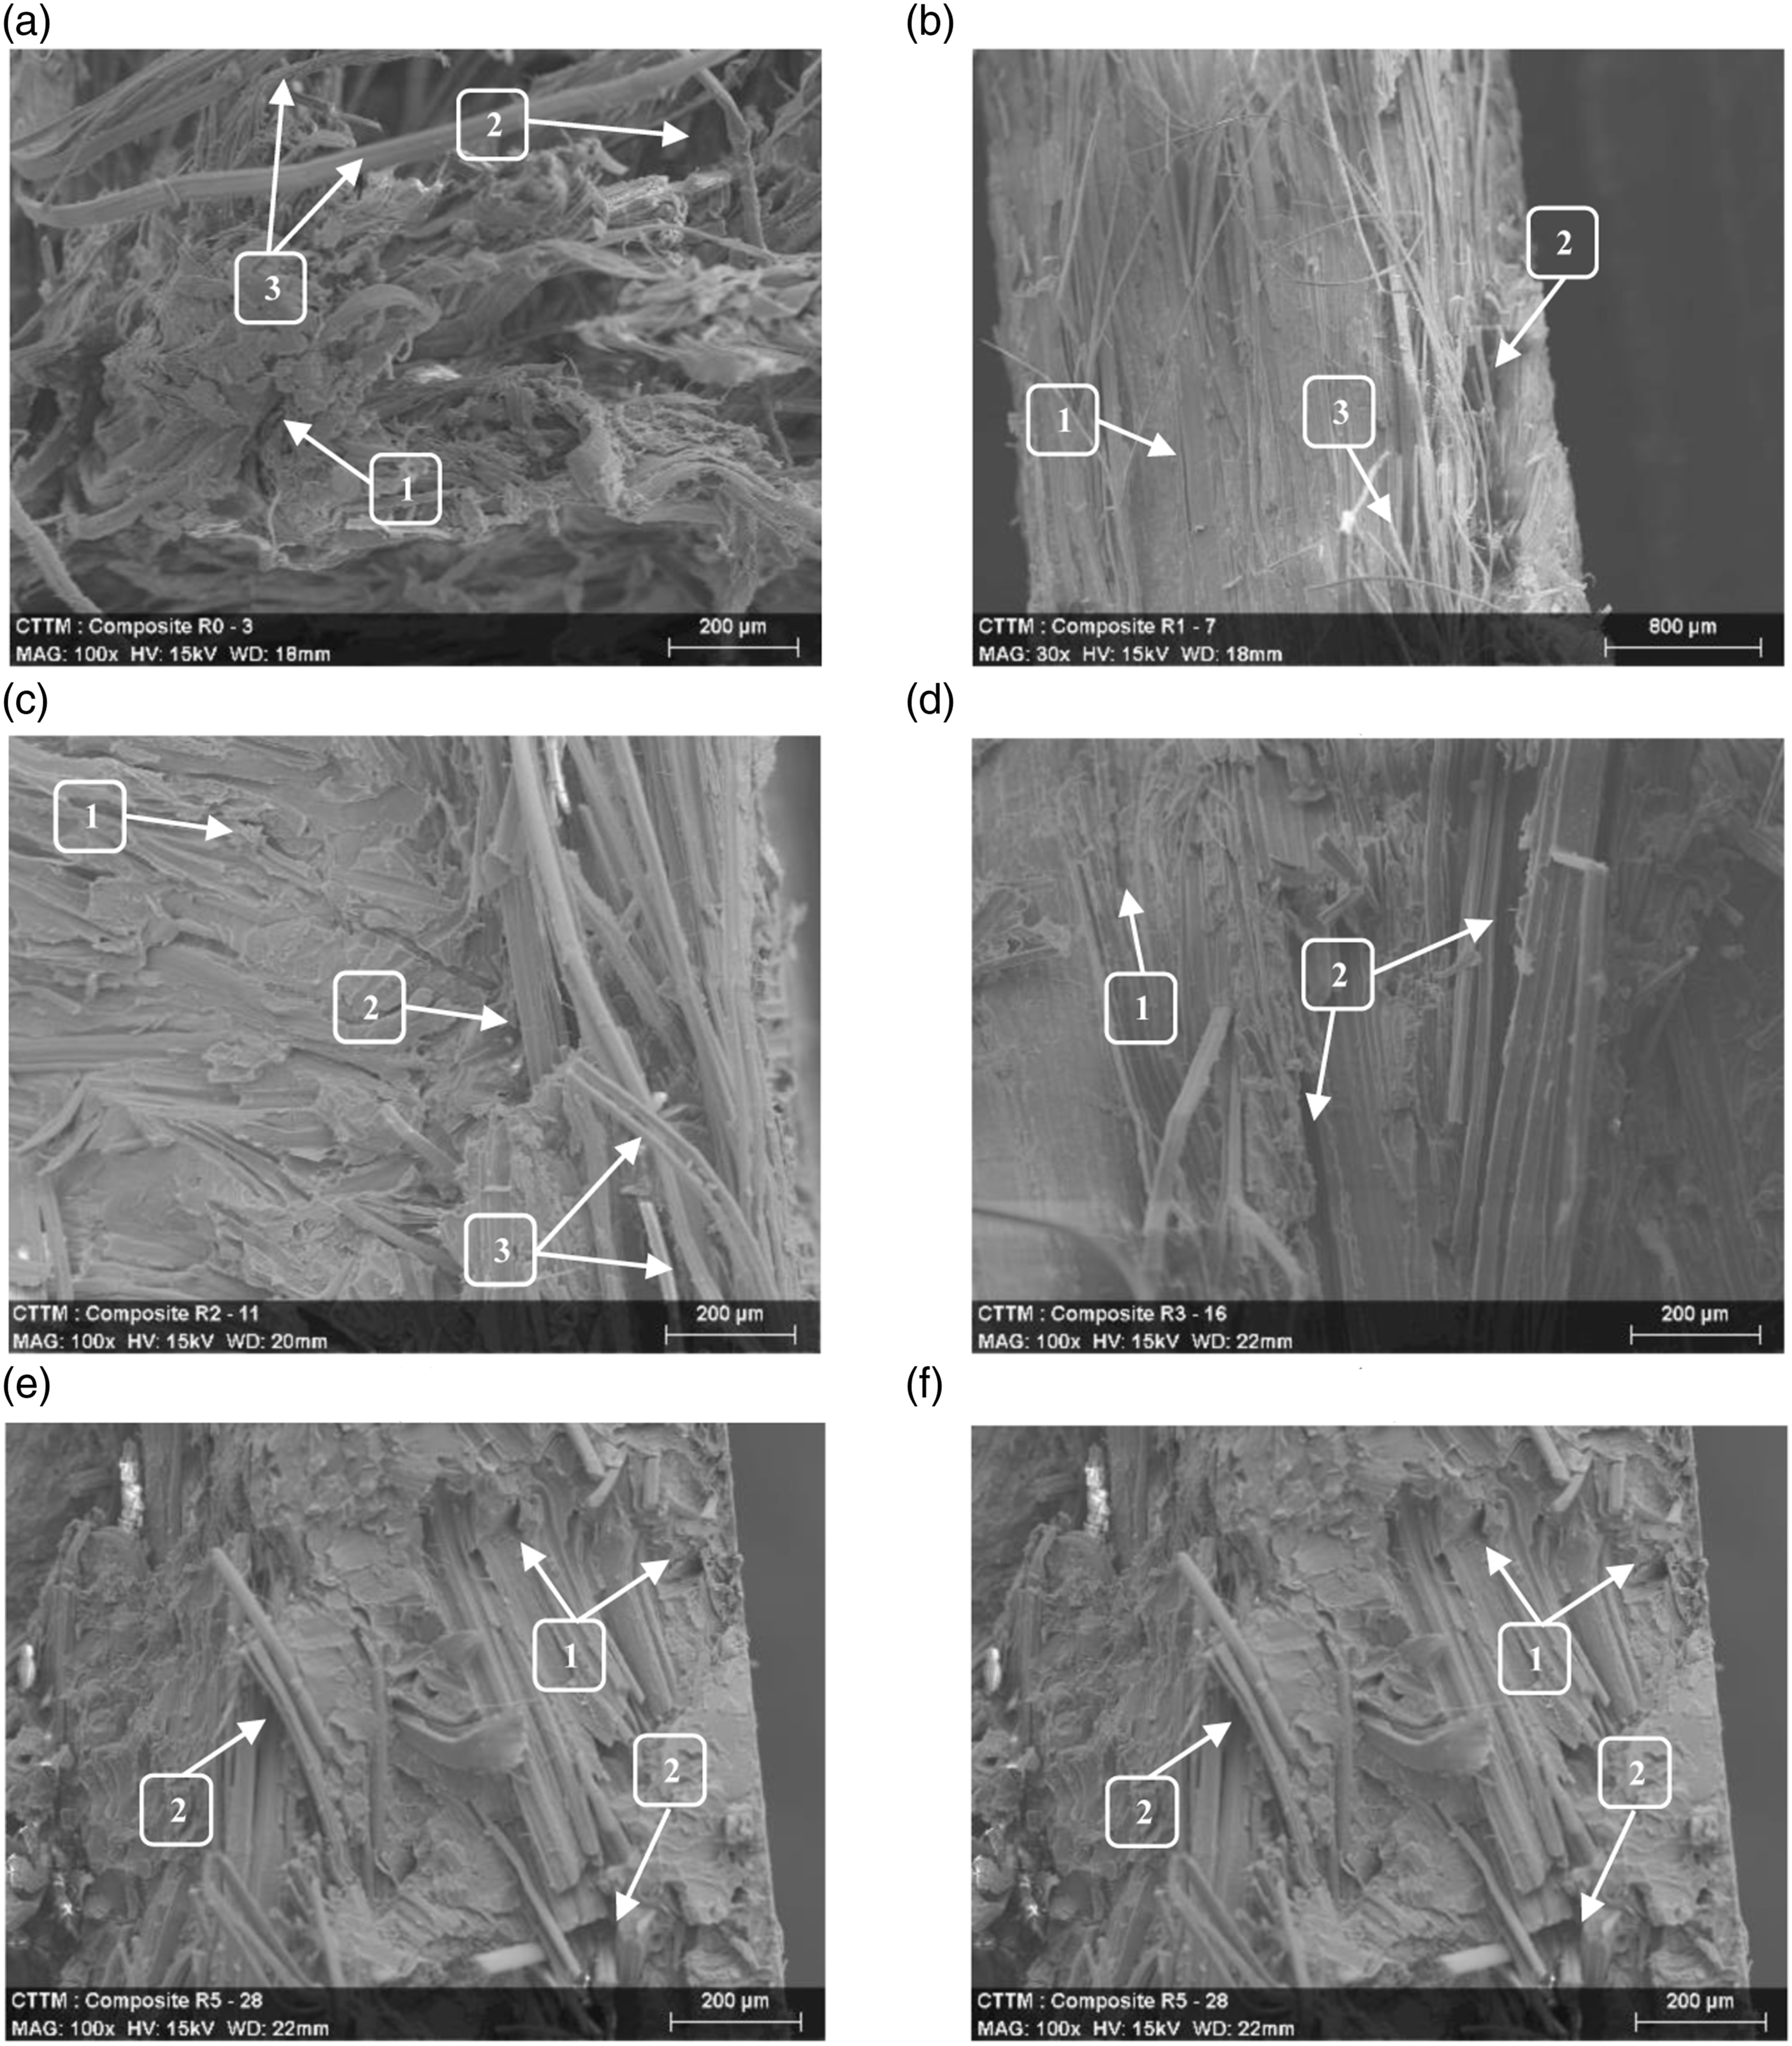
AE classification results
Static tensile tests
The processing of data signals detected using the K-mean algorithm
27
returned the following results: three classes are obtained for CR0, CR1, CR2 specimens, whereas only two classes are observed for CR3, CR4, and CR5 specimens. Figure 8(a) presents the amplitude property of the time-based AE events, superposed with the evolution of the applied load. AE classification and analysis results for recycled composites: a) Amplitude of the events and stress versus time, b) chronology of appearance of different classes and c) Absolute energy and d) PCA visualization.
Results show that the acoustic activity and the evolution of the loading take place in two phases. In the first one, which represents the short linear elastic phase, there are no recorded events. It shows that this loading has no effect on the specimen’s integrity. In the second phase, the slope of the stress curve begins to decrease slightly, reflecting the onset of viscoelastic behavior. A steady increase in acoustic activity characterizes this phase. The number of recorded events is about 6000, 1400, 1380, 446, 285, and 430 for the composites CR0, CR1, CR2, CR3, CR4, and CR5, respectively. The unrecycled composite CR0 involves the highest number of events.
The chronology and evolution of the acoustic events for each class according to time is presented in Figure 8(b). For all specimens, the cumulative number of hits presents a significant increase in every class just before failure. Figure 8(c) shows the AE cumulative energy (CU.ENE) versus time during. For all recycled specimen class B presents the highest cumulative energy. It increases obviously just before the total rupture of specimens. Compared to that of class B, signals of class A present negligible cumulative absolute energy. This is a good indication of the physical source that emits this type of signals. Generally, damage produced by the matrix is characterized by lower energy compared than that caused by the fibers. 21
Principal component analysis is also carried out to visualize the results in a two-dimensional subspace, as shown in Figure 8(d). That permits to define a suitable range in the first component (PCA1) values, in the understanding that this would be an easy and acceptably accurate way of classifying the data. 28 The representation shows a clearer partition of the events in the PCA1 versus PCA0 plots. Most of the patterns are concentrated into three classes for CR0, CR1, CR2 specimens. After three recycling process, the patterns are concentrated into only two classes.
The average properties of the classes of every specimen are compared, as well as their statistical spread. Figure 9 shows blocks and whiskers plots for the five chosen classification features with respect to the two AE classes for all recycled specimens. Statistical dispersion of the AE classes for every classification feature. a) Amplitude, b) absolute energy, c) duration, d) rise time and e) counts to peak.
The borders of the box correspond to the first quartile q1 and the third quartile q3. The median (second quartile q2) is the line cutting through the box. The whiskers indicate the lower and upper values located in the interval (q1 – 1.5 (q3 – q1), q3 + 1.5 (q3 – q1)). Values outside this interval, considered as outliers, are not printed. Results show that statistical characteristics of classes A and B are quite similar for unrecycled and recycled specimens and for every classification parameter. Class C, which only appears in CR0, CR1 and CR2 specimens, presents more differences between different materials and classification features. It is clear that the amplitude and the absolute energy decrease slightly with the increase in recycling operations. The duration, the number of counts to peak and the rise time present more diversity between specimens. These parameters are very sensitive to undesired concatenated signals which may not have been fully filtered by the timing acquisition parameters. Therefore, extreme values of undesired signals are probably responsible for this irregular dispersion. Also, the diversity of damage caused by the fibers can explain this dispersion. Broken fibers, peeled and torn fibers and fiber pull out are observed by the SEM. These damage types are characterized by the highest energy. So, class C, which presents the most energetic signals, is probably related to these damage mechanisms.
Figure 10 reports average values of the five selected features for unrecycled and recycled specimens. The radar chart shows clearly that acoustic signatures can be attributed to each class. Despite the differences noticed previously regarding their statistical dispersion, average values of the amplitude, duration, rise time and counts to peak for each specimen are very similar. However, the average absolute energy presents a significant decrease as a function of recycling operations. Average properties of AE classes for the five recycled specimen and according to the five selected features.
Classification results show that classes A and B appear simultaneously in the damage chronology for all specimens. Signals of class A are relatively similar for the unrecycled and recycled materials regarding the five temporal descriptors. The acoustic waves are characterized by waveforms with slow rise time, low amplitude, and low energy. The amplitude, in particular, is in the range of (40–55 dB) which can be related to the mechanisms of matrix micro-cracking. The signals in class B present higher amplitude, higher energy, and higher rise times but shorter duration. However, a considerable difference in the amplitude range is noticed. It is between (50–70 dB), (45–70 dB), (45–60 dB), (50–70 dB), (45–60 dB), (45–65 dB) for the specimens CR0, CR1, CR2, CR3, CR4, and CR5, respectively. This second class includes all damage related to debonding mechanisms which appear at the fiber-matrix interface as well as at the interface between composite grains. According to the literature, 46 interface debonding usually causes acoustic emission events with amplitudes higher than those of matrix cracking. Furthermore, signals of class B presents higher energies, but also shorter durations and higher rise times. Thus, class B can be attributed to interface debonding mechanisms. 29 Beyond this yield point during monotonic tensile loading and before the full failure of CR0, CR1, and CR2 specimens, events of class C are observed. In this group, the waveforms present the highest amplitude, short rise time, short duration, and greater energy compared to classes A and B. The amplitude is between 60 to 85 dB for all specimens. Also, events in these groups have short rise time, short duration and greater energy. Thus, class C probably contains all complex failure mechanisms appearing at the fiber scale such as fiber pull out, peeled, torn, and broken fibers. The appearance of these damage mechanisms announces imminent specimen rupture. Class C does not exist for specimen CR3, CR4, and CR5. In fact, this can be explained by the multiple cutting of composite waste required at each recycling operation, which makes flax fibers shorter in repeated recycling operations. This step eliminates the effect of fibers on the propagation of damage mechanisms.
Fatigue tensile tests
Damage monitoring using AE is also applied during fatigue tests until specimen’s failure. It has been shown that this method provides valuable and useful parameter and effective failure criteria for fatigue life prediction.
47
Results are recorded for the evolution in the amplitude and number of vector hits according to the number of cycles (Figure 11). Referring to the identification developed in the static tests, results reveal a first class “A” related to matrix micro-cracking with a high number of events, a second class “B” which includes damage caused by interface debonding then a third one “C” corresponding to damage mechanisms at fiber scale. This class does not exist in the CR3, CR4, and CR5 composites. AE classification and analysis results for recycled composites under fatigue tests: a) Amplitude of the events and stress versus time and b) chronology of appearance of different classes.
For the unrecycled composite CR0, it is obvious that all damage mechanisms appear from the first fatigue cycles with a high rate of acoustic activity. However, most of these activities correspond to the initiation and multiplication of micro-cracks and interface debonding. Unlike in static tensile tests, class C appears from the first stage with a lower cumulative number of hits. However, unlike CR0 specimens, class C does not appear from the first fatigue cycles in the CR1 and CR2 specimens. We can also note that there is a slight decrease in the amplitude of acoustic events for each detect class, with repeated recycling operations. Class A and class B are also detected in specimens CR3, CR4, and CR5. It is noted that these acoustic classes are well separated in the CR3 composite regarding the distribution of amplitude. However, domain overlaps of acoustic class are observed in the CR4 and CR5 composites. Figure 11(b) illustrates the evolution of the cumulative number of vector hits versus time for the different composites tested. These plots give us an idea about chronology and amount of each detected damage mechanism throughout the fatigue test. Results show that hits caused by matrix cracking are more numerous than hits coming from other mechanisms. Interface debonding is less common. Damage at the fiber scale present the lowest acoustic activity during fatigue cycles and increase slightly just before fracture.
The identification of the acoustic classes proposed in our study can be justified by work carried out at the LAUM laboratory by Monti et al. 21 and Haggui et al. 48 and also by works in the literature such as those of Bravo et al., 46 and Aslan et al. 49 on the acoustic properties of the main damage mechanisms detected in composites reinforced with natural flax fibers.
Conclusion
The present work has studied the recyclability of an innovative thermoplastic-based composite. Static and fatigue tensile tests associated with acoustic emissions are performed. The main effect of recycling is a rise in the elastic modulus, which is attributed to an increase in the crystallinity rate of the polymer. However, the failure properties and the lifetime of composite studied undergo a decrease with repeated recycling. This deterioration is attributed to the multiple cutting steps of composite waste into small grains which result in a reduction in the fiber size and a decrease in the failure properties. In addition, during multiple recycling processes, polymer chain rupture and deterioration of the fiber-matrix interface contribute widely to the loss of failure properties. Results of the AE technique show three damage mechanism in specimens CR0, CR1, and CR2 whereas only two classes are observed for materials CR3, CR4, and CR5. The damage mechanisms considered according to the collected AE signals and SEM observation are matrix micro-cracking ‘‘class A,’’ interfacial debonding ‘‘class B’’ and damage at the fiber scale “class C” (fiber pull out, peeled and torn fibers, and broken fibers).
Footnotes
Acknowledgments
The authors would like to thank Peter BURGESS English lecturer (Le Mans University) for proofreading and correcting the article.
Declaration of conflicting interests
The author(s) declared no potential conflicts of interest with respect to the research, authorship, and/or publication of this article.
Funding
The author(s) received no financial support for the research, authorship, and/or publication of this article.