
Abstract
The multifunctional novolac epoxy/Al2O3 nanocomposites were fabricated by high-speed mechanical mixing of epoxy resin with varying concentration of nano Al2O3 (0–5 wt%) of particle size 13 nm for 30 min, followed by curing with triethylenetetramine (TETA) at 110°C for 1 h and post-curing at 80°C for 5 h. The fabricated nanocomposite samples were characterized for mechanical properties (viz., tensile strength, elongation-at-break, impact strength, toughness, and hardness shore D), thermal stability, and fire retardancy. It was observed that the 3 wt% nano-Al2O3 containing sample showed significant enhancement in the tensile strength, elongation-at-break, impact strength, hardness shore D, thermal stability, and fire retardancy compared to the neat epoxy sample. The Differential Scanning calorimetry (DSC) confirmed the 3-D curing reaction between TETA and nano-alumina modified epoxy and neat epoxy samples. The reactivity effect of alumina towards resin was investigated by Fourier Transform Infrared (FTIR) spectroscopy. The morphological studies of nanocomposite samples were investigated by Scanning Electron Microscopy (SEM) to justify the enhancement of mechanical properties via dispersion of nanoparticles.
Introduction
Nowadays nanotechnology is a fast-growing area for current research and development in all fields. Nanotechnology has a graceful impact on industrial and engineering applications in terms of polymer nanocomposites (PNCs). The PNCs are multiphase systems, which consist of polymers (thermoplastics, thermosets, and elastomers) and nanofillers (particle size less than 100 nm). 1 Among the thermosetting polymer, the multifunctional epoxy resins are the most widely used in various applications such as adhesives, coatings, flooring, electrical and electronic applications, aerospace, and marine products due to excellent mechanical and thermal properties.2,3 In contrast, the cured epoxy resin has brittleness and cracks initiation and propagation characteristics due to high cross-link density, and restricting many engineering applications.4,5 This problem of the cured resin can be redressed by using rigid inorganic nanofillers (viz. SiO2, TiO2, ZnO, CaCO3, Al2O3, and clay) in a small amount (i.e., > 10 wt %). The nanofillers can lock the cracks and enhance mechanical properties and thermal stability under load. 6 Among these nanofillers, the nano-alumina has a significant effect on the mechanical and thermal properties of PNCs. It is a well-known ceramic material with low cost, non-toxic, stable, inert, high hardness, high corrosion, and high-temperature resistance7,8
The mechanical properties of PNCs depend on several factors like dispersion parameters (i.e., time, temperature, and speed), morphology, shape, size, dispersion techniques, chemical structure, and amount of nanofiller, and the interaction between the nanoparticles and matrix.9,10 Out of these factors, the dispersion and interaction of nanofiller play a vital role in achieving the desired mechanical and thermal properties. The expected dispersion orientation of nanoparticles in the matrix has been shown in Figure 1. Both the properties can be enhanced if the interaction between the nanoparticles and polymeric chains is higher than the particle-particle interaction.
11
The reverse action leads to the localization of nanoparticles, resulting in incompatibility with the matrix owing to poor mechanical and thermal properties due to the electrostatic forces and stress concentration.
12
The clustering of nanoparticles can be reduced by the high-speed and prolonged mixing of nanofiller with the resin. This action reduces the gaps and increases the degree of interaction between the nanoparticles and the polymeric chains, which might be enhanced the hydrogen bonding between the phases and led to improve the mechanical and thermal properties. Another factor, which influences the mechanical and thermal properties of PNCs is the particle size of the nanofiller. That is, smaller the particle size, the larger will be the surface area, leading to better dispersion within the macromolecules and showed improved mechanical and thermal properties.13–15 Many researchers have been investigated the mechanical and thermal properties of PNCs by using different matrices and nanofillers. Ahmad et al.
16
had used different shapes of nanoparticles of SiO2 rather than using fumed SiO2 and reported that the higher vol % of nanoparticles produce higher Young’s modulus and stress. They also observed the significant enhancement with the elongated SiO2 nanoparticles to the angular and cubical silica. Zamanianet et al.
17
reported that the improvement was remarkable in Young’s modulus when the smaller size of nanoparticles was used in the nanocomposites. The effect of particle weight fraction on two different kinds of polymer matrices was investigated by Tsai et al.
18
and found that the tensile stress was increased with increasing weight fractions of the nanoparticle in the case of ductile epoxy/silica nanocomposites. Whereas the stress increased up to the level of 20 wt% nanofiller in the case of brittle one. Polyester-based composites filled with various contents of alumina (Al2O3) (i.e., 0–10 vol%) have been fabricated by Fahamsyah et al.
19
They investigated the composite for physical and mechanical properties. They found the tensile strength, stiffness, and hardness of the composites increased with increased alumina content, while the strain-at-break of the composites decreased. The best results of all these properties were found in the 5 wt% nano-alumina added sample. Dispersion orientation of nanoparticles within the epoxy matrix.
The nanocomposites of unsaturated polyester resin (UPR) and nano-CaCO3 particles, prepared and characterized by Bhaskaran et al. 20 They found the mechanical properties of UPR/CaCO3 nanocomposites are greater than those of neat resin up to 5 wt% loadings of nano-CaCO3, while the tensile strength, flexural strength, and impact strengths were enhanced slightly. The effects of nanofillers (CB, SiO2, and MWCNTs) on the mechanical and thermal properties of the neat epoxy matrix were studied by Raji et al. 21 They reported a significant improvement in tensile strength, glass transition temperature, and decomposition temperature by the addition 2 wt% of MWCNTs compared to other nanocomposites (with CB and SiO2) and neat epoxy. The adhesion strength between the organic epoxy matrix and the nano-alumina in the hybrid system was invested by Juliana et al. 22 The enhancement in the adhesion strength was tested by dynamic mechanical analysis (DMA) and thermal stability by TGA. They found the nanofiller improved the thermal resistance of the neat epoxy and the adhesion between the nanoparticles and matrix, whereas the size of the nanoparticles also influenced the physical–thermal properties. Carlos V. O. et al. 23 reported that the 0.05 wt% nano-alumina or CNT modified epoxy nanocomposite showed the maximum tensile strength (with an increment of 17% in elastic modulus and 22% ultimate stress). The improvement mechanism in the stiffness and the fracture toughness and nanostructure was justified by TEM and SEM images. Noorhafanita et al. 24 prepared the graphene oxide (GO)/epoxy nanocomposite and reported that GO significantly enhanced the mechanical properties of the nanocomposites. A slight improvement in the impact strength with 0.1 wt% of GO was found compared to the neat epoxy sample.
This study aimed to eliminate the known limitations of the neat novolac epoxy matrix by preparing the nanocomposites using nano-alumina filler. The mixture was prepared by high-speed mechanical mixing of novolac epoxy resin and varying weight fraction of nano Al2O3 and subsequent curing with suitable curing agent. Further, curing and post-curing were carried out in an air oven. The prepared nanocomposite samples were characterized for mechanical properties (viz. tensile strength, elongation-at-break, impact strength, toughness, and hardness shore D), thermal stability, and fire retardancy. The curing behavior, FTIR spectroscopic studies, and morphological properties were also investigated.
Experimental
Materials
The novolac epoxy resin (Grade Lapox L238) of epoxide equivalent weight (EEW) of 180 g/eq and viscosity range 20000–50000 (mPa.s) at 27 °C and the curing agent triethylenetetramine (TETA) with amine value 1400–1600 mg KOH/g and density value 978 kg/m3 were procured from Atul Ltd, Gujarat, India. The Nano-Al2O3 was purchased from Degussa AG, Germany. The average particle size and the specific surface area of nano-Al2O3 were 13 nm and 85–115 m2/g, respectively. The high-temperature performance silicon grease was used as a mold release agent, procured from M. R. Industries, Mumbai, India. All the materials were used as received.
Preparation of nanocomposites
Sample designation of prepared samples.

Characterization of nanocomposites
Fourier transform infrared (FTIR) spectroscopy
The FTIR spectroscopy of neat and nanofiller filled epoxy samples (uncured and cured samples) were performed on Perkin Elmer Spectrum Version 10.4.00 at room temperature using the KBr and NaCl beads. The FTIR spectra were test recorded between the wavenumber 400-4000 cm−1. Before the test is conducted, the background spectrum must be taken from the empty chamber to eliminate moisture and the CO2 present in the test chamber.
Curing studies
The freshly prepared samples obtained by mixing a stoichiometric amount of triethylene tetramine (TETA) curing agent and multifunctional novolac epoxy resin (neat and nano-CaCO3 mixed) were used for the recording of DSC thermogram traces for curing studies. The curing process was performed by using DSC Q200 (M/s T A Instruments, USA). The study was focused on kick-off temperature (To - where first detectable heat of curing was observed), peak temperature (Tp- where maximum heat was released), and heat of curing (ΔH- area under the exotherm curve). The temperature range was taken from 25–250°C with a heating rate of 10°C min−1 in the nitrogen atmosphere.
Mechanical properties
Tensile strength and elongation-at-break
The dumb-bell shaped nanocomposite samples were used to determine the tensile strength and elongation-at-break as per ASTM D 638, using a Universal Testing Machine (UTM) (Zwick Roell Pvt. Ltd. Germany, model Z010 M) with the crosshead speed of 25 mm/min. Tensile strength and elongation-at-break values were automatically recorded on the computer system.
Impact strength and toughness
The test specimens were fabricated as per ASTM standard D-256. The size of the specimen sample is 2.5 x 0.5 x (1/8) inches with a recommended notch depth of 0.100 inches. The test specimen was clamped onto the impact testing machine (CEAST® Resil Impactor, Model 6957, Germany) in a position such that the notched face of the sample is towards the striking edge of the pendulum. Now, the hammer is released, allowed to hit the sample and swing through. If the sample does not break, add more weights to the hammer and repeat it until failure occurs. The impact value was read from the dial attached to the tester.
Hardness shore D
The hardness of prepared nanocomposite samples was measured using the Shore D hardness tester (called Duromerter) with shore hardness gauge, compiled with Din 53505 ISO868 and ASTM D 2240 (Hiroshima instruments, Japan; model No.:TH210). The determination of hardness is based on the force applied to the sample continuously without shock and measured the depth of indentation on the samples’ surface. The values of hardness were read directly from the dial attached to the tester.
Thermal stability
The thermal stability of all nanocomposite samples was studied by using the Thermo Gravimetric Analyzer (TGA) (Perkin Elmer, USA; Model: Pyris1) with 10°C min−1 heating rate in a nitrogen atmosphere and water circulation rate 10 mL min−1 was maintained for heat transfer. A pre-weighed sample was placed into the sample holder attached to the thermal balance of the instrument. The weight loss of the sample was recorded with respect to the temperature. The weight loss of the samples was noted after 5% weight loss at the initial stage, the temperature corresponding to this stage is known as initial degradation temperature (T5%), where the impurities and moisture present in the samples decomposed first. The temperature, where 50% of the sample was decomposed, denoted by T50%, and the temperature where the decomposition of the sample was completed, shown by Tf. The residue that remained after complete decomposition of the sample was known as char yield % and represented by CY (%). The samples were exposed to temperature from ambient to 800°C.
Morphological properties
The morphological characterization of nanocomposite samples was carried out by the high resolution and low vacuum SEM equipment (Carl Zeiss EVO 50X VP, England) with accelerating voltages 1–40 keV to analyze the microstructure and fracture surfaces of nanocomposite samples. Before the test, samples were coated with gold vapors and mounted on aluminum stubs.
Results and discussions
Infrared spectroscopic studies
The FTIR spectra of uncured EPA-0 and EPA-1, and cured EPA-1 samples have been shown in Figure 2(a–c). The characteristic band at around 3350 cm−1 was due to the phenolic hydroxyl groups (–OH) (though the matrix alone does not have –OH groups, it may be from the unreacted trace of phenol that remained during the manufacturing of the resin).
25
The peak near the wavenumber 1032 cm−1 and 1229 cm−1 were due to the epoxide group stretching attached at repeat units. The band near 913 cm−1 was due to the ring deformation of terminal epoxide groups in the neat resin matrix. Upon mixing of 1 wt% nano-alumina in the resin (uncured EPA-1 sample), The FTIR spectrum showed similar characteristic peaks as it was in the neat epoxy (EPA-0 sample). It revealed that the nano-alumina was non-reactive towards the resin and remained physically blended in the composite samples. The nano-alumina also has the hydroxyl groups attached to the surface due to the moisture trap, contributing to the peak’s broadening near the 3350 cm−1 wavenumber. These hydroxyl groups led to hydrogen bonding with the epoxide groups of matrix.
26
During the curing reaction between the primary amine and resin, primary amine turns to secondary and finally to tertiary amine. This conversion led to increase the concentration of hydroxyl groups (–OH). The broadening of the peak near the band 3350 cm−1 confirmed the increase the number of –OH groups evaluated in each conversion, as shown in Figure 2(c). The broadening of this characteristic peak might also be due to the hydrogen bonding between –OH groups present on the surface of alumina and epoxide linkage. The appearance of the peak at 454 cm−1 of cured EPA-1 sample was related to Al-O formation, resulting from the reaction between hydroxyl groups on the surface of alumina particles and epoxide rings of resin.
27
The absence of the epoxide peak near the band 913 cm−1 (Figure 2(c), shown in circle) indicated the curing reaction between the epoxy resin and curing agent (TETA). FTIR Spectra of Samples (a) uncured EPA-0 (b) uncured EPA-1 and, (c) cured EPA-1.
Curing studies
The DSC thermogram of neat epoxy and nano-alumina added nanocomposite samples cured with TETA, tested under nitrogen atmosphere with the heating rate 10 °C/min, are shown in Figure 3. The data relating to kick-off temperature (To), peak temperature (Tp), and heat of curing (ΔH) are given in Table 2. The figure and table indicated that upon adding nano-alumina in the matrix, the Tp shifted to the lower temperature from 128 °C to 122 °C. The To value increased from 66.40 °C to 86.76 °C and found maximum in 3 wt% nano-alumina containing sample (i.e., EPA-3 sample). The total heat of the curing reaction (ΔH) was reduced from 145 J/g to 97.26 J/g. The lowest value of ΔH was observed in the EPA-3 sample. The decreasing trend in Tp values might be due to the catalytic effect of alumina, which started the curing reaction and attained the peak temperature prior to neat resin.
28
In contrast, the increase in the To might be due to the higher heat accumulation by nanocomposite samples in the presence of nanoparticles, which absorb more heat than the neat matrix.
29
DSC scans of EPA-0, EPA-1, and EPA-3 samples. Data related to DSC scan analysis of samples.

The reduction in the total heat of the curing reaction upon increasing nanofiller content might be due to the inhibition of the molecular movement in the presence of nanoparticles. Beyond the 3 wt% addition of nanofiller in the matrix, the encapsulated aggregate of nanoparticles was observed, as shown in the SEM image (Figure 9(c)). Due to this, the heat energy was also spent in the movement of the polymeric chain. Therefore, higher values of To and total heat of curing (ΔH) were shown by the higher filler-loaded samples (EPA-4 and EPA-5).
Mechanical properties
Tensile strength and elongation–at–break
The effect of nano-alumina concentration on tensile strength and elongation-at-break of cured novolac epoxy resin has been shown in Figure 4. The tensile strength of the samples (EPA-0 to EPA-5) was found to be 83.39, 143.12, 162.45, 201.50, 196.25, and 165.10 MPa, and the elongation was found to be 2.70, 2.94, 2.99, 3.00, 2.87, and 2.80%, respectively. The figure illustrated that the tensile strength and elongation-at-break were found maximum in the EPA-3 sample. The percentage increment in tensile strength and elongation-at-break was found 141% and 11%, compared to the neat epoxy matrix. The enhancement in the tensile strength and elongation-at-break might be due to the hydrogen bonding between the hydroxyl group present on the surface of alumina due to moisture regain and the epoxide group of the resin. Effect of nano-Al2O3 on tensile strength and elongation-at-break of samples.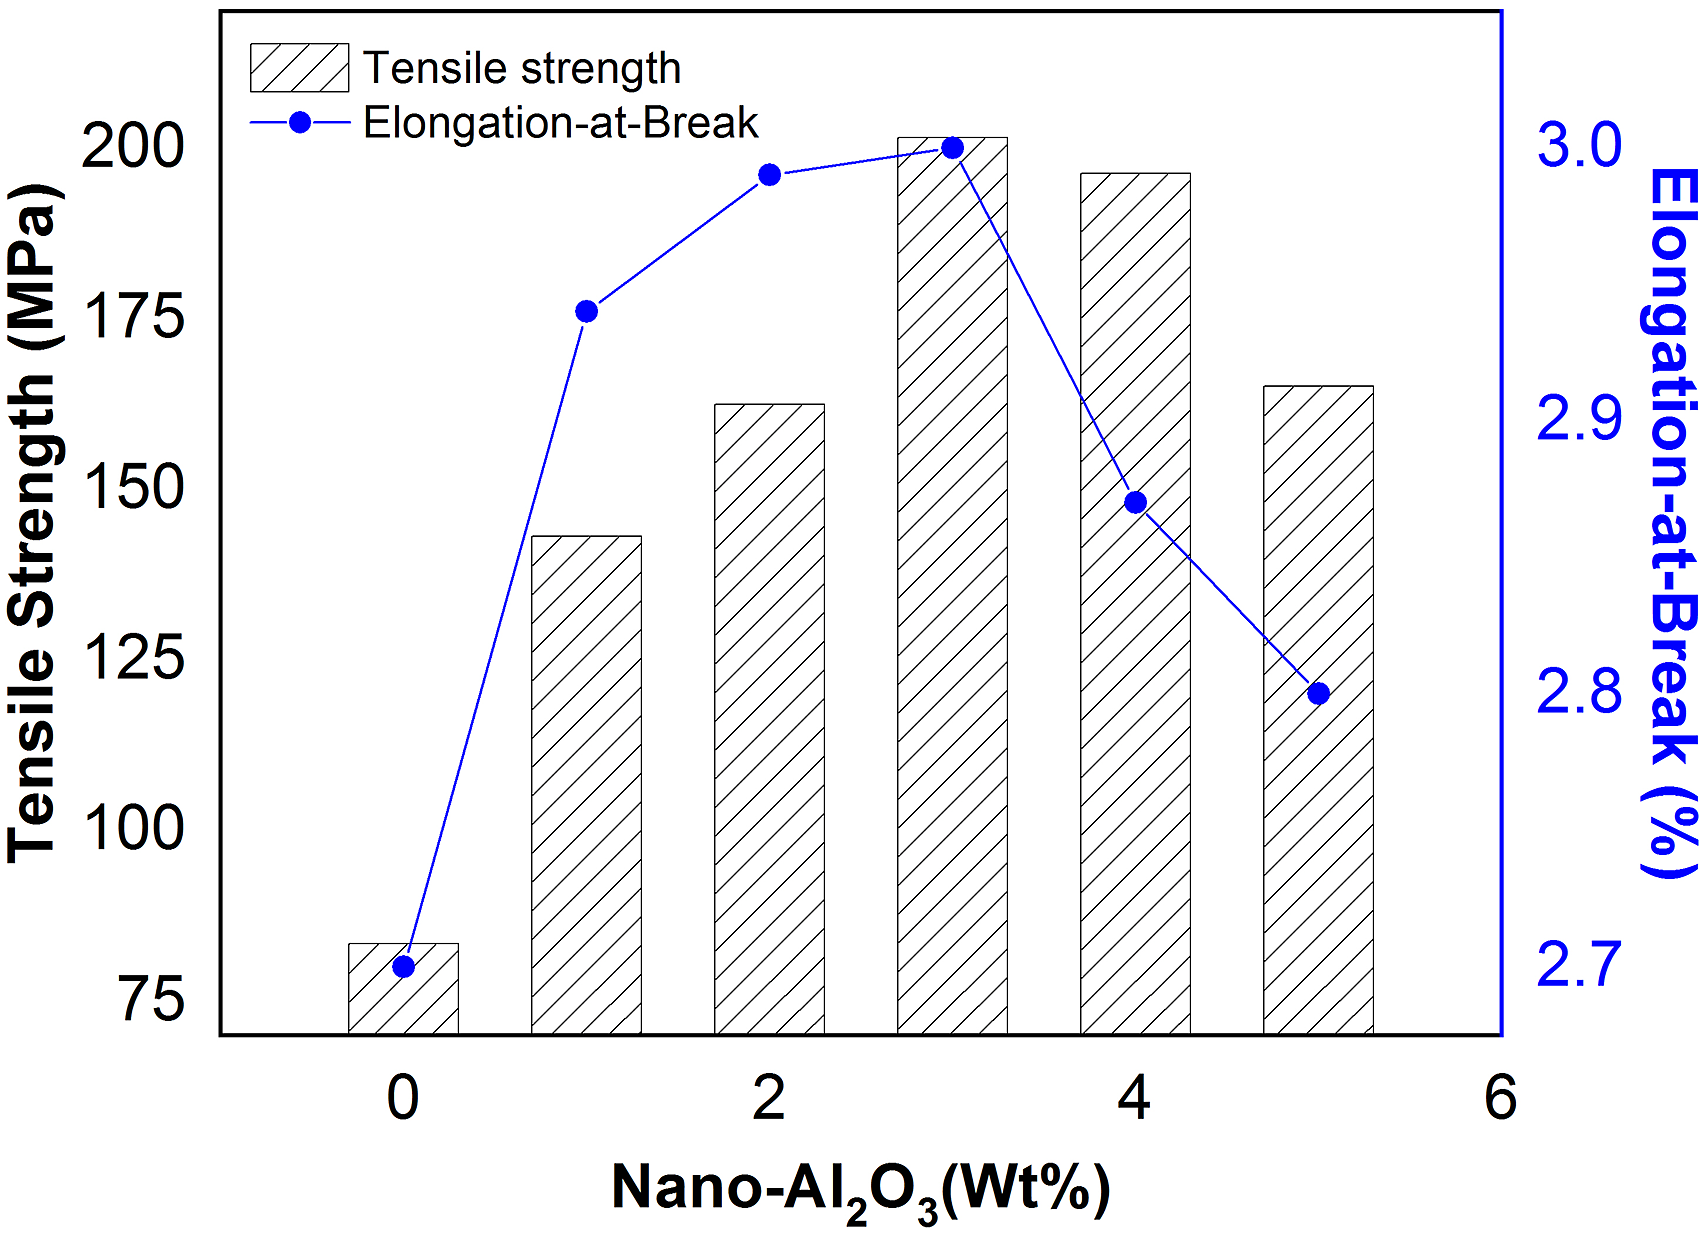
Additionally, the van der Waals forces also strengthen the bonding between the nanoparticulate and the polymeric chains. It can be concluded that the improvement in the tensile strength and elongation-at-break might be due to the load sharing by nanoparticles, and interaction forces via hydrogen bonding, and the van der Waals forces acting between the nanofiller and polymeric chains. Beyond 3 wt% addition of nano-alumina in the matrix, a decreasing trend in both the properties was found, might be due to the localization or aggregation of nanoparticles, which results in loose bonding between the filler and the matrix. 30
Impact strength and toughness
The effect of nano-alumina on the impact strength and toughness of neat epoxy and nanocomposite samples has been shown in Figure 5. The figure indicated that the impact strength and toughness were increased with an increased level of nano-Al2O3 in the epoxy matrix up to 3 wt%, in the EPA-3 sample. Beyond 3 wt% addition of nano Al2O3 in the matrix, both the properties were decreased. The impact strength and toughness of nanocomposite samples were increased from 1.94 KJ/m2 to 3.44 KJ/m2 and 0.117 Joule to 0.200 Joule, respectively. The improvement in the properties might be due to the more energy absorption under load in the rougher region of the nanocomposites developed after blending the nano-alumina in the matrix. It could be seen from the SEM investigation of samples, shown in Figure 9(c) and (d). The toughening behavior of nano-alumina also attributes the improvement of impact strength and toughness to a great extent. The loading beyond 3 wt% of nanofiller, the impact strength and toughness decreased, which might be due to the aggregation of nanoparticles, and caused the weak bonding between the nanofiller and matrix. The crack tip blunting by shear deformation near the crack in the presence of nano-Al2O3 was also observed. However, at a higher level of nano-Al2O3 loading, the matrix-particles interaction decreased and reduced the toughness values.
31
It can be concluded that the maximum improvement in impact strength and toughness was observed in the EPA-3 sample. Effect of nano-Al2O3 on impact strength and toughness of samples.
Hardness shore D (Durometer)
The effect of nanoparticles on the hardness shore D of nanocomposite samples with a different weight percentage of nano-Al2O3 has been shown in Figure 6. The figure indicates, the hardness shore D value increased with the increased level of nano-alumina up to 3 wt%. The increment was found from 41 to 71. The samples with the higher loading of nanoparticles showed higher resistance to the indentation force and higher hardness values than the neat epoxy matrix. This increment might be due to the inherent hardness of the Al2O3 particles, which influences the all-around hardness of the nanocomposite samples. But beyond 3 wt% loading of nano-alumina, the hardness value decreased due to nanofiller’s floccules. It showed the loose bonding between the nanoparticles and polymeric chains in the confined zones of the samples. The SEM images also illustrated the hardness variation in all the nanocomposite samples due to the nanoparticle dispersion within the matrix system. The uniform distribution of nanoparticles results in higher values of indentation (See Figure 9(c) and (d)). In contrast, the localized nanoparticles (shown in a circle in Figure 9(c)) due to the electrostatic forces lead to a low indentation value.
32
It could be concluded that the sample having a more uniform dispersion of nanofiller could have a higher degree of Shore D hardness than non-uniform dispersion. Effect of nano-Al2O3 on hardness shore D of samples.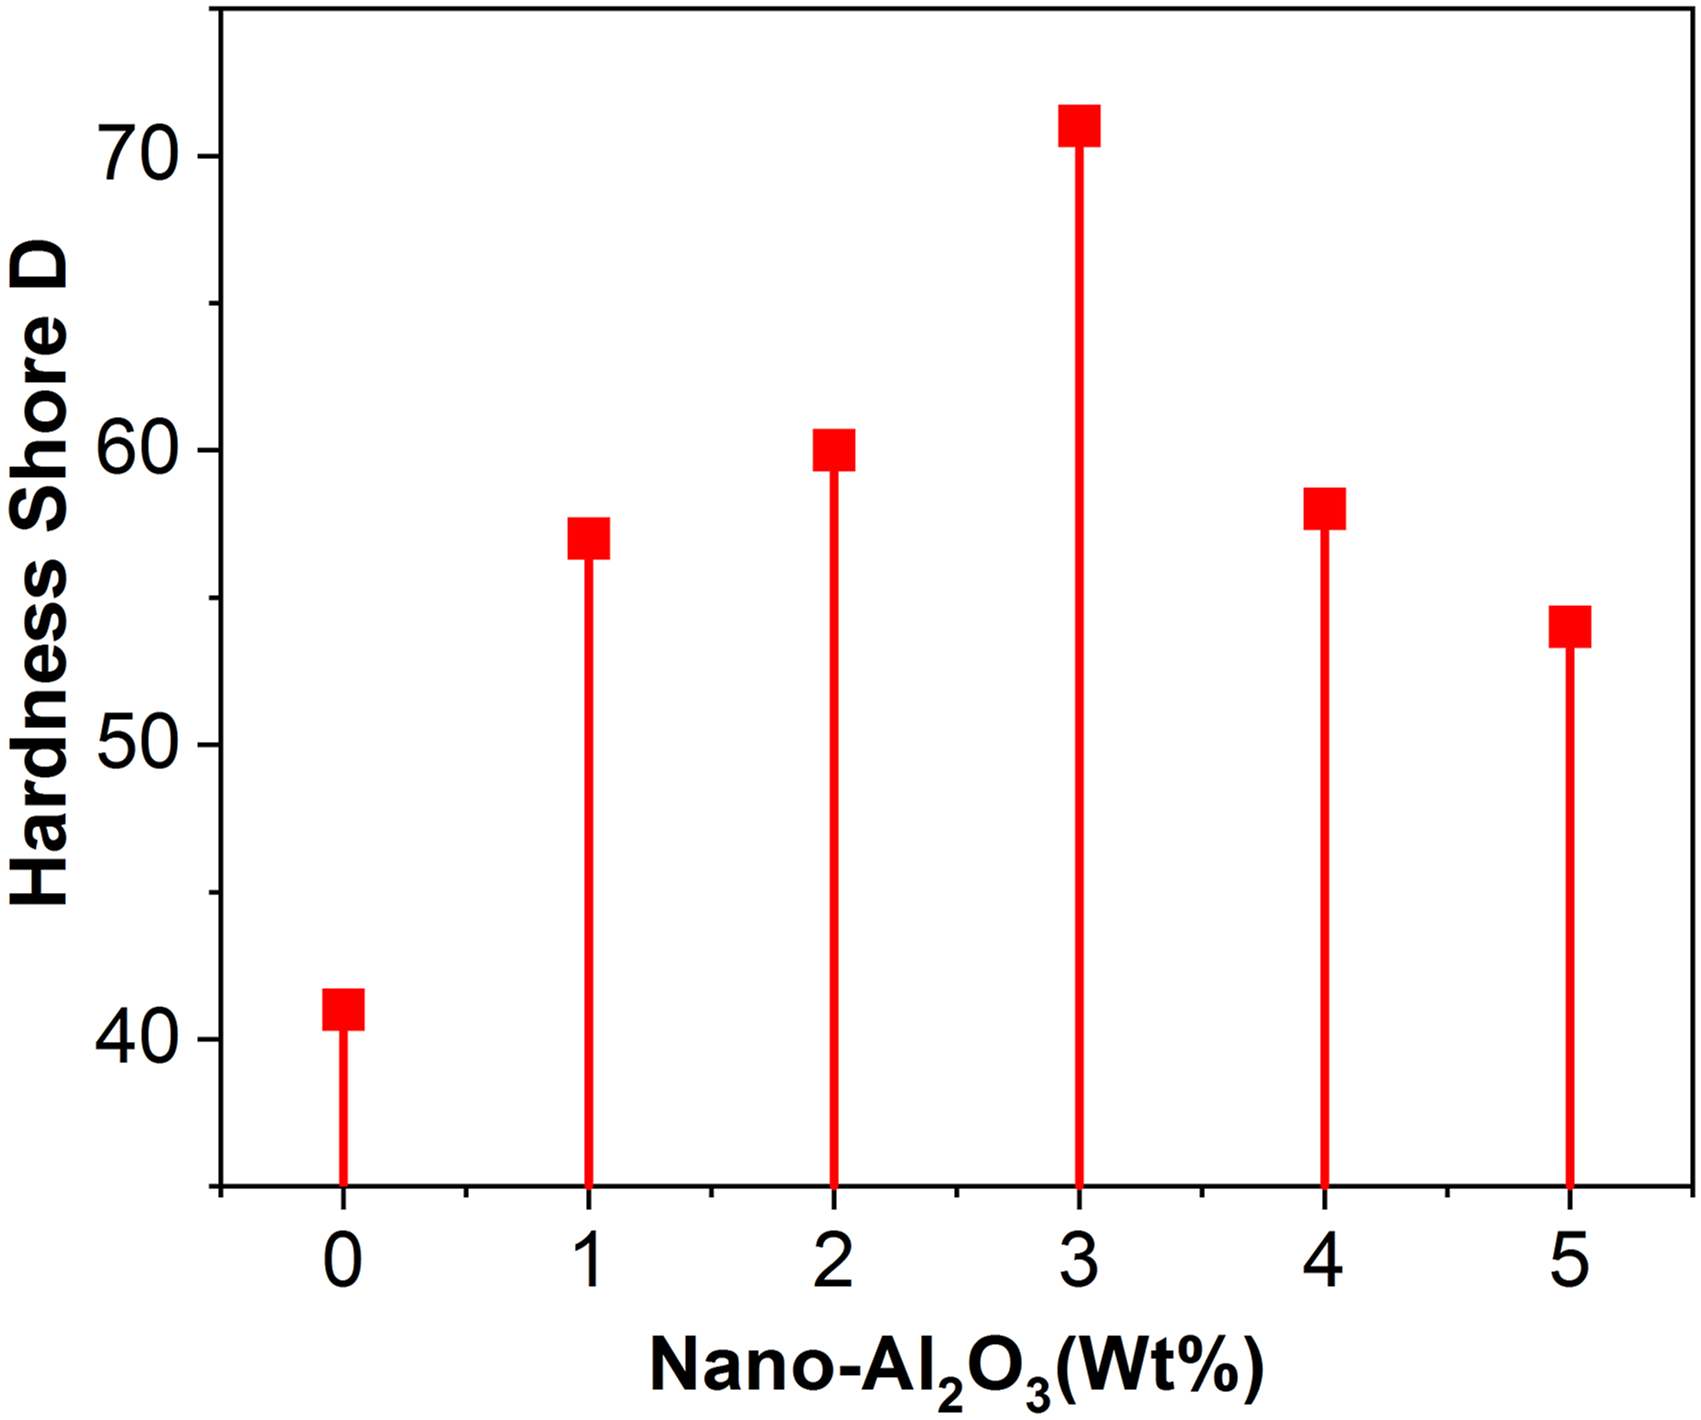
Thermal properties
Data related to TGA thermogram of samples.


TGA thermograms of EPA-0 to EPA-3 samples.
Consequently, the well-dispersed nanoparticles inhibited the diffusion of volatiles decomposition and enhanced the decomposition temperature. 34 Another possible reason for the enhancement of thermal stability of the composite system was the hindrance in the mobility of the polymeric chains that occurs due to the presence of nanoparticles during the decomposition. Therefore, the composite samples required more temperature to decompose than the neat matrix. 27 The hydrogen bonding between the phases might also be contributing to the enhancement of thermal stability. A significant increment of 26.14% in the char yield was found compared to the neat matrix. The increment in the CY reduces the production of combustible gases and exothermicity during the pyrolysis reaction and inhibits the thermal conductivity of the decomposing materials. 35 The enhancement in thermal stability might be increased the heat dissipation due to the increased surface area between nanoparticles and matrix chains. 36
Fire retardancy
The limited oxygen index (LOI) of neat epoxy and nanocomposites samples shown in Figure 8 and was calculated according to the Van Krevenel and Hoftyzer method
37
That is, Effect of nano-Al2O3 on LOI of samples.
LOI = 17.5 + 0.4 CR, where CR = Char yield (%)
Flammability of materials related to limiting oxygen index (LOI).

Morphological studies
Scanning electron microscopic analysis
The SEM images of the fractured surface of neat epoxy and nanocomposite samples (EPA-0, EPA-1, and EPA-3) obtained from the tensile strength investigation have been shown in Figure 9(a–d). The figures demonstrated that all nanocomposite samples showed a different degree of surface roughness, whereas the neat matrix sample (EPA-0) demonstrated a smooth surface. The smooth surface indicated more possibility to crack initiation and propagation in the EPA-0 sample. The maximum surface roughness (in the form of galleries) and the uniform dispersion of nanofiller were observed in the EPA-3 sample. The rougher surface resisted the cracks generation and propagation due to the pining and deflection of cracks and absorbed more fractured energy under load.
39
The cracks pinning and the cracks deflection phenomenon showed a higher value of impact strength and toughness in the nanocomposite samples than the neat matrix. Figure 9(c) showed the encapsulation of nanoparticles (indicated in the circle). The encapsulation of nanoparticles was developed due to the fine size (13 nm), high surface area, and high surface energy of the nanoparticles, and leading to the variable hardness value in the composite system. When the nano-alumina content exceeds 3 wt% in the matrix, the cluster formation of nanoparticles was observed in the form of encapsulation,
40
which leads to the weak bonding between the nanofiller and the matrix system. Therefore, more than 3 wt% nanofiller-containing samples showed decreased mechanical properties. SEM Image of samples (a) EPA-0 (b) EPA-1 (c) EPA-3 (d) EPA-3 (3X magnified).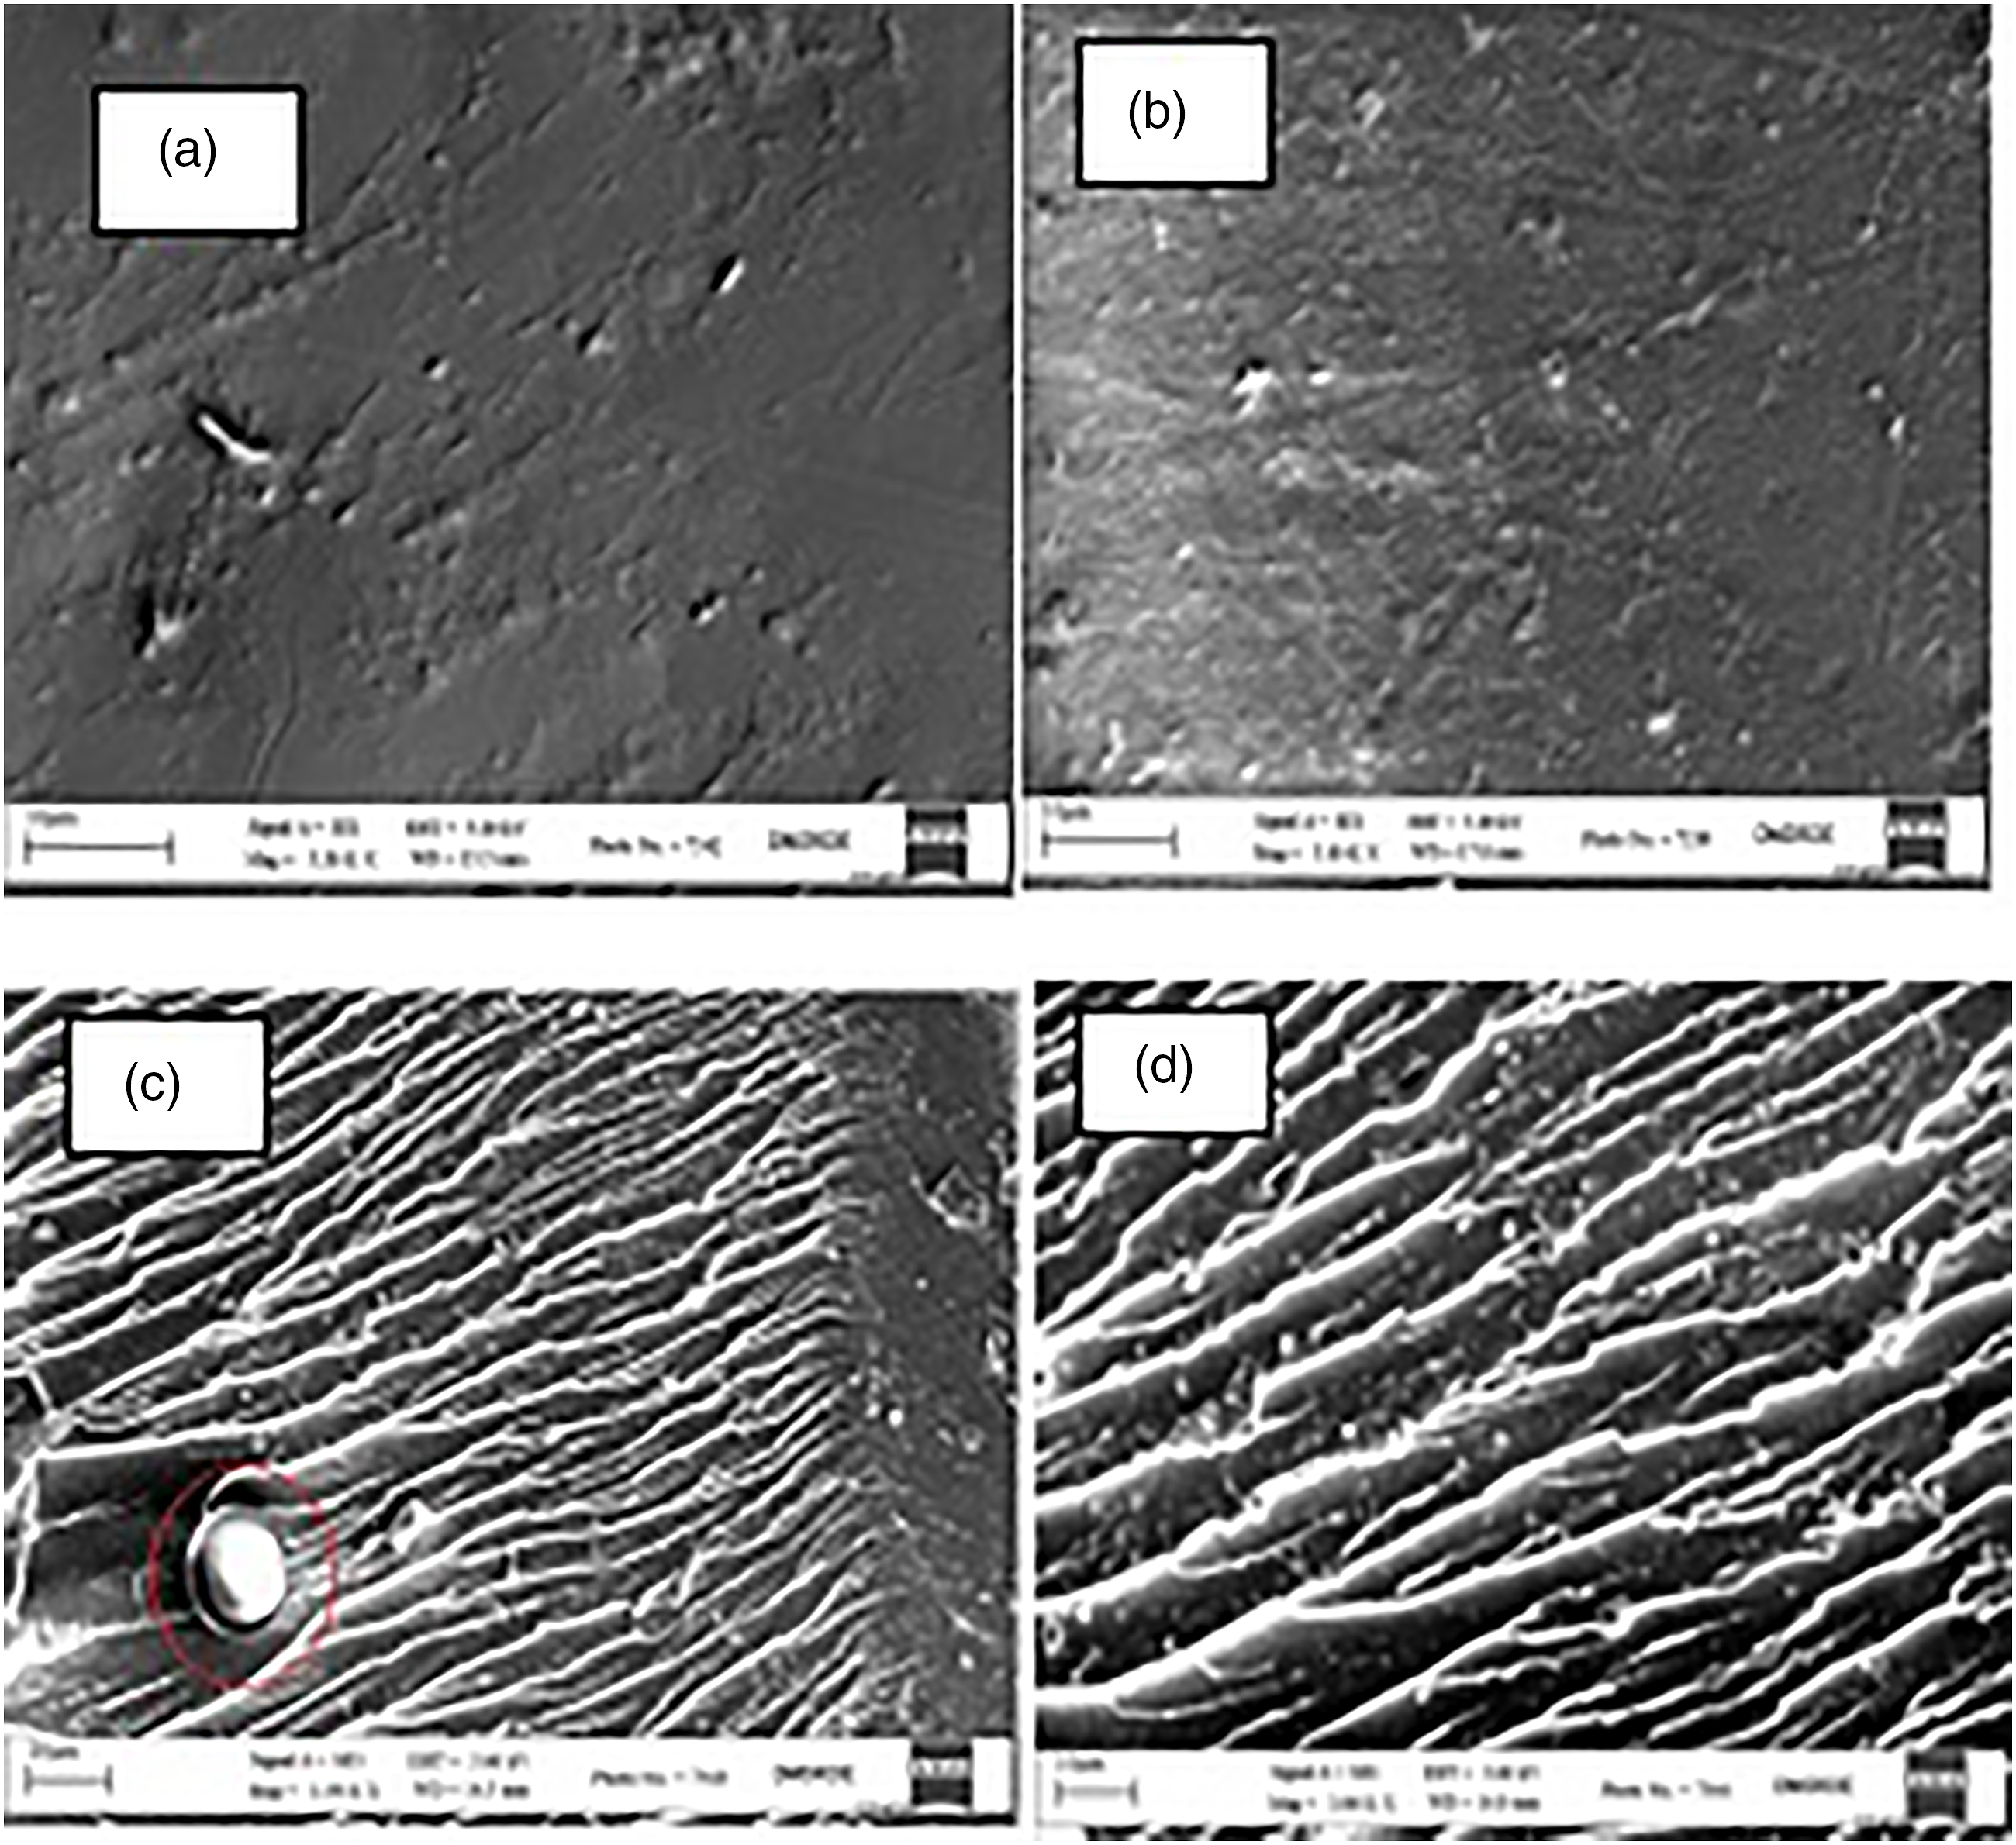
Conclusions
Based on the above results and discussions, the following conclusions are drawn— 1. All the investigated mechanical properties viz., the tensile strength, elongation-at-break, impact strength, toughness, and hardness shore D of nanocomposite samples increased as the concentration of nano-alumina increased in the epoxy matrix and found maximum in 3 wt% nano-alumina containing sample (EPA-3) and decreased thereafter. The improvement in the mechanical properties might be due to the uniform dispersion and load sharing, crack pinning, and crack deflection by nanoparticles, and the interaction between the nanofiller and matrix via hydrogen bonding, whereas the hardness shore D increased due to the inherent hardness of nanofiller, which led to the higher indentation values. 2. The SEM images were evident for the uniform dispersion nanofiller and showed a higher degree of surface roughness in the EPA-3 sample. This indicated that the sample EPA-3 could be absorbed more energy to deform and lock the cracks under load, contributing to the enhancement of mechanical properties in the presence of nanoparticles. 3. The FTIR spectra showed that the nano-alumina filler remained non-reactive towards the novolac epoxy matrix and remained physically present to strengthen the composite system. 4. The curing behavior of composite samples showed a lower Tp and ΔH value upon the addition of nanofiller than the neat epoxy. The lowest value of Tp and ΔH was observed in the EPA-3 sample, whereas the To value increased, and the maximum value of To was observed in the sample EPA-3. It revealed lower temperature curing and higher thermal stability of nanocomposite samples. 5. The thermal stability of nanocomposite samples in terms of T5%, T50%, Tf, LOI, and char yield (CY) % increased upon the increased level of nano-alumina in the matrix. The maximum value of thermal stability-related terms was found in the EPA-3 sample. Additionally, the fire retardancy value also increased continuously with the increased level of nano-alumina compared to neat epoxy. The increment in the fire retardancy values might be due to the inherent fire-retardant characteristics of nanofiller.
Footnotes
Acknowledgment
We sincerely acknowledge to: 1. M/s Atul Ltd, Valsad, Gujarat (India) for providing us Novolac Epoxy Resin and TETA curing agent, and 2. MNIT, Jaipur (India) for allowing us to characterize the composite samples.
Declaration of conflicting interests
The author(s) declared no potential conflicts of interest with respect to the research, authorship, and/or publication of this article.
Funding
The author(s) received no financial support for the research, authorship, and/or publication of this article.