
Abstract
Tuning of the crosslink density (CLD) in the rubber compounds is very crucial for optimizing the physical and mechanical properties of the ultimate rubber products. Conventionally, CLD can be measured via rheological methods such as moving die rheometer (MDR), via mechanical tests such as temperature scanning stress relaxation analysis (TSSR), or via direct swelling experiments using Flory–Rehner approach. In the current study, two novel techniques, focused ion beam - scanning electron microscopy (FIB-SEM) processing, with simultaneous energy dispersive X-ray spectrometry (EDS) mapping analysis and scanning acoustic microscopy (SAM) were combined and correlated to conventional methods on a model recipe of ethylene propylene diene monomer (EPDM) compound having different sulphur contents. Depending on the applied technique, the increase in the crosslink density with sulphur content was found to be 1.7 fold for the Flory–Rehner approach and 1.2 fold for both TSSR and MDR. It is directly monitored from the FIB-SEM-EDS analysis that the sulphur distribution and agglomeration behavior increased in line with ZnO content, which is an indirect indication of the rise in crosslink density. The impedance maps of the crosslinked samples obtained through SAM analysis revealed that the impedance of the samples increased with the increasing sulphur content, which can be attributed to higher level of crosslink density. A quantified correlation was obtained between SAM images and the crosslink density of the samples. It was shown that SAM is a promising tool for practical and non-destructive analysis for determining the formation of crosslink density of the rubbers.
Keywords
Introduction
Rubbers, possessing outstanding properties such as flexibility, heat resistance, and durability, can either be produced from natural sources or through synthetic ways. The global rubber market is expected to grow from $29.8 billion to $44.6 billion at an annual growth rate of 5.2% from 2018 to 2026. 1 Moreover, academic studies related to rubbers including patents and publications have significantly increased in the last decade. The automotive segment, especially tire production, is presumed to lead the industrial rubber market based on research and application. In addition to tire manufacturing, rubbers are also commonly used in commercial non-tire products such as gaskets, hoses, turbocharger connectors, air suspensions, adhesives, wires, and cables.
Rubbers are compounded with several ingredients such as fillers, antioxidants, antiozonants, stabilizers, processing aids, accelerators, and vulcanizing agents. Vulcanization is a process concerning the application of chemicals, usually sulphur or peroxides, using pre-defined temperature and time parameters in order to change the physical characteristics of rubber compounds due to the crosslinking of the molecules. Vulcanization of rubbers provides considerable improvement in elastic modulus, a significant increase in hardness, aging and ozone resistance, and superior mechanical properties such as tear and tensile strength. A small shift in the degree of crosslinking of rubbers results in a remarkable change in mechanical properties although the over-crosslinking of rubbers can lead to the deterioration of the ultimate products.2,3 Besides, the properties related to energy-to-break are maximized at some intermediate degree of crosslink density (CLD) since hysteresis behavior decreases as more crosslinked chains are developed. On the other hand, it should be noted that the properties of rubbers are not only a function of crosslink density, but also affected by the type of crosslink, sort and amount of filler, etc.4–6
The role of the crosslink density and the crosslink type on the physical and mechanical properties of vulcanizates were previously studied by many groups.5–21 Boonkerd et al. stated that the extent of polysulfidic bonds in natural rubber (NR) vulcanizates resulted in lower reversion resistance and higher tensile strength. 22 Pittayavinai et al. 23 investigated the effects of crosslink density on the mechanical and rheological properties of NR reinforced with short pineapple leaf fibers. They stated that the crosslink density showed an increasing tendency with a rise in sulphur content of the compounds providing composites good mechanical properties such as the desired tear strength. In a recent study, Han et al. 24 prepared nitrile butadiene rubber (NBR) compound in a two-roll mill. They used dicumyl peroxide as a vulcanizing agent. The results of their research showed that the tensile strength of NBR composites was enhanced due to the increased crosslink density. The most common methods being used to determine the crosslink density of rubber compounds can be listed as moving die rheometer (MDR) analyses and swelling experiments. Moreover, a novel technique, temperature scanning stress relaxation (TSSR) measurements, can be used to evaluate the crosslink density of rubber compounds. On the other hand, all these methods cause damage to the material during the testing of the samples. As an alternative, a variety of acoustic techniques have been used for measuring the properties of polymeric materials without the destruction of specimens.23–33
Scanning Acoustic Microscopy (SAM) is a novel and effective technology for monitoring materials’ internal structures using high-frequency ultrasonic waves. 34 – 36 It is a high-resolution and non-destructive characterization method to gather information on the inhomogeneities inside a large spectrum of materials such as defects, additives, and chemical disorders/variations, for example, crosslinking. SAM can obtain morphological and mechanical information simultaneously. High-speed in obtaining two-dimensional (2D) images of surfaces with micrometer resolution made SAM a promising tool for characterization of semiconducting thin films 37 or manufactured polymers. 38
This study concerns the determination of the crosslink density in a sulphur-crosslinked rubber using SAM and its correlation with nanotechnological and conventional techniques. Due to the variations in the acoustic impedance of the crosslinked and the uncrosslinked domains, SAM enables constructing maps of crosslinking distribution within a certain region of interest in rubber samples. In order to observe the distribution of sulphur, “the crosslinker,” throughout the rubber samples, focused ion beam - scanning electron microscopy (FIB-SEM) analyses which involves ion beam cross-sectioning and electron beam imaging methods were performed, in combination to energy dispersive X-ray spectrometry (EDS) mapping analysis on the cross-sectioned sidewalls. This can be considered as a novel and practical nanotechnological characterization tool for high-resolution imaging and chemical analysis of materials in addition to simultaneous nanostructuring processes inside a multi-beam platform.39,40 In comparison to the conventional methods, for example, ultramicrotomy, the combination of FIB with SEM-EDS techniques allows for practical one-step procedures for both slicing and cross-sectional elemental analysis for multiple regions on the samples. In the scope of this research, these two modern advanced microscopy techniques were combined with and correlated to conventional methods, such as TSSR 41 analysis, MDR, 42 and swelling measurements43–45 on a model recipe of ethylene propylene diene monomer (EPDM) compound having different sulphur contents.
Experimental
Materials
Rubber compound recipes (phr).
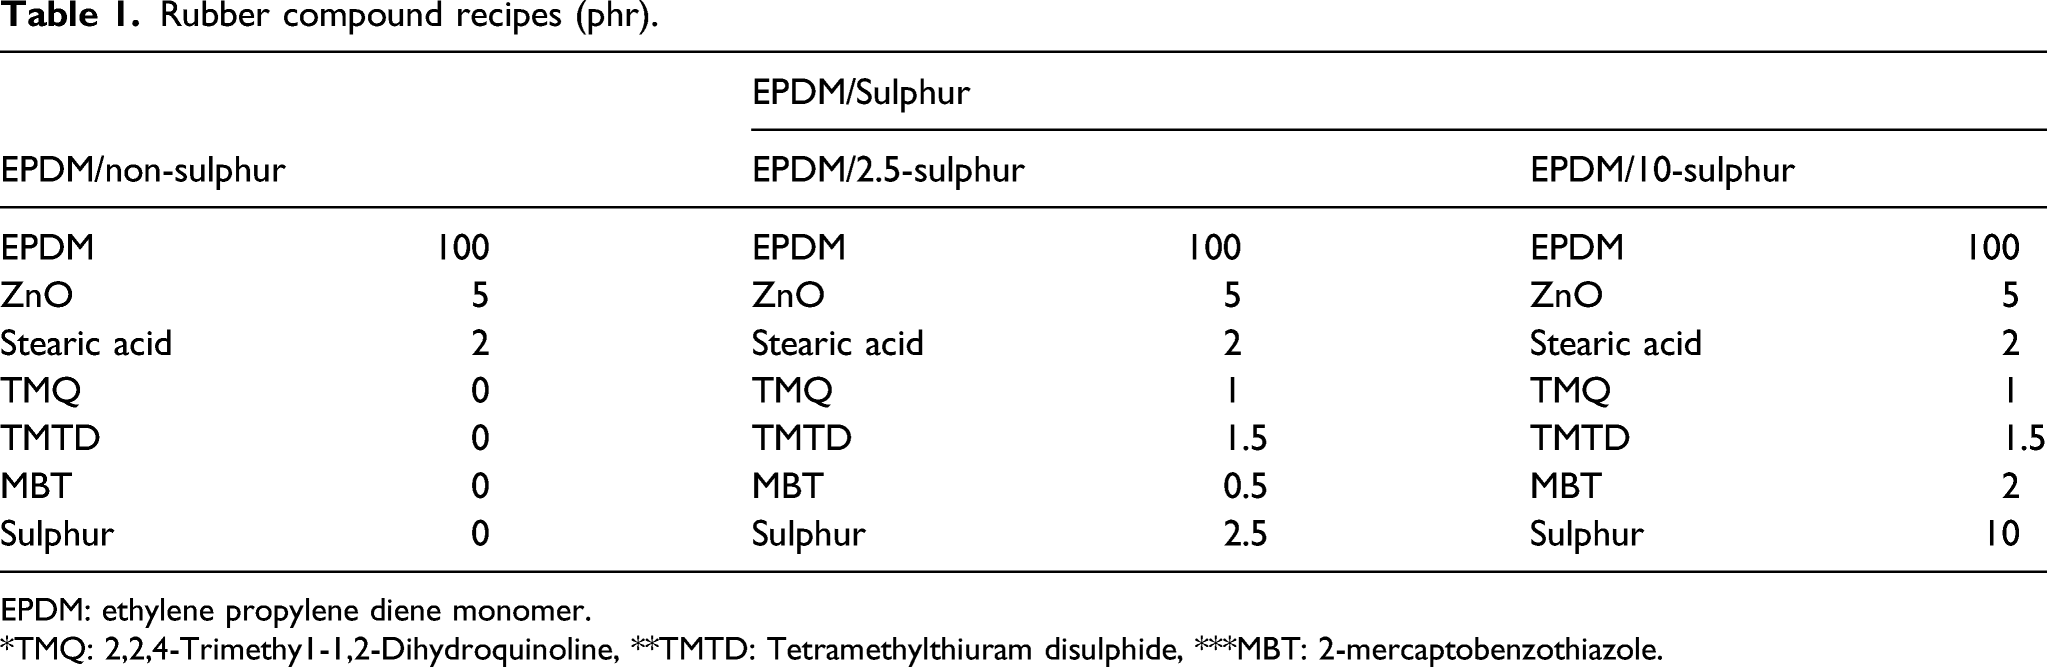
EPDM: ethylene propylene diene monomer.
*TMQ: 2,2,4-Trimethy1-1,2-Dihydroquinoline, **TMTD: Tetramethylthiuram disulphide, ***MBT: 2-mercaptobenzothiazole.
Processing
Ethylene propylene diene monomer and ingredients were compounded in a Brabender mixer with a rotor speed of 50 rpm at 50°C for 5 min. In the first stage, EPDM was masticated for 2 min, then activators and antioxidant were incorporated into the compound and were mixed for 2 min. By the end of the process, accelerators and curing agent were added to the EPDM compounds and mixed for 1 min. Compounds were then homogenized and shaped by using a laboratory-type two-roll mill. Milling speed was kept constant at 10 rpm, and the friction ratio was 1:1.1. Curing time of the compounds with respect to t90 was determined from the MDR analysis. A hot press was used for curing and molding of EPDM compounds at 160°C.
Characterization
Moving die rheometer
A moving die rheometer (MDR, Alpha Technologies) was used to obtain the rheological characteristics of EPDM compounds, such as optimum cure time and scorch time according to ASTM D-5289
42
at 160°C. Crosslink density of the samples was determined from the difference of maximum and minimum torque values (MH and ML) in the curves that were obtained from the MDR analysis (equation (1)).
Swelling tests
By using the parameters such as the density of rubber matrix, density of toluene, volume fractions of the polymer and solvent, and polymer-solvent interaction parameter, χ (for EPDM/Toluene; χ:0.496 46 ), CLD of the vulcanized compounds was calculated by applying the Flory–Rehner equation.43–45
Temperature scanning stress relaxation analysis
The crosslink densities of rubbers can also be detected from the assessment of the stress relaxation behavior of rubbers according to the classical rubber elasticity theory of Neo Hookean law. 47 According to the ASTM D8363-20, 41 the applied stress, σ, is proportional to the temperature at a constant strain (equation (2)). In another word, an increment in the temperature of a sample results in an increase in the stress value. 48
A constant tensile strain of 50% was applied to a dumbbell test specimen (Type 5A, ISO 527). Then, the specimen was preconditioned for isothermal relaxation at 23°C for 2 h without heating. Subsequently, the specimen was heated from 23°C to 120°C at a heating rate of 3°C/min, until the stress relaxation was fully completed. Finally, the crosslink density of the samples was calculated by using equation (2)
Scanning acoustic microscopy
A scanning acoustic microscope (AMS-50SI) developed by Honda Electronics (Toyohashi, Japan) was used to analyze the vulcanized EPDM compounds in the acoustic impedance mode (Figure 1). SAM is mainly composed of a transducer with an ultrasonic lens, a pulser/receiver, an oscilloscope, and a computer with a display monitor. 80 MHz transducer generates nanosecond pulses (i.e., 5 ns) at a high frequency (i.e., 10 kHz) and collects the reflected acoustic waves; therefore, it acts as a pulser/receiver. For focusing, an acoustic lens is attached to the transducer. The spot size is 17 µm and its focal length is 1.5 mm. Distilled water is chosen to be the coupling medium between the acoustic lens and the specimen. X-Y stage, controlled by a computer, is used for two-dimensional scans. Oscilloscope analyzes the reflected signals from both the reference and target material (Figure 2), and acoustic intensity and impedance maps of the region of interest with a lateral resolution of approximately 20 μm are obtained. Schematic of scanning acoustic microscopy setup in acoustic impedance mode.
37
Principle of scanning acoustic microscopy in acoustic impedance mode. The acoustic waves reflected from the surfaces of distilled water and the target are collected by the same transducer and compared for the calculation of the acoustic impedance of the target.
37


The reflected signal from the reference is given in equation (3)

Consequently, the target’s acoustic impedance is calculated as follows by equation (5)
Focused ion beam - scanning electron microscopy and energy dispersive X-ray spectrometry analyses
A FIB-SEM dual-beam platform mainly consists of an electron and an ion column and is also equipped with additional attachments such as detectors, gas injection systems, and micromanipulator for specimen lift-out. The ion beam (usually gallium) is used for processing of the samples with a sub-micron resolution, while electron beam is often used for simultaneous high-resolution SE and BSE imaging, for example, while samples are cross-sectioned by ions (Figure 3). In these multi-beam platforms, also EDS spectral and mapping analyses are usually conducted on-site within the region of interest. Inside of a focused ion beam - scanning electron microscopy platform (left); the ion cross-sectioning and electron imaging process (right).
39

In this study, for the cross-sectional SE imaging and EDS mapping analysis of the rubber samples, a JEOL JIB 4601F FIB-SEM Multi-Beam system coupled with an Oxford X-MaxN EDS detector system was used. The EPDM samples were sputter-coated prior to FIB-SEM processes with a thin film of Au: Pd (Cressington 108, UK) in order to avoid charging effects inside the microscope. The samples were then cross-sectioned via gallium ion milling at 30 keV ion energy, using a 10 nA ion beam current. The sectioned lateral surfaces were then observed by SEM-SE (Secondary Electron) imaging analysis using 5 keV at 3000x magnification. At the same time, EDS mapping analysis was performed at the cross-sections, and the distribution of the elements, which are present in the EPDM compounds, were identified.
Mechanical properties
The tensile properties of EPDM samples were determined by using Instron Universal Testing Machine (Model 3345) according to ASTM D412. The crosshead speed was 500 mm/min. The hardness of the samples was measured by using Zwick Shore A type durometer according to ASTM D-2240.
Thermal properties
Differential scanning calorimeter (DSC) analyses were performed by using Mettler Toledo DSC1 Star System by heating the vulcanized EPDM samples from 25°C to 250°C at a heating rate of 10°C/min under N2 purge. DSC thermograms were evaluated to investigate unreacted sulphur content in EPDM samples.
Result and discussion
The crosslink density of the rubber samples via conventional techniques
Figure 4 shows the rheometer curves of the EPDM compounds having different amounts of curing agent, sulphur. Rheological properties were measured at 160°C. The important rheological parameters such as scorch time (ts2), optimum cure time (t90), maximum and minimum torque values (MH and ML), cure extent, and cure rate index (CRI) were determined from MDR curves (Table 2). Cure extend, referring to the crosslink density of a vulcanizate, was derived from the difference between the MH and ML values. Cure rate index (CRI) was calculated by using equation (6) Rheometer curves of ethylene propylene diene monomer compounds. Rheological properties of ethylene propylene diene monomer compounds. EPDM: ethylene propylene diene monomer; CRI: cure rate index.


As can be seen from Table 2, the scorch safety of EPDM compounds decreased with the sulphur incorporation. Indeed, lower scorch time usually indicates a higher cure rate. This finding coincides with lower t90 and higher CRI values. However, as the sulphur content increased, the value of the cure extend also increased. This value is an indication of the crosslink density and shows that the crosslink density increases with increasing sulphur content as expected.
Crosslink density of ethylene propylene diene monomer compounds from Flory–Rehner swelling measurements.
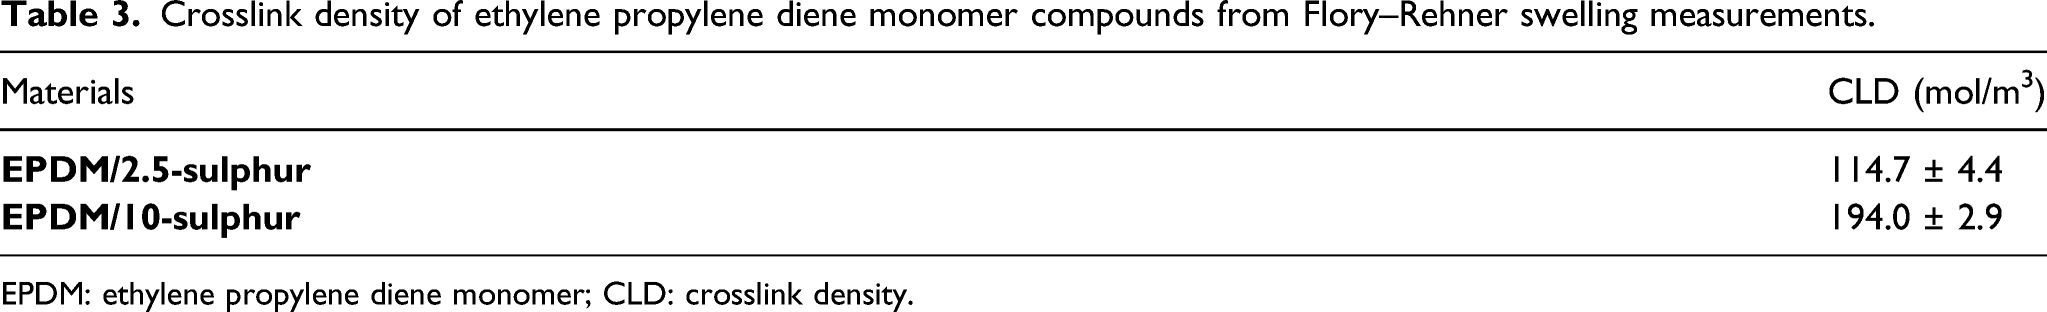
EPDM: ethylene propylene diene monomer; CLD: crosslink density.
Thermodynamically, entropy elasticity becomes critical. The temperature coefficient, κ, was calculated from the slope of the initial part of the temperature–stress curves. The quotient F/F0, or force ratio, is obtained by normalizing the stress over-temperature curve. The forces F and F0 correspond to the force at temperature T and T0, respectively (Figure 5).
51
At a constant strain, the slope of the stress versus temperature plot reveals the crosslink density.
52
The influence of crosslink density is clearly recognizable from the shape of the curves (Figure 5). As can be seen from Figure 5, the EPDM compound having 2.5 phr curing agent exhibits much slower stress relaxation as compared to the EPDM with 10 phr sulphur. This was due to the lower crosslink density of EPDM 2.5-sulphur samples as can be seen in Table 4. Stress over-temperature curves at a constant strain for ethylene propylene diene monomer compounds. The crosslink density of the ethylene propylene diene monomer compounds obtained from the temperature scanning stress relaxation tests. EPDM: ethylene propylene diene monomer; CLD: crosslink density.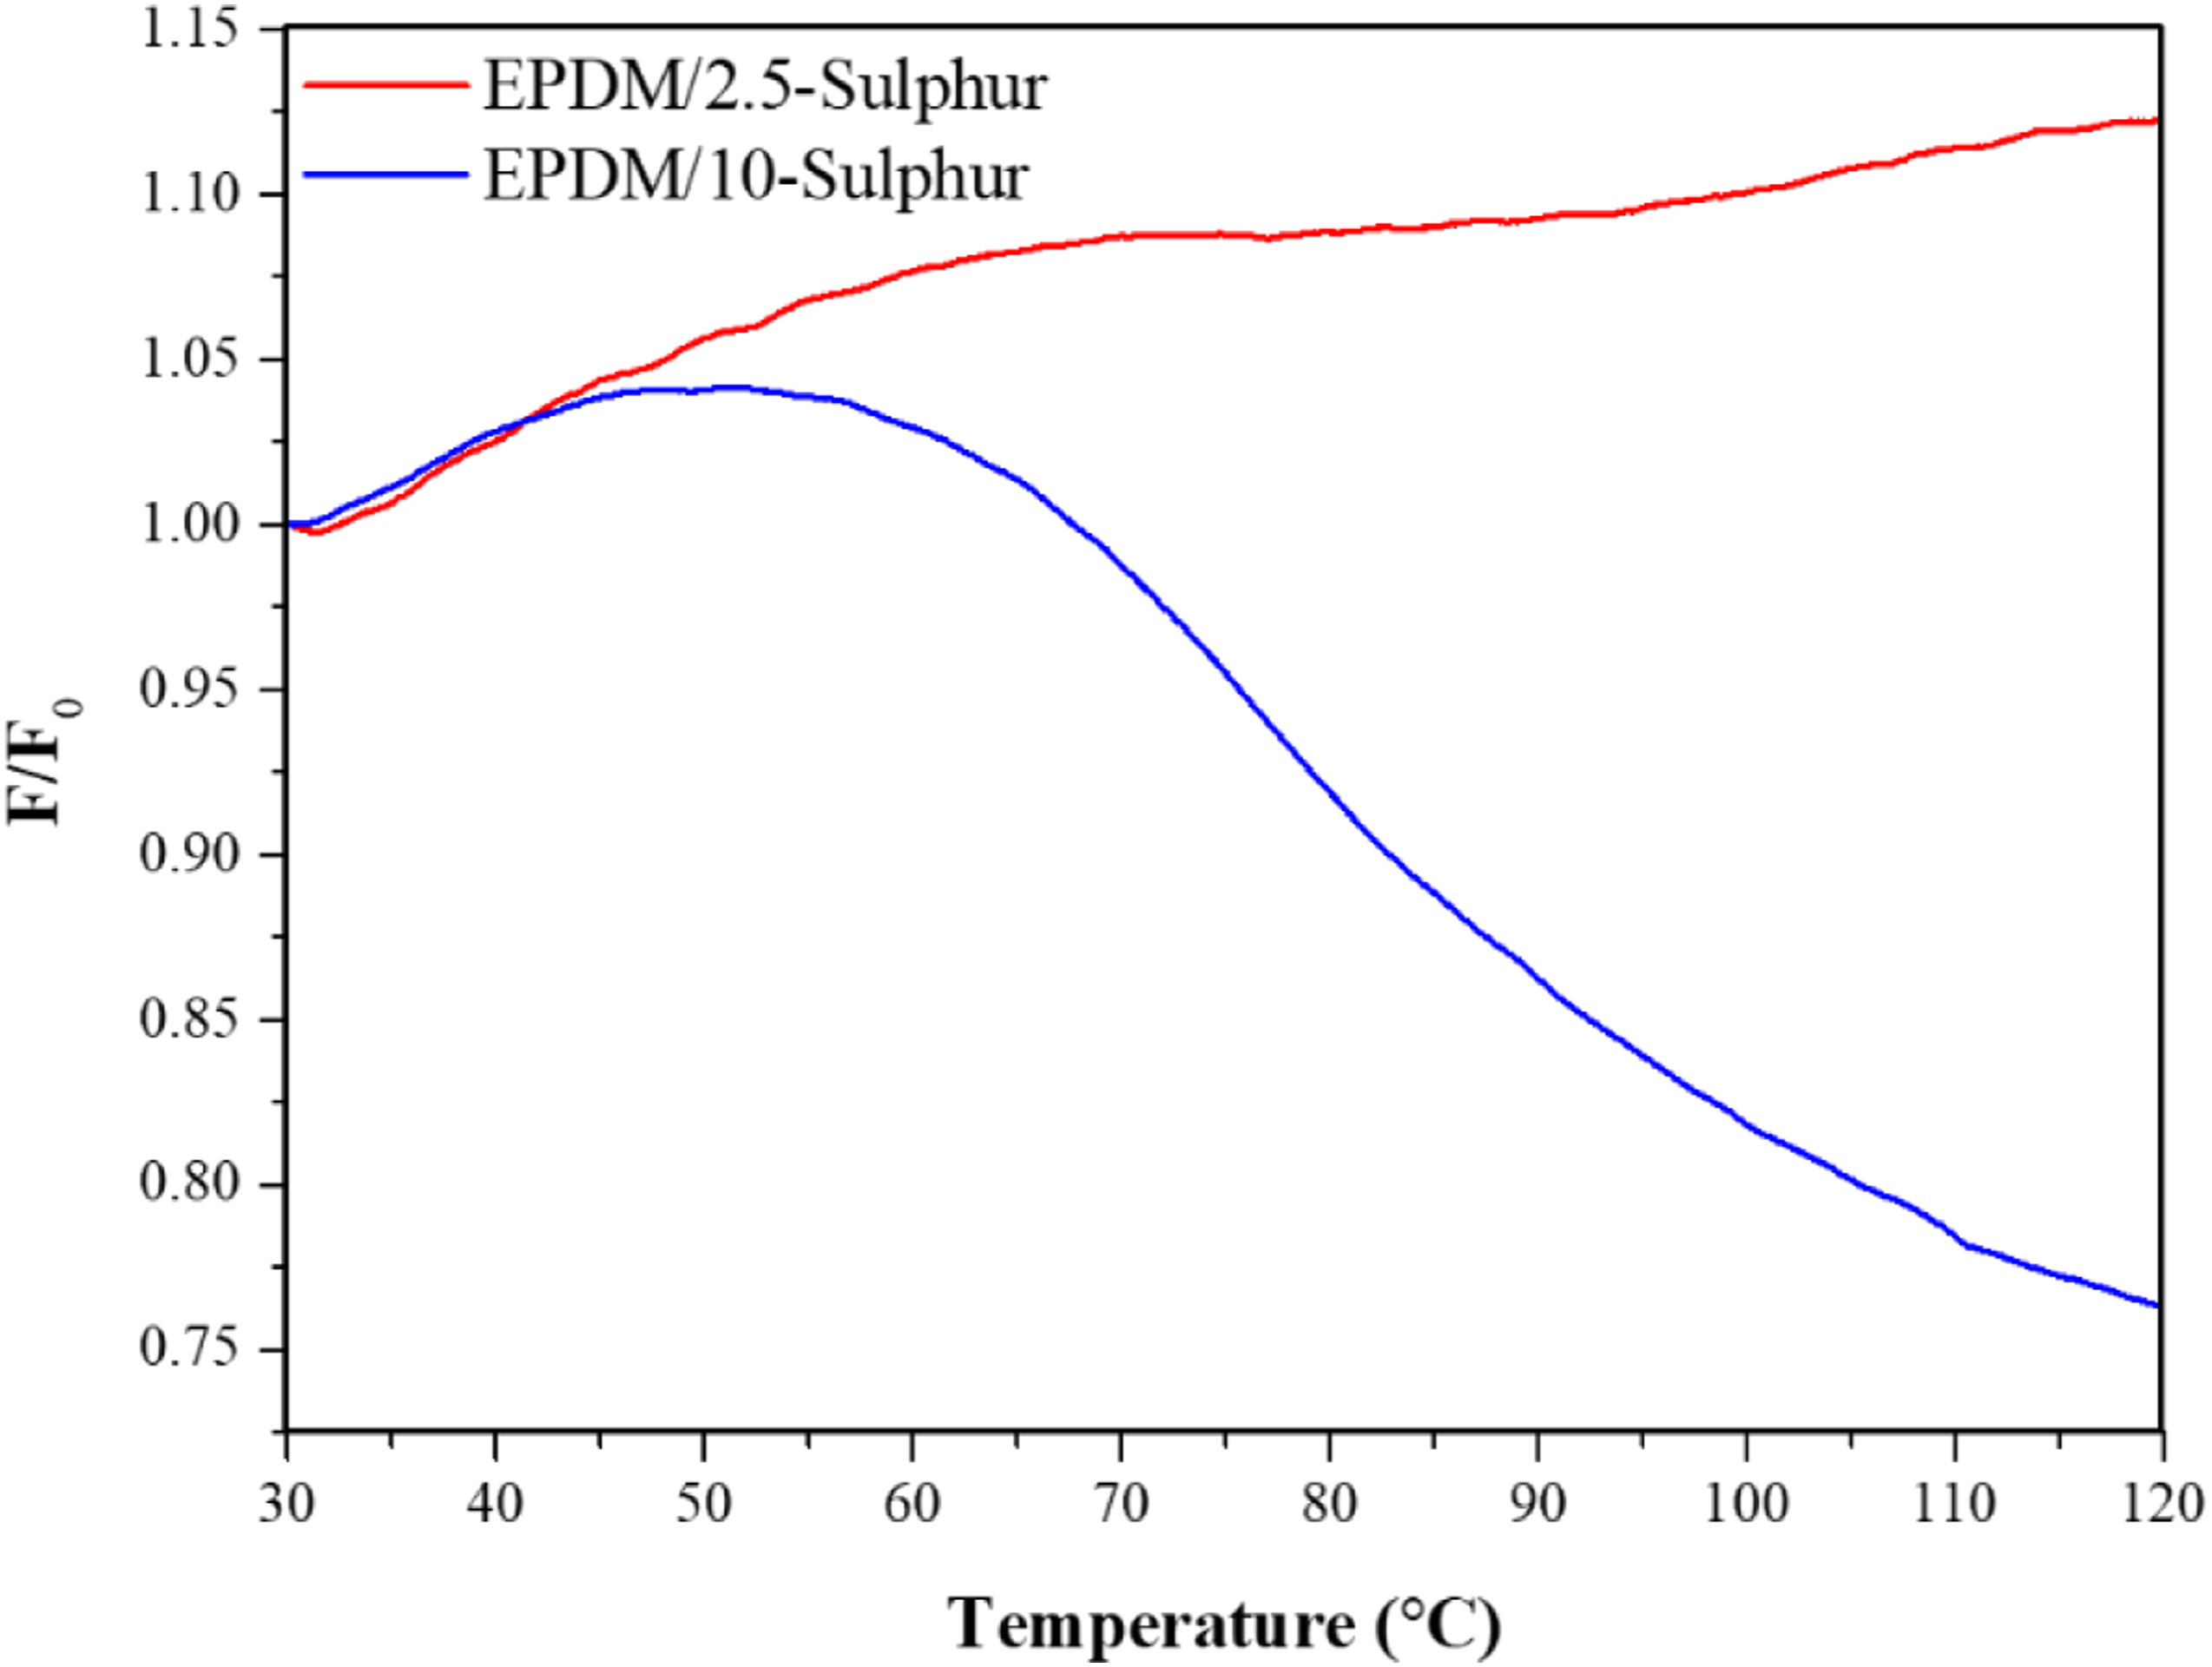

The crosslink density of the rubber samples via complementary scanning acoustic microscopy and FIB-SEM-EDS
After the conventional techniques that yielded the crosslink density of a model EPDM compound, novel approaches based on microscopical analysis were applied to the EPDM compounds in order to monitor the sulphur dispersion. The basic idea here is to correlate the dispersion of sulphur-rich regions together with other crosslinking additives, such as ZnO, in the EPDM compounds with the crosslinked sites, hence high crosslink density. Therefore, FIB-SEM-EDS techniques were performed for complementary imaging and quantitative analysis.
A Focused Ion Beam (FIB) tool was used for providing smooth cross-sections from the rubber samples via gallium ion milling for a better understanding of the inner structure of the samples (Figure 6). The FIB-SEM microscopes perform SEM imaging of the ion-milled cross-sections at the same time also allowing for the simultaneous EDS analysis of the same lateral surfaces. The EDS mapping studies showed that the elemental distribution was different for each EPDM samples having different crosslink densities (Figures 7–9). SEM-SE images taken from the FIB cross-sections of: (a) EPDM without sulphur (b) EPDM 2.5-Sulphur and (c) EPDM 10-Sulphur. The SE images were acquired using 5 keV and 3000x magnification after 30 keV gallium ion milling at 10 nA ion current. EPDM: ethylene propylene diene monomer. SEM-EDS maps showing the distribution of elements throughout the ethylene propylene diene monomer sample without sulphur: carbon (red), oxygen (green), zinc (blue), and N (pink). SEM-EDS maps showing the distribution of elements throughout the ethylene propylene diene monomer sample having 2.5 phr sulphur: carbon (red), oxygen (green), zinc (blue), N (pink), and sulphur (yellow). SEM-EDS maps showing the distribution of elements throughout the ethylene propylene diene monomer sample having 10 phr sulphur: carbon (red), oxygen (green), zinc (blue), N (pink), and sulphur (yellow).

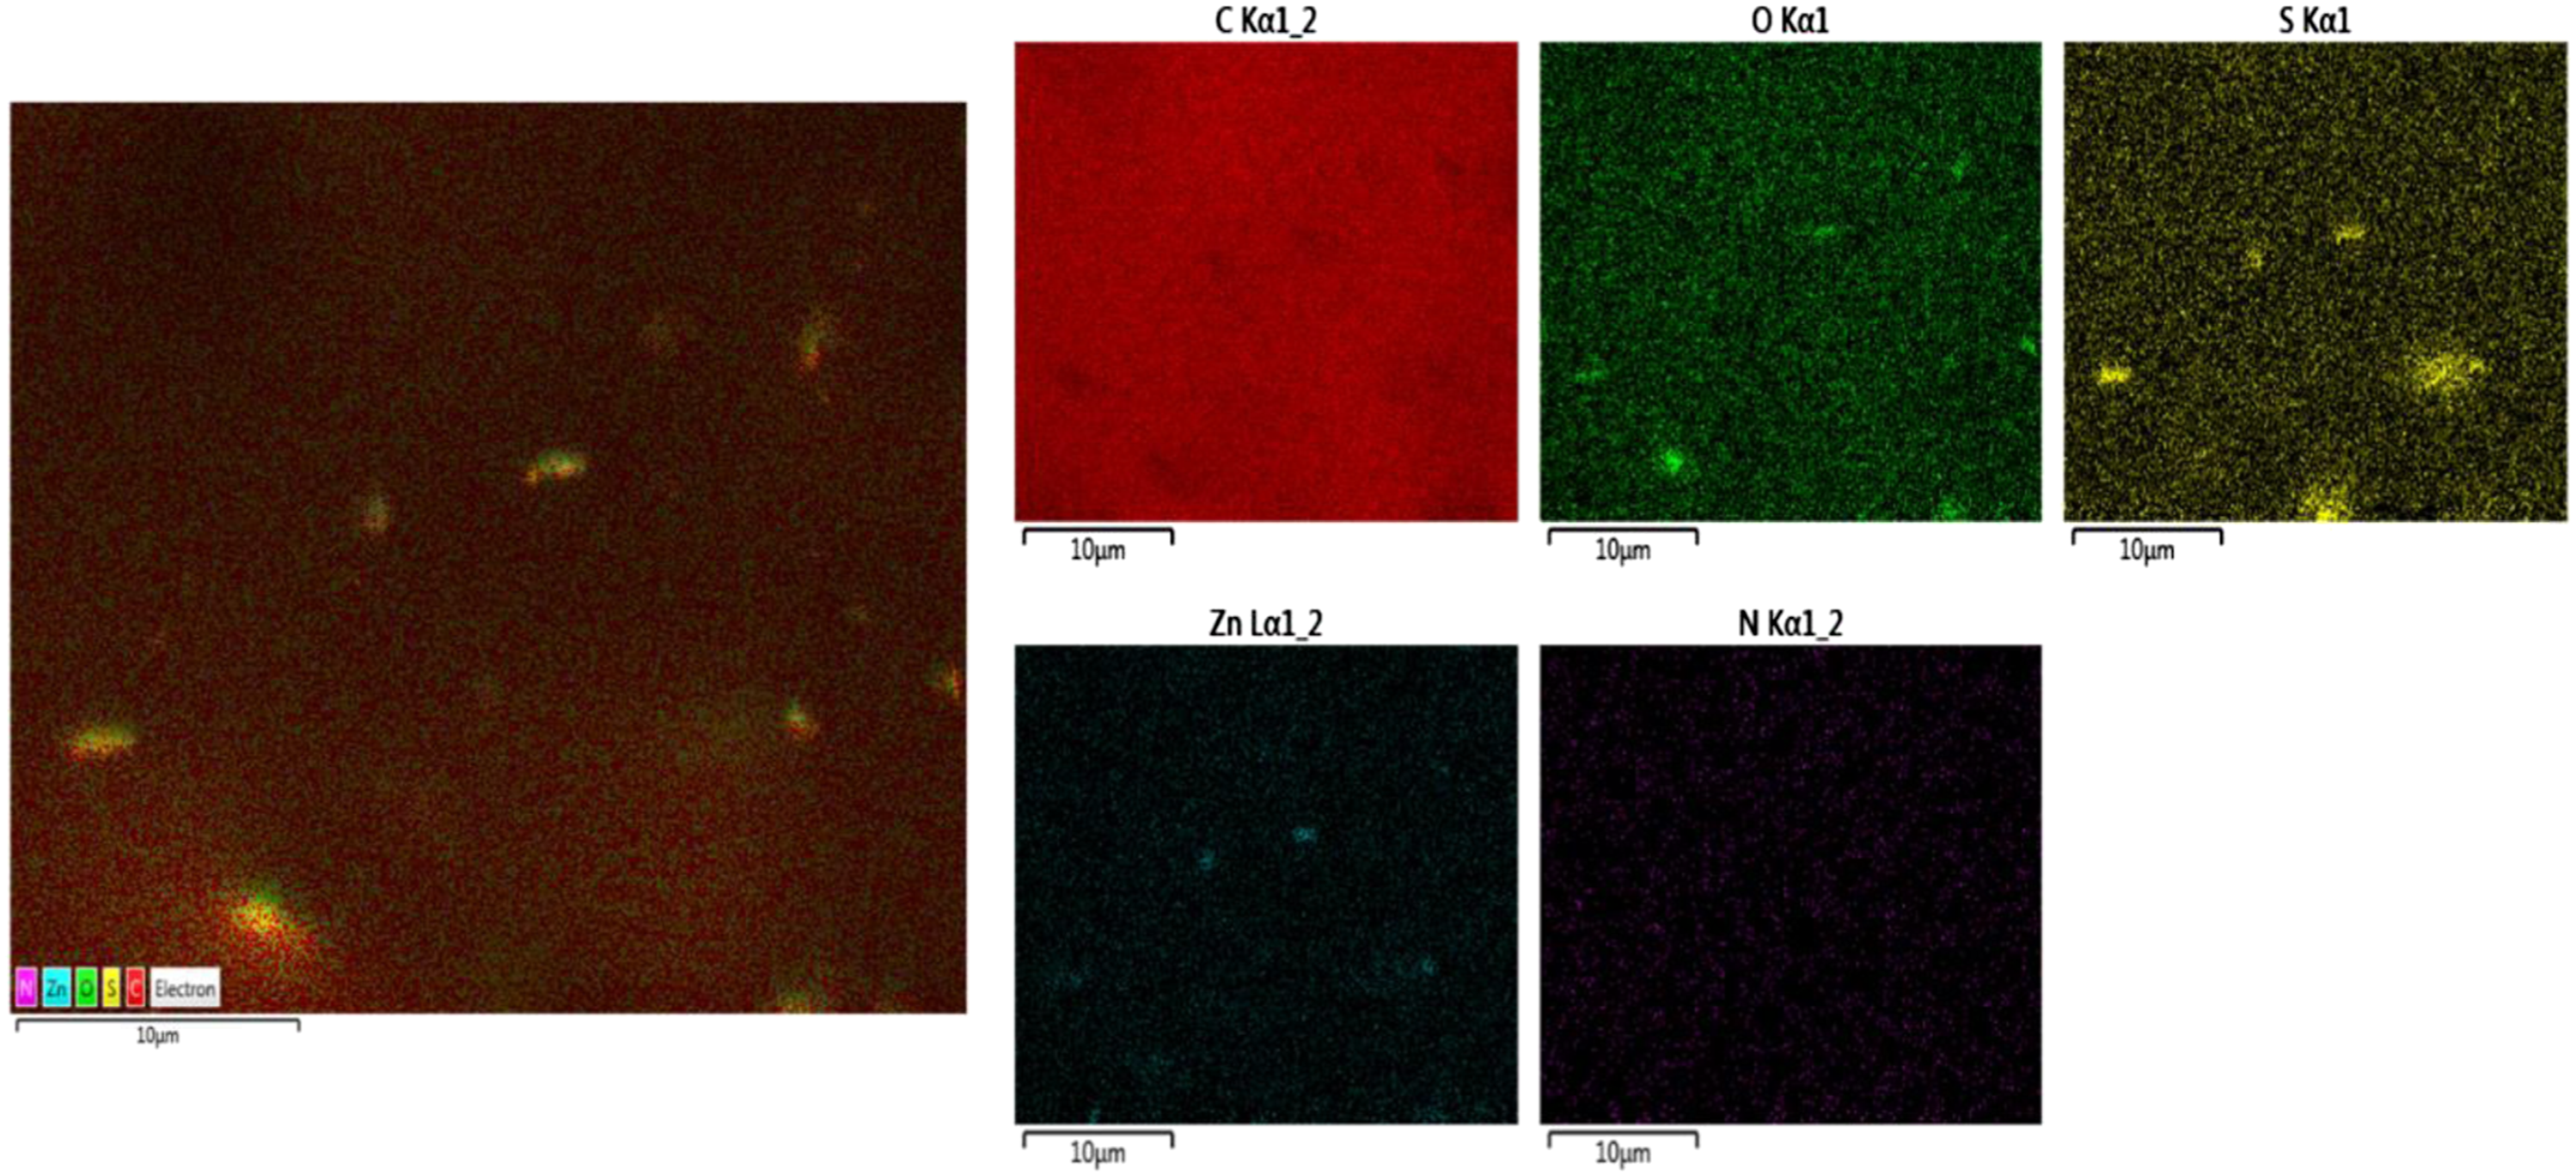

An EDS mapping analysis conducted on the EPDM sample without sulphur is given in Figure 7. The EDS maps showed that the sample was consisting of Carbon (C) (red), Oxygen (O) (green) and Zinc (from ZnO, the activator) (blue), and some trace of Nitrogen (N) (pink) at the cross-section; however, there was no Sulphur (yellow) content found as presumed. It is known from the literature that for a given amount of sulphur loading, a higher crosslink density necessitated changes in the sulphur rank distribution, such as monosulphidic or polysulphidic crosslinks. 53 The expectation for a ZnO-activated compound in a conventional vulcanization system is for a majority of polysulphidic crosslinks to be formed. 54 Literature shows that the increasing sulphur content in a rubber compound together with the presence of ZnO activation results in higher crosslink density and the formation of the polysulphidic bonds. 53 Therefore, the determination of both sulphur and ZnO distribution within a crosslinked rubber compound is crucial. Figure 8 represents the cross-sectional EDS mapping analysis of 2.5 phr sulphur containing sample, displaying the presence of S coming from the sulphur and N coming from the accelerators in the materials, in addition to the elements detected in the pristine sample. The EPDM sample having 10 phr sulphur, as expected, was found to be rich in S when compared to the samples without sulphur and with 2.5 phr sulphur (Figure 9). It is obvious from the EDS images that both in 2.5 and 10 phr sulphur-containing samples, the sulphur distribution is found to be highly homogenous. Related to the distribution of Zn in the compounds, it is seen that as the sulphur content increases, the level of agglomeration of the ZnO or ZnS increases together with the sulphur. This might be a useful indication of both the formation of the crosslinks and the formation of the ranking of the crosslinks since the presence of ZnO mostly resulted in the formation of poysulphidic crosslinks, which was already mentioned in the previous part.
The FIB-SEM analysis results showed that as the crosslink density increases the sulphur content and its degree of agglomeration increase. These agglomerates of sulphur are thought to be the highly crosslinked domains within the rubber samples. FIB-SEM analysis performed at a pre-defined section on a rubber sample provides straightforward monitoring of the formation of the crosslinks.
Rubber samples including high amount of sulphur may present undesirable sulphur migration from the bulk on to the surface. This might happen during the storage of the sample in such a way that considerable amount of coarse dispersed sulphur remains unreacted because of its poor solubility in a nonpolar rubber matrix such as EPDM.55–57 To evaluate whether there is unreacted sulphur, DSC analyses were carried out for vulcanized EPDM samples having different amount of sulphur (Figure 10). We observed that elemental sulphur (S8) shows two endothermic peaks in the range of 100–130°C, which resulted from the melting of the α and β crystals of the sulphur. The endothermic peak formed around 180°C can be attributed to the ring-opening of sulphur.
58
On the other hand, the endothermic peaks of sulphur originated from the crystalline phase disappeared completely for vulcanized EPDM samples including 2.5 and 10 phr sulphur. These findings confirm that there is not any unreacted sulphur after vulcanization process. Differential scanning calorimeter thermograms of ethylene propylene diene monomer compounds and sulphur.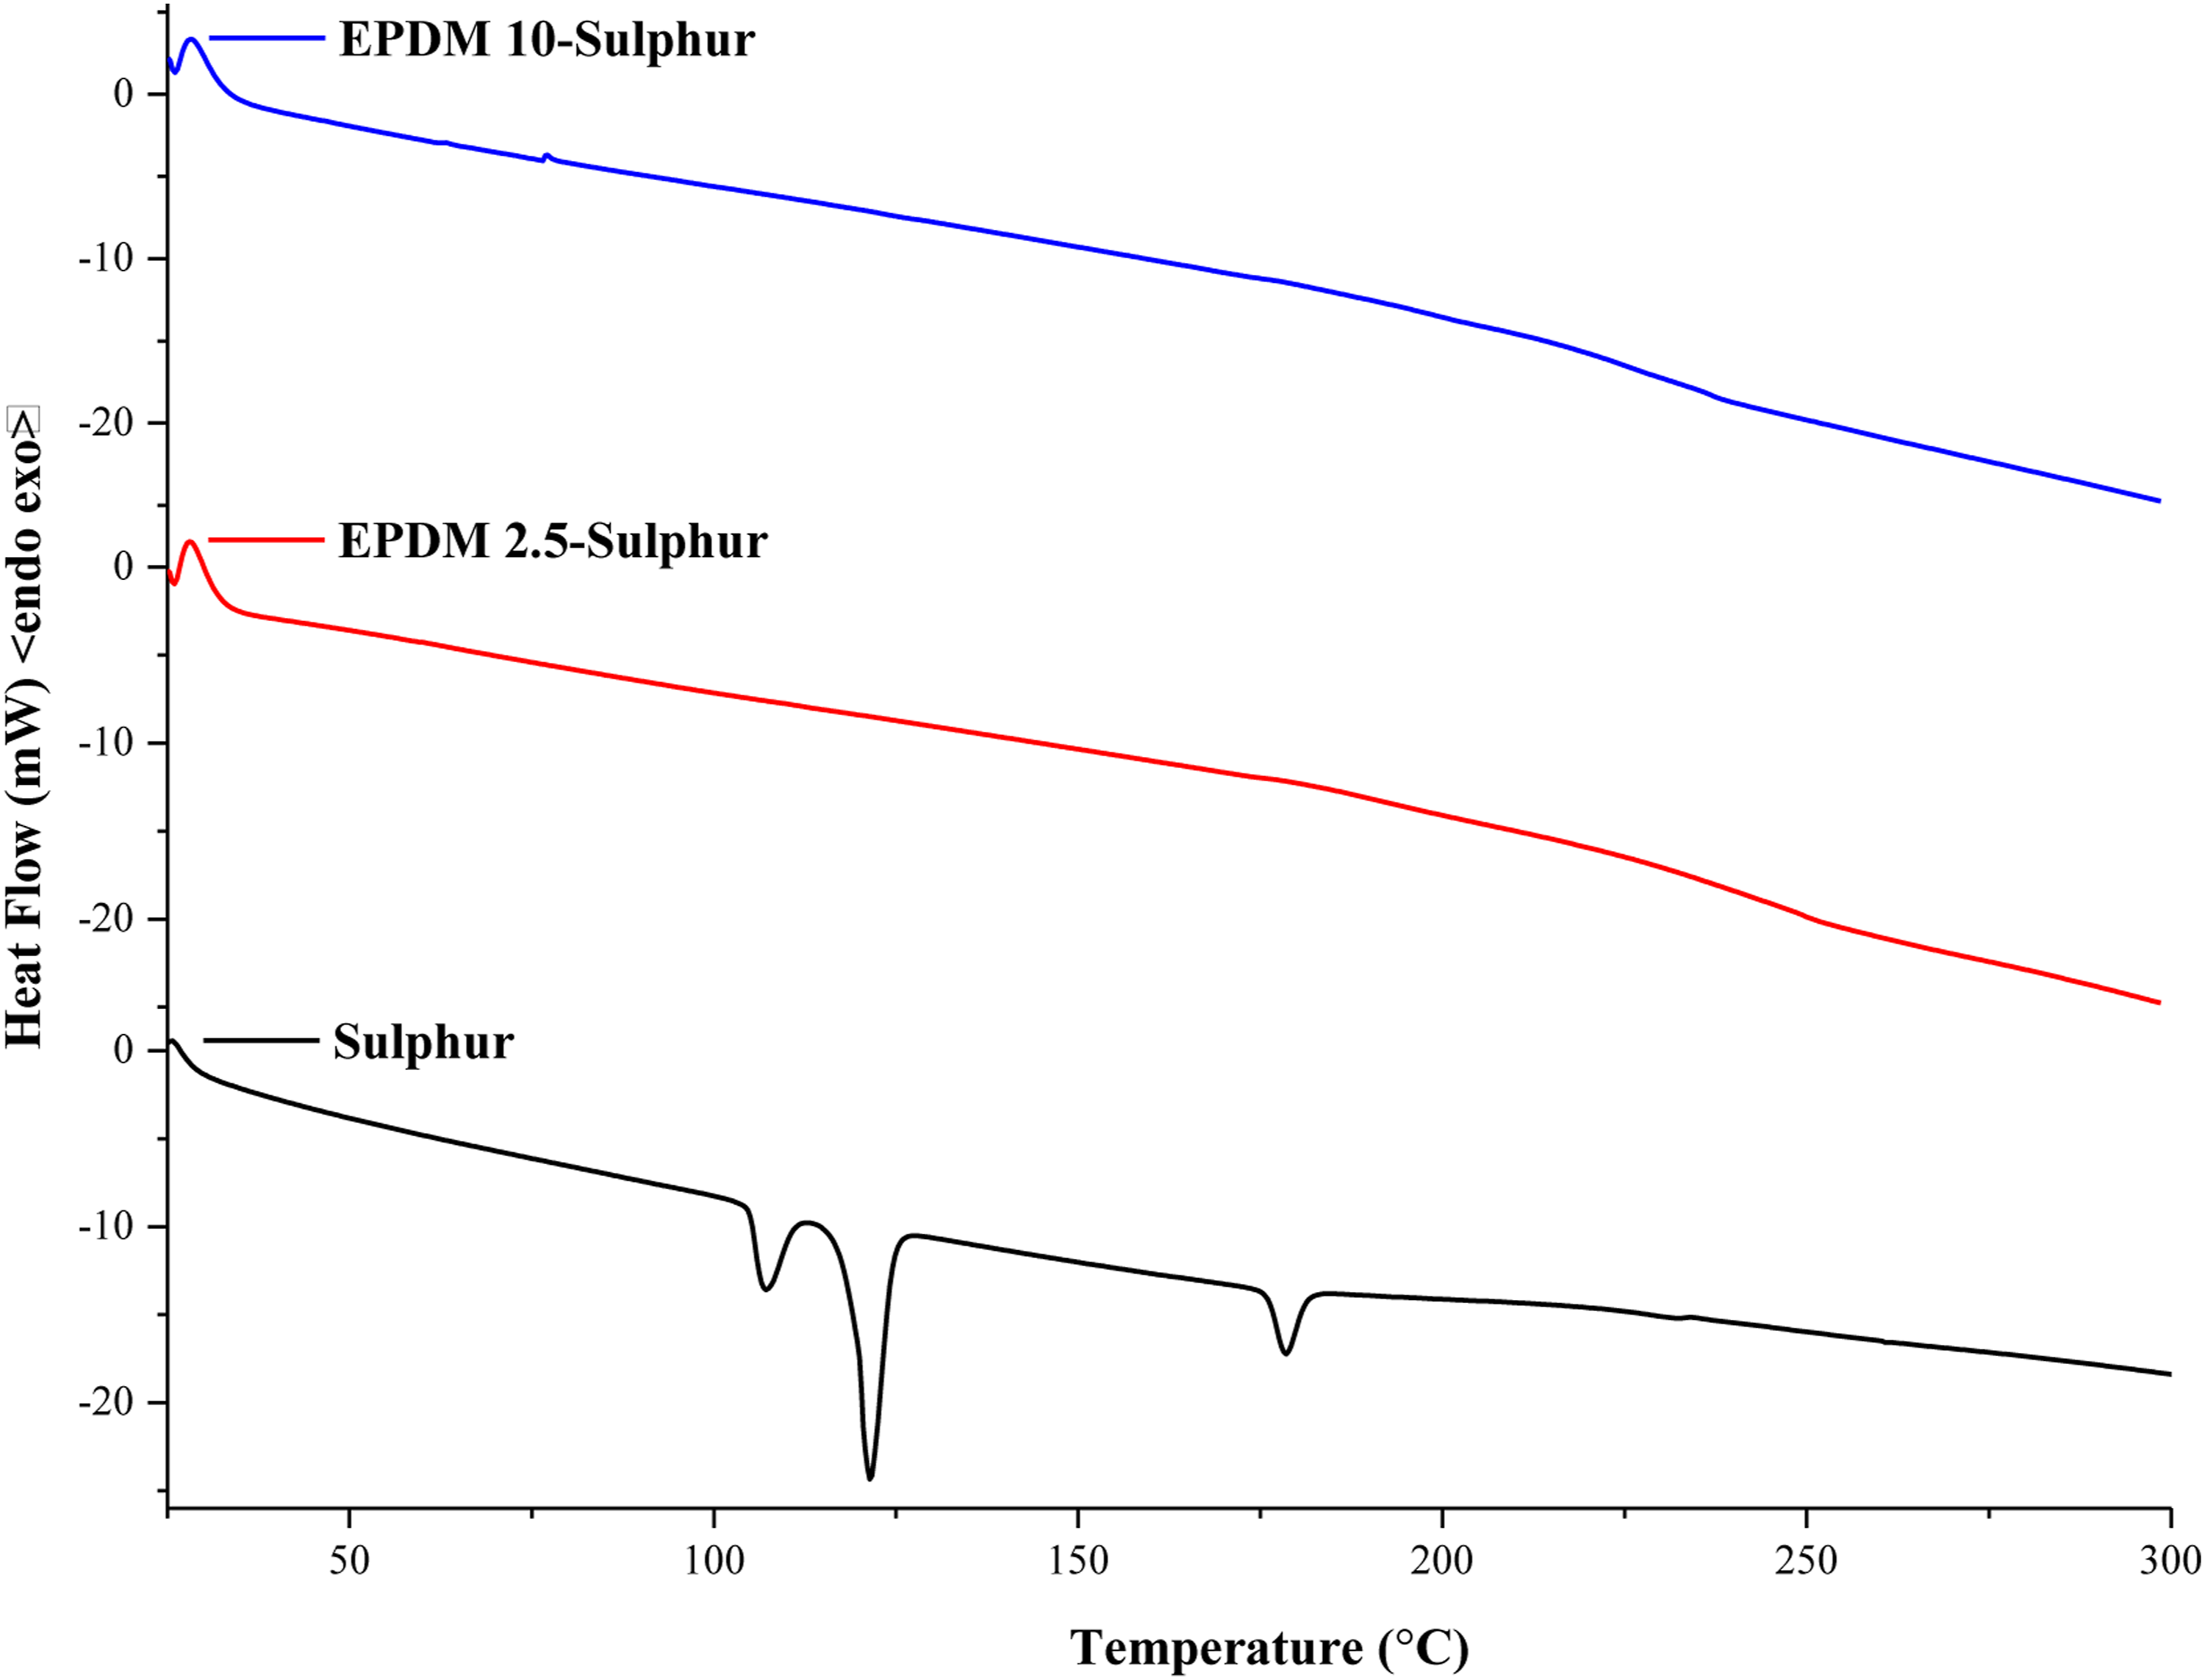
One other novel technique SAM enabled to observation acoustic impedance, which is the product of sound speed and density, having a close correlation with an elastic modulus of the EPDM compounds. Since the local elastic modulus of the sample varies with the crosslink density, distribution of acoustic impedance can yield a spectrum of the variation of the crosslink density.
The SAM images, obtained using the acoustic impedance mode of SAM, were constructed by comparing the reflections of ultrasound signals from the reference and the samples. To evaluate the crosslink density of cured EPDM compounds via SAM techniques, uncured EPDM compounds were also prepared and analyzed by SAM. Maximum scanning area of SAM is 4.8 mm x 4.8 mm; therefore, we show representative scans of samples with different crosslink densities in Figures 11–13. Figure 11 shows the acoustic impedance distribution of the EPDM compound without sulphur. On the other hand, Figure 12 and 13 illustrate the acoustic impedance distribution of EDPM samples having 2.5 and 10 phr sulphur, respectively. Scanning acoustic microscopy image of the ethylene propylene diene monomer sample without sulphur (scanning area is 4.8 mm × 4.8 mm). Scanning acoustic microscopy image of the ethylene propylene diene monomer sample having 2.5 phr sulphur (scanning area is 4.8 mm × 4.8 mm). Scanning acoustic microscopy image of the ethylene propylene diene monomer sample having 10 phr sulphur (scanning area is 4.8 mm × 4.8 mm).


In SAM analysis, harder samples exhibit higher acoustic impedance values. 59 As can be seen from Figure 12 that the 2.5 phr sulphur containing the EPDM sample exhibits higher acoustic impedance values when compared with the EPDM sample without sulphur in Figure 11. Moreover, as the sulphur content increases from 2.5 to 10 phr in EPDM, acoustic impedance distribution exhibits even higher values for the samples having high crosslink density (Figure 13). All these findings can be attributed to the fact that SAM can monitor the morphological and mechanical properties of rubber samples with different crosslink densities by measuring the acoustic impedance values without physically damaging the sample. Besides, the success of SAM in monitoring samples with different chemical compositions is promising for the control of homogenous surfaces.
In order to quantify the SAM analysis, an image processing route was developed by using Image J software. By the help of the software, the SAM images were converted to black and white pictures. The threshold changing from black to white was determined from the impedance scales (Figure 14). It is seen that the impedance scale ranges between 1–5 MRayl for the uncured none-sulphur compounds. On the other hand, the impedance scale goes up to 12 MRayl for the sulphur containing cured compounds. Therefore, it is decided to locate the transition threshold from black to white onto five MRayl (see Figure 14). This means that the white areas are the sulphur-rich, harder, high impedance regions referring to the high crosslink density. The location of the threshold point.
The ratio of the area of white regions to the total area was calculated and tabulated in Figure 15. It is seen that the increasing crosslink density resulted in the increase in the ratio of the white areas to the total. A comparison to the conventional techniques is given in Table 5. It is seen that regarding to the applied conventional technique, the crosslink density increased 1.2 to 1.7 times with respect to the increasing sulphur content depending on the technique. Similarly, 1.6 times increase was obtained in the ratio of white to the total area from SAM. These findings revealed a correlation between the conventional techniques and SAM analysis to determine the crosslink density of rubber compounds. The scanning acoustic microscopy pictures after image manipulation using Image J. Comparison of the results of quantified scanning acoustic microscopy analysis to the conventional techniques based on crosslink density (CLD). EPDM: ethylene propylene diene monomer; CLD: crosslink density.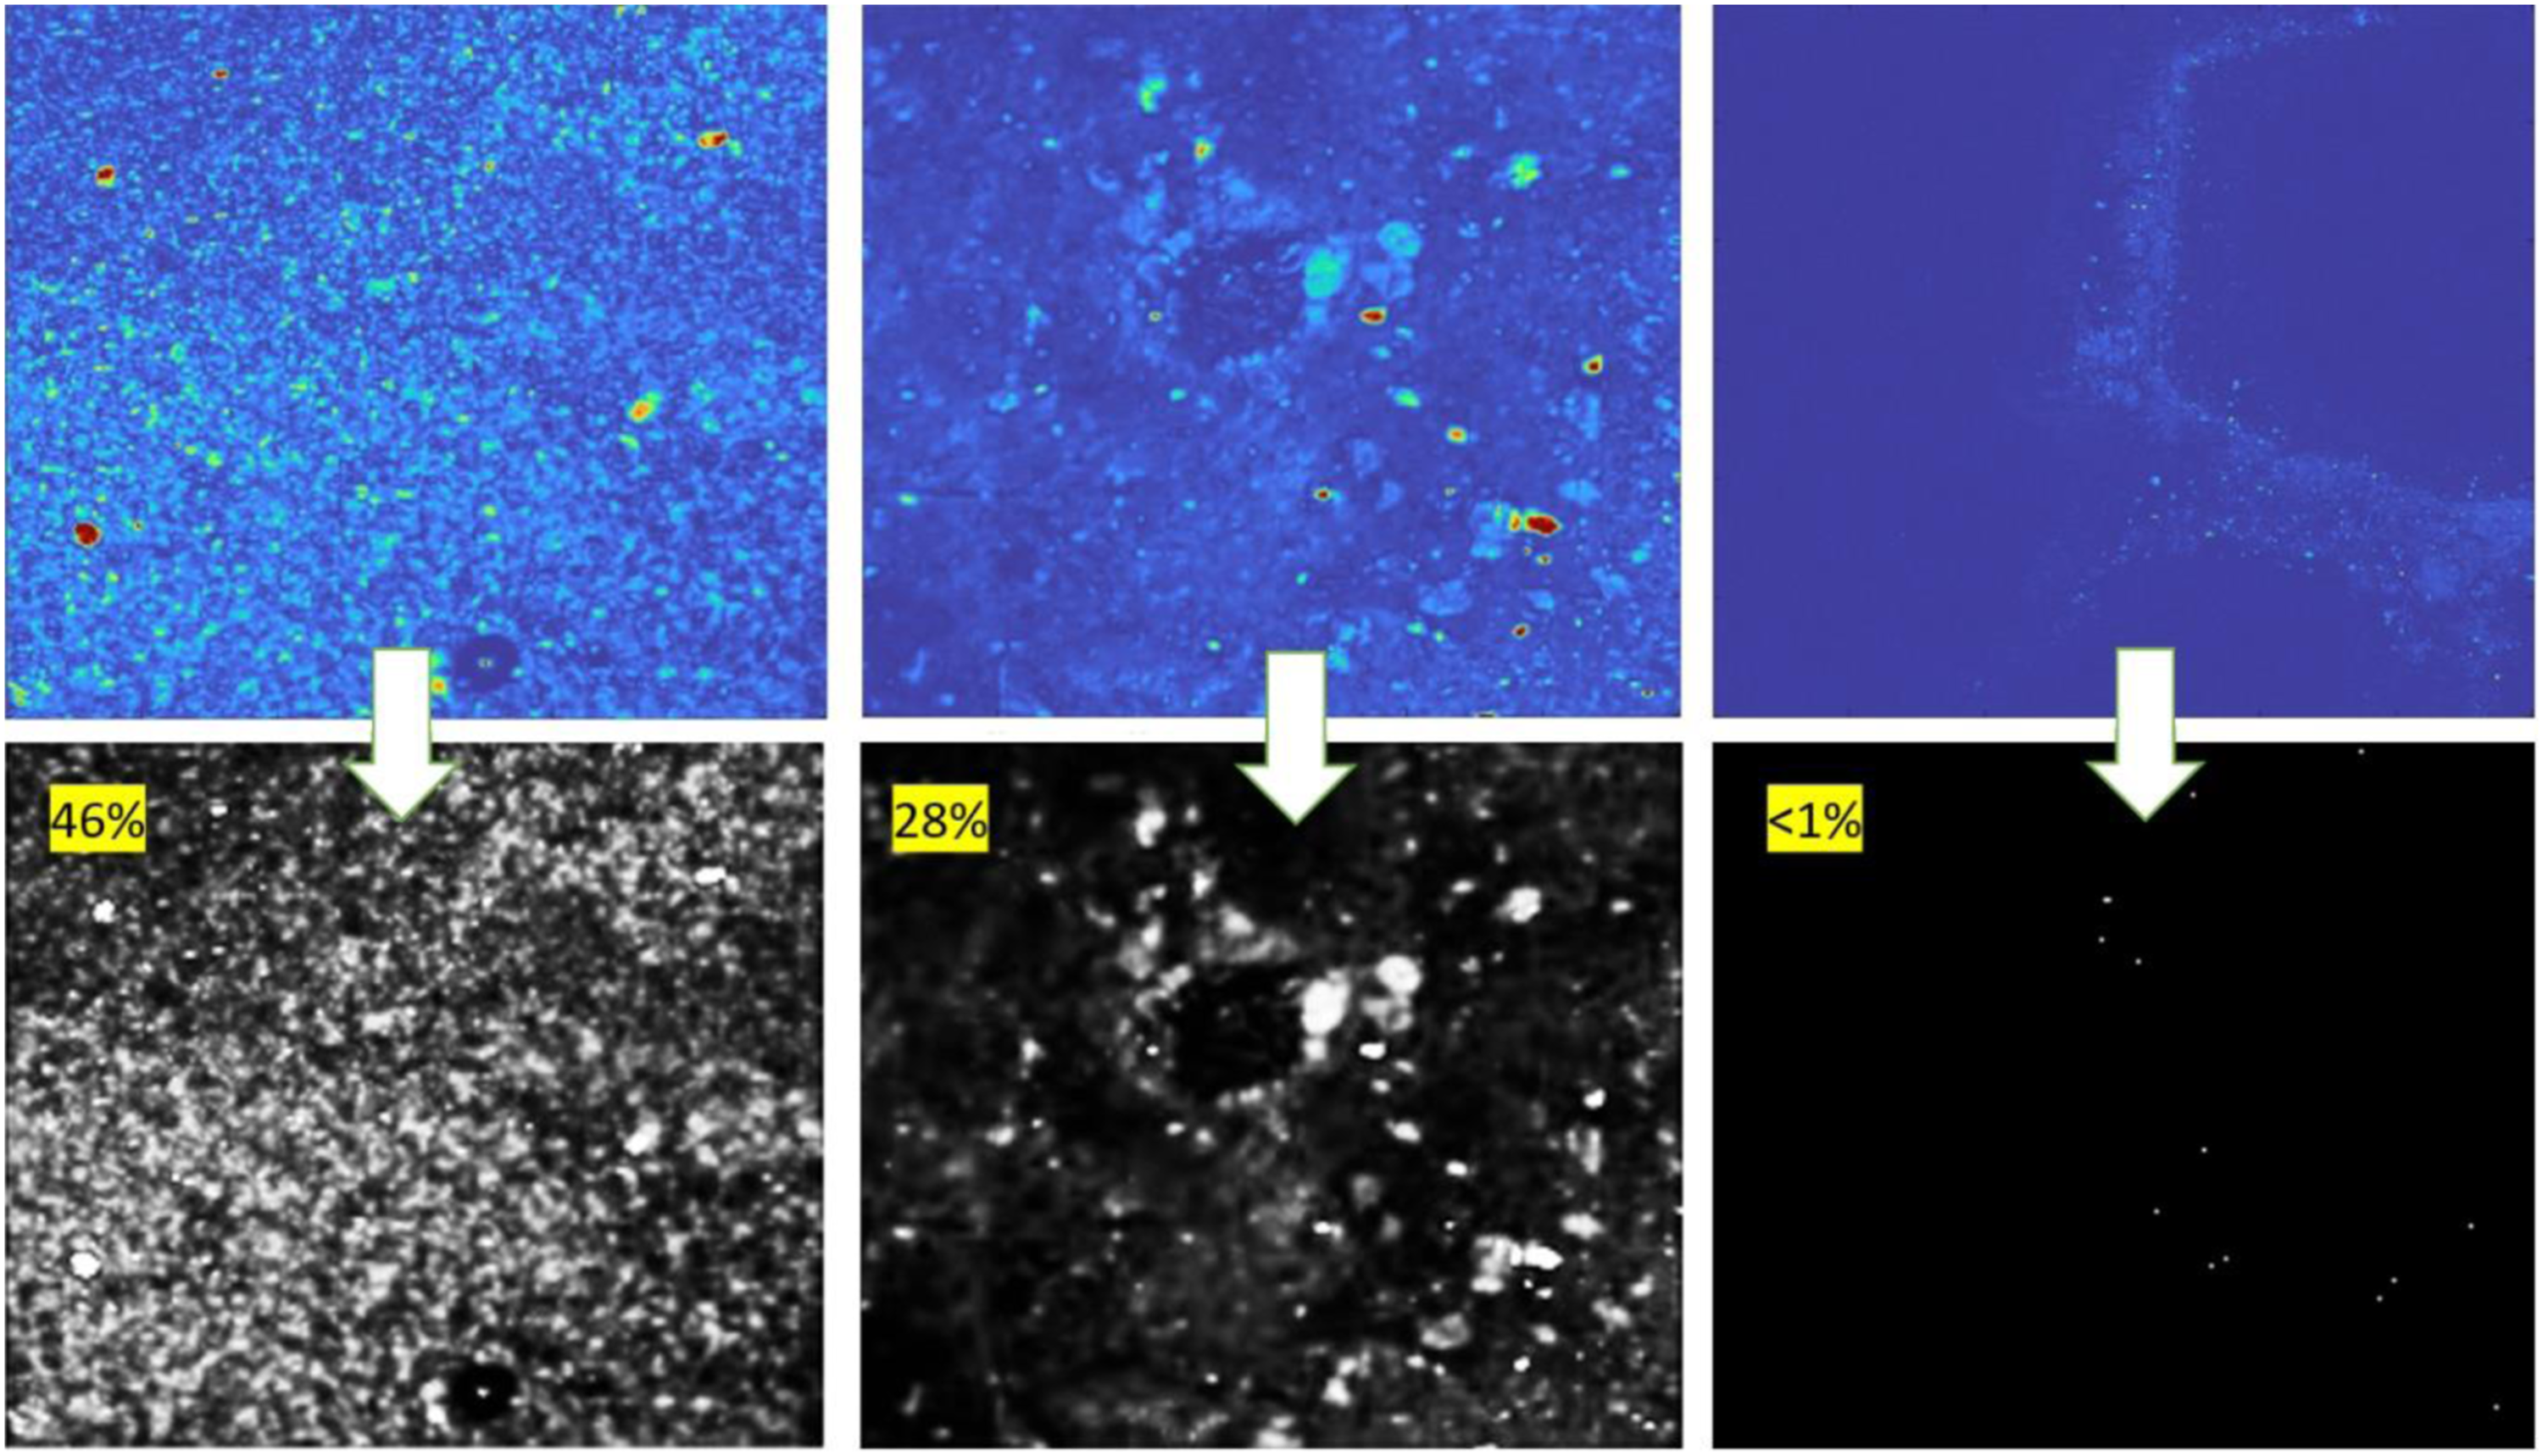

Mechanical properties of samples
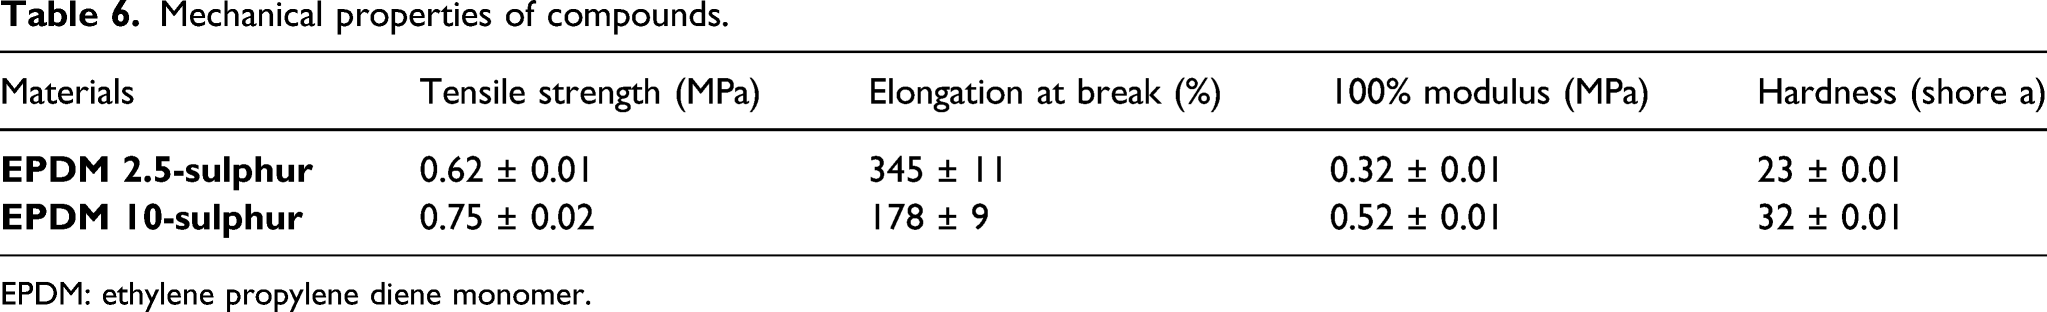
Figure 16 shows the tensile stress–strain curves of the EPDM samples having different amount of sulphur. The results obtained from tensile tests were presented in Table 6. As can be seen in Table 6 that improvement in tensile strength, 100% modulus, and hardness of EPDM samples were observed. This can be attributed to enhanced crosslink density of EPDM by the increased addition of sulphur in EPDM rubber. On the other hand, EPDM with 2.5 phr sulphur exhibited higher elongation at break value, which resulted from the less crosslink in EPDM. As the sulphur content increased from 2.5 to 10 phr in EPDM compounds, crosslink density of EPDM significantly increased; therefore, EDPM chains exhibited less flexibility. As a general conclusion, it was observed that stiffness and hardness of EPDM improved in the presence of higher content of sulphur, which was due to the formation of more crosslinks. Tensile stress-strain curves of ethylene propylene diene monomer compounds. Mechanical properties of compounds. EPDM: ethylene propylene diene monomer.
Conclusions
In this study, the crosslink density of an EPDM-based model rubber recipe was determined by conventional techniques, and the correlations between the novel FIB-SEM and SAM analyses results were investigated. It has been observed from conventional methods such as MDR, swelling test, and TSSR that crosslink density in compounds increased with increasing sulphur content, as expected. It was shown by using all three conventional measuring techniques that the crosslink density increased with the increasing sulphur content. Depending on the methodology, the increase in the crosslink density with sulphur content was 1.7 fold for the Flory–Rehner approach and 1.2 fold for both TSSR and MDR. In the FIB-SEM gallium ion milling and subsequent EDS mapping analyses, the distribution of both sulphur and Zn (in ZnO), which is known to activate the sulphur, were obtained successfully. In parallel with the conventional methods, an increase in the crosslink density was obtained with the increase in agglomeration degree of the sulphur and Zn (from ZnO). The capability of SAM in characterizing the crosslink density is represented for the first time and acoustic impedance maps display distinctive values in samples with different sulphur content. In the scans performed with SAM, it was observed that the local impedance density in the samples increased due to a rise in the crosslink density. Besides, the quantification performed through Image J analysis showed that the degree of crosslink density was found to be well-correlated with the impedance density. Although FIB-SEM-EDS processes require expertise in sample preparation and application especially for soft materials, it appears that it is a very beneficial and practical approach for crosslinked samples, in terms of achieving sub-micron image and chemical data. Accordingly, the sulphur and/or ZnO distribution and agglomeration can be monitored in any desired location and depth within the crosslinked rubber samples, using simultaneous ion section-electron imaging-elemental mapping analyses in a FIB-SEM dual-beam system. On the other hand, being a non-destructive technique, SAM is promising for rubber research by means of investigating the crosslink density without damaging the materials, finally understanding the physical and mechanical behavior of crosslinked rubber samples. The unique feature of this novel analysis method would enable to track the in-situ evolution of the crosslinking of a rubber product during the production processes. Hence, ultimately, SAM could serve for rapidly tracking the efficiency of the rubber processes. In a forthcoming paper, our research group plans to represent the evaluation of the crosslink density of a rubber product during curing via in-situ SAM analysis technique.
Footnotes
Declaration of conflicting interests
The author(s) declared no potential conflicts of interest with respect to the research, authorship, and/or publication of this article.
Funding
The author(s) received no financial support for the research, authorship, and/or publication of this article.