
Abstract
Studying the crystalline structure of uniaxially and biaxially drawn polyesters is of great importance due to their wide range of applications. In this study, we shed some light on the behaviour of PET and PEN under uniaxial stress using experimental and molecular modelling techniques. Comparing experiment with modelling provides insights into polymer crystallisation with extended chains. Experimental x-ray diffraction patterns are reproduced by means of models of chains sliding along the c-axis leading to some loss of three-dimensional order, i.e. moving away from the condition of perfect register of the fully extended chains in triclinic crystals of both PET and PEN. This will help us understand the mechanism of polymer crystallisation under uniaxial stress and the appearance of mesophases in some cases as discussed herein.
Introduction
The study of structural development in uniaxially drawn polymers is of great scientific and technical importance. Polyesters lie among those most studied polymers due to their wide range of applications and vast production worldwide. Polyethylene terephthalate (PET), Polyethylene naphthalene 2, 6 dicarboxilate commonly known as polyethylene naphthalate or PEN and their copolymers have been widely studied recently by many groups around the world. Polyester’s properties are greatly affected by the degree of orientation and crystallinity induced during its processing. Thus, the study of mechanically stretched PET and PEN in terms structure development is of major importance. Abou-Kandil et al. studied the development of microstructure in uniaxially drawn PET using wide and small angle x-ray diffraction. 1 They also studied the morphology of 50% PET/PEN random copolymer using x-ray diffraction and high-resolution scanning electron microscopy.2,3 A separate study concerned with the effect of uniaxial drawing on microhardness is published recently 4 showing the difference in behaviour between uniaxially drawn polymers and those isotropically crystallised during annealing. Other experimental and modelling studies were concerned with the development of microstructure of these polymers.5-9 Some modelling attempts were made to study the levels of structural order in crystals of PET/PEN random copolymers. 10 These models differ from those discussed previously,11-15 in which particular types of order such as sequenced matched entities, Non Periodic Layer lines, NPL crystallites, or perfect register at one single plane normal to the chain axis, have been introduced either as a consequence of the particular type of chain sorting algorithm used or by deliberate model construction.
One of the methods to understand the nature of the crystallisation process is to use molecular modelling in order to try to visualise the actual structure and orientation of the chains on the molecular level. Studies of polymer and liquid crystal polymer structures using molecular modelling have been carried out by a range of authors. One of the efficient software packages in this respect is the Cerius2 software from Accelrys®. This software has been used to model liquid crystal polymers at different length scales by Goldbeck-Wood et al. 16 It was also used by M Ishaq et al. 17 to model the structure of copolyester prepared from p-hydroxybenzoic acid, biphenol and terephthalic acid. A more recent molecular modelling study 18 compared experimental and simulated diffraction patterns and showed significant similarities for both the triclinic crystalline structures and the liquid crystalline smectic mesophase in PET.
The importance of this study is not only related to the theoretical part in terms of comparing experimental results to simulated ones, but it also clarifies the degree of chain orientation when polymers are uniaxially drawn. This plays an important role in the fusion of different polymeric parts when designing components of complex structures like joint implants, gears and high performance engineering parts that are normally manufactured under severe processing conditions.
Details of the modelling steps used in the present work is summarised in the following section, which will give an overview of the strength and effectiveness of molecular modelling to study polymer crystallisation.
Molecular modelling procedure
Molecular modelling
18
was divided into various successive steps to facilitate the simulation process as follows: The monomer units were built first using the Polymer Builder.
18
In case of PET, the model was stored in the model library, while in case of PEN, the monomer was built using the three-dimensional sketcher first and then added to the library afterwards. The energy of the built monomers was minimised using the Universal Force Field, UFF, under smart minimiser, present in the off methods menu, in order to produce the conformation that has the minimum possible energy. The UFF is a simple force field, which is recommended for simple organic molecules. The smart minimiser is the default minimiser in Cerius2 which uses a combination of methods, starting with the Steepest Descent method, followed by the Adopted Basis Newton Raphson (ABNR) method, the Quasi Newton methods, and ending with the Accurate Truncated Newton method. The details of each method (minimisation algorithm) can be found in the Cerius
2
‘Force Field-Based Simulation Manual’. It is also explained in more detail in reference.
18
The Polymer Builder interface was used to build both the homopolymers, and the copolymer. The total energy of the chain was minimised using the same procedure explained in the previous step. The Crystal Builder interface was then used to build the PEN and PET crystals according to the parameters given by Mencik
19
and Bunn et al.
20
respectively. Afterwards the visualisation option was used to visualise certain number of crystals, so that the model contains 25 chains, each is 5 monomers long. A crystalline superlattice was then built by removing the borders between the cells formed in the previous step. Using the charge equilibrium method described by Rappe and Goddard
21
the whole charge of the system was set to zero. The COMPASS (Condensed-Phase Optimised Molecular Potentials for Atomistic Simulation Studies) 98.0122-25 force field was loaded so that it can be used in the process of energy minimisation of the whole super crystal lattice. It enables accurate and simultaneous predictions of structural, conformational, vibrational and thermophysical properties of a broad range of molecules and is specially recommended for polymer systems. Using the ‘Off Instruments’ menu the energy was minimised according to the compass force field. The resulting super crystal lattice with the minimum value of energy was used to calculate the crystalline diffraction. The two-dimensional x-ray fibre diffraction patterns were calculated for the resulting supper lattice after setting the display range to be from a 2θ value of 5° to 40° in order to be comparable with the experimental results. The 2θ value is related to the d spacing and the d* (reciprocal of d) through the Bragg equation:

where d is the perpendicular spacing between the lattice planes and λ is the wavelength.
10. The X-ray value of the wavelength is set to be 1.54178 Å from a copper source. The simulated crystal diffraction is calculated as a flat plate type pattern after specifying the crystalline size in the, a, b, and c directions.
11. Two display modes can be used in displaying the two-dimensional diffraction patterns:
Simple: where reflections are shown as circles (with areas proportional to intensities). This way is mainly used to index individual reflections 18 and will not be used here.
Realistic: where reflections are smeared using crystalline size and orientation distribution value. Orientation distribution value is a value set to describe the half-width at half-height of crystalline orientation distribution; this distribution is taken to be Gaussian centred on the fibre axis. This is the mode that will be used here.
The intensity of the hkl reflection is calculated using:

where fn represents the scattering factor of atom n, and xn, yn and zn are the fractional co-ordinates to the atom n. The summation is done over all atoms in the crystalline super lattice.
12. In order to simulate the diffraction pattern from structures resembling the NPL crystallites and move the chains towards the state of register along the c-axis, the chains were moved vertically along each other using a play back script log file written precisely for this purpose.
Molecular simulation of PET and PEN
PET is one of the most commercially important polyesters. There have been many studies concerning the crystalline and oriented states of PET over a range of temperatures, draw ratios and deformation rates.26-32 Wakelyn 33 has done experiments on both PET films and fibres; accordingly he suggested that Tomasholskii and Markova 28 cell is applicable for PET film, whereas the Daubery, Bunn and Brown 20 cell is applicable for PET fibre. We will only be concerned here with the fibre crystal structure. 20
The unit cell of PEN was determined by Mencik, 19 it is also triclinic, the chains lie parallel to the c-axis and one chain passes through each unit cell. This modification is usually called the α-modification. Another modification was reported by Zachmann et al., 34 it has a triclinic unit cell, with four chains passing through each cell. The chains are not completely extended; every naphthalene ring is twisted by 180°. This modification is usually called the β-modification. 35 This paper is only concerned with the α-modification. However, the β-modification is still quite interesting to model and it is hoped to be discussed in more detail in the future. Details of the crystalline structure parameters that are used in the simulation are shown in Table 1.
Triclinic unit cell parameters for PET and PEN.

X-ray diffraction procedure
The x-ray measurements were done on a Philips PW 1729 x-ray generator using a graphite filtered copper Kα x-ray tube producing radiation with a wavelength of 1.54 Å. The measurements were made in transmission mode, using a flat plate photographic film as a detector. The sample-to-film distance was calibrated using silicon powder that gives a sharp (100) ring at a 2θ value of 28.442° (d-value of 3.135 Å).
Results and discussion
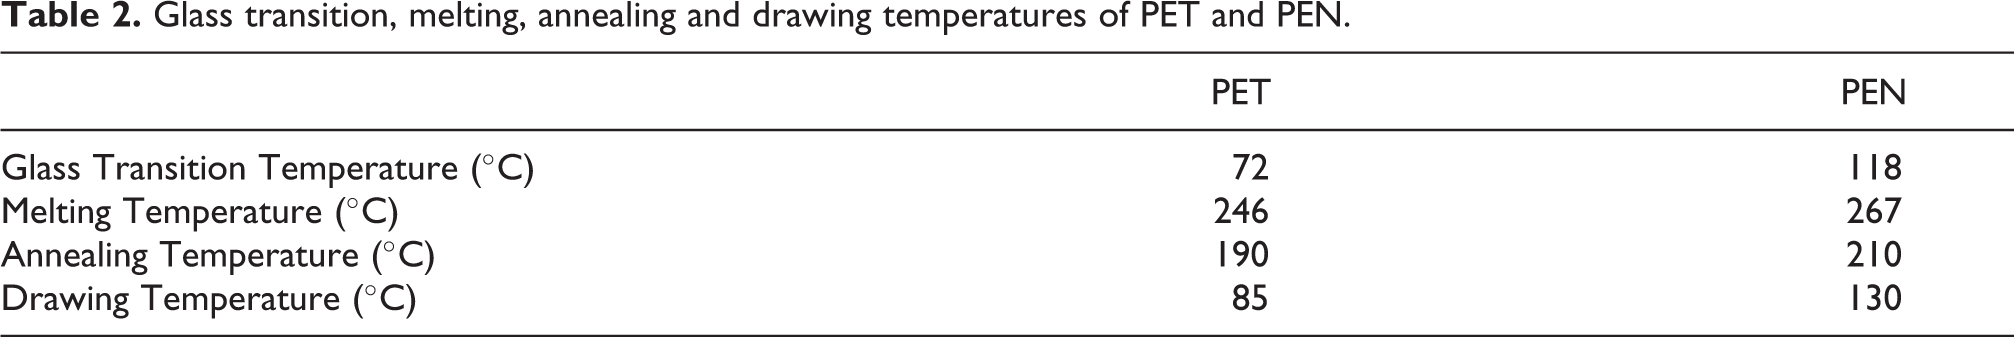
The thermal properties of PET and PEN can be found in Table 2 and more details about the experimental and theoretical calculations concerning the crystal structure and structural development can be found in references.1-6,18
Glass transition, melting, annealing and drawing temperatures of PET and PEN.
Two-dimensional x-ray diffraction patterns of PET, PEN in the α-modification and another PEN sample showing both the combination of the α- and β- modifications are shown in Figure 1.

X-ray fibre diffraction of: (a) PET fibre drawn at 85°C to an extension ratio of 95% and annealed at 190°C for 24 hours with it ends fixed; (b) PEN fibre drawn at 130°C to an extension ratio of 85% and annealed at 210°C for 24 hours with it ends fixed; (c) PEN fibre drawn at 130°C to an extension ratio of 600%. The fibre axis is vertical.
PEN has stiff polymer chains that make the chains linear without kinks as illustrated in Figure 2(a) and 2(b). The simulated diffraction pattern is shown in Figures 2(c). It can be observed that there is high resemblance between the experimental diffraction pattern, Figure 1(b), and the simulated one, Figure 2(c). This represents the condition of perfect register where all the monomers in the chain are in perfect alignment in the unit cell as represented in Figure 2. This happens when a perfect single crystal with no defects is formed. Nevertheless, at conditions prior to full extension the chains are not fully aligned in a perfect crystal. Therefore, this condition of perfect register can be relaxed by introduction of a distribution function.36-38 This strategy is applied here by gradually sliding the chains against each other from the perfect crystal register. The reflections on the layer lines start to disappear and they are smeared with each other indicating the lack of register along the c-axis. This lack of register means that there is no packing of the aromatic groups and no dipole-dipole interactions between the carboxyl groups along the chains and hence no special correlation between the monomers in adjacent chains.

(a) PEN monomer conformation after energy minimisation; (b) PEN super lattice containing one chain passing through the unit cell and composed of 5 monomers viewed along the c-axis; (c) realistic PEN fibre diffraction pattern of PEN.
By shifting the polymer chains slightly as shown in Figure 3(a) the higher layer-line reflections in the diffraction patterns starts to diffuse together, Figure 3(b). This indicates a highly disordered crystalline structure in the direction of the chain axis. The disappearance of three-dimensional order in the structure is indicated by the disappearance of the strong reflections above the equatorial. However, the three equatorial reflections are still obvious because we did not disturb the crystal order in the direction of the ‘a’ or ‘b’ crystal axis.

(a) PEN super lattice after partial movement of chains (less than one monomer length) and its realistic diffraction pattern (b); (c) PEN super lattice after movement of the chains a distance more than one monomer length and its realistic diffraction pattern (d).
Continuing to shift the chains for distances more than the length of one PEN monomer along the c-axis as shown in Figure 3(c) leads to the increased diffusion of high and low order layer-line reflections, Figure 3(d). In an earlier publication, Abou-Kandil et al. 18 showed that this kind of disorder accompanied by the stacking of the chains in an orthorhombic crystal rather than a triclinic one is the cause of appearance of the meridional smectic-A mesophase reflections in PET.
It must be noted here that in this model the first layer-line reflections appear at a d-spacing of 12.99 Å, which is higher than that obtained experimentally and reported in reference 39 to be 12.6 Å ± 0.2 Å. The difference in positions between the simulated and experimental reflections might be explained as being due to the fact that the chains in the model are fully extended but the actual chains are slightly more compressed in the c-axis as compared to the model presented here.
A similar approach is followed for building PET crystals according to Bunn et al. 20 so that only one chain passes through the cell. The molecular conformation of PET and the super crystalline lattice containing 25 chains each is 5 monomers long are shown in Figure 4(a) and 4(b). The two-dimensional diffraction pattern is shown in Figure 4(c); it shows good agreement with the experimental one shown in Figure 1(a). By sliding the chains against each other to the length of one PET monomer as shown in Figure 5(a) the higher order reflections diffuse together and lose their intensity as illustrated in Figure 5(b).

(a) molecular conformation of PET; (b) super lattice structure showing the crystal from a plane perpendicular to the y-axis; (c) realistic x-ray diffraction pattern of the PET crystal.

(a) PET super lattice after movement of the chains a distance more than one monomer length and its realistic diffraction pattern (b).
Conclusion and outlook
Molecular simulation of the diffraction patterns of fully extended PET and PEN chains is important in understanding the nature of crystallisation under uniaxial stress where polymer chains lie parallel to the draw direction. It is extremely clear that the diffraction pattern obtained from Cerius 2 agrees to a great extent with the experimental diffraction patterns obtained for PET and PEN fibres. Shifting of chains along the c-axis leads to the meridional reflections becoming more diffuse and that this is more observed in PET compared to PEN due to the existence of the kink in the PET structure. The challenge still lies ahead in modelling the crystalline structure of PEN in the β-modification with four polymer chains existing in one unit cell.
Footnotes
Declaration of conflicting interests
The author(s) declared no potential conflicts of interest with respect to the research, authorship, and/or publication of this article.
Funding
The author(s) received no financial support for the research, authorship, and/or publication of this article.