
Abstract
The objectives of this work were to formulate and optimize amlodipine besylate loaded polymeric nanoparticles by using factorial design. The emulsion solvent evaporation method was employed successfully to produce the drug loaded polymeric nanoparticles and the optimization was done by the help of the 24 factorial design. The effect of the main preparation variables on the dependent variables such as nanoparticle size and % drug entrapment efficiency was studied for the optimization of the nanoparticles. The characterization of these nanoparticles was done by the different parameters such as interaction between the excipients, size, morphology, zeta potential, % drug entrapment efficiency, % process yield, and in-vitro drug release behavior. FTIR, DLS, TEM, AFM, zeta potential studies, and dialysis bag method were performed for this purpose. The in vitro drug release data were analyzed by different kinetic models to know the release mechanism. The optimized nanoparticles were spherical in shape and showed particle size 91.5 ± 4.3 nm, PDI 0.368 ± 0.014, zeta potential −17.5 mV, % drug entrapment efficiency 74.06 ± 2.1%, and % process yield 78.51 ± 1.8%. The release kinetics studies revealed that drug release from the nanoparticles follow the Korsmeyer–Peppas model.
Keywords
Introduction
The applications of nanomaterials have become an extended field throughout the world researchers because they offer diverse novels and elite properties. 1 This research field is undergoing rapid progress and day to day new advancement. The size, the morphology, and the components are the main factors that affect the properties of the nanomaterials. 2 A fractional change in any factor may affect the properties of these materials. Presently, for drug delivery applications there are various types of nanocarrier systems being investigated and explored. The various types of nanocarriers namely polymeric nanoparticles, polymeric micelles, niosomes, nanoemulsions, nanosuspension, lipid nanoparticles, liposomes, and nanogels have been utilized to deliver different active compounds. 1
The recent scenario is that researchers have focused on the use of polymeric nanoparticles for drug delivery because they have the capability to control the issues such as cell permeability, poor drug solubility. 3 The stability, suitable size, appropriate drug release, easy preparation, and storage are some unique properties of polymeric nanoparticles which make them excellent carriers among all drug delivery systems. 4 Now the use of biodegradable polymers in the production of polymeric nanoparticles is continuously increasing. 5 Different biodegradable polymers such as poly-(ε-caprolactone), 6 chitosan, 7 polylactic acid (PLA), 8 polyglycolic acid (PGA) and their copolymers poly (lactic-co-glycolic) acid (PLGA), 9 etc. are commonly used for this purpose.
PLGA is the most commonly used synthetic polymer and has been approved by the US FDA and EMA for use in various drug delivery systems in humans.10-12 Good biodegradability, good biocompatibility, low cytotoxicity, and easy preparation methods are some of its attractive features that support its use as an excellent carrier for drug delivery.13, 14 Its hydrolysis produces lactic and glycolic acids that are endogenous and are metabolized by the body through the Kreb’s cycle resulting in minimal systemic toxicity. 15 Commercially it is available with different molecular weights and different copolymer compositions. 16 The literature survey suggests that emulsion-solvent evaporation techniques 1 and nanoprecipitation techniques 17 are the most commonly used techniques for the preparation of drug-loaded PLGA nanoparticles. Various polymers are used as stabilizers to prevent aggregation of PLGA nanoparticles. 5
Worldwide, increased blood pressure is the major risk factor for premature death, stroke, and heart disease. In the year 2000, it was estimated that around one billion people all over the world have high blood pressure and it was predicted that it will increase to 1.56 billion by 2025.
18
Amlodipine besylate (Figure 1) is chemically (4R, S)-3-ethyl-5-methyl 2-(2-amino-ethoxy-methyl)-4-(2-chlorophenyl)-1,4-dihydro-6-methyl pyridine-3,5-dicarboxylate monobenzene sulphonate. It is a IIIrd generation dihydropyridine calcium channel blocker.
19
It is a widely prescribed medication for the treatment of hypertension, some types of angina, coronary heart failure, and cardiac arrhythmias.
20
It is slightly soluble in water and according to the biopharmaceutical classification system (BCS), it belongs to class II. Chemical structure of amlodipine besylate.
In the traditional way, optimization is done by varying one factor at a time, keeping all other factors constant. Therefore, it requires more time, effort, and material. And it is difficult to get an ideal formulation in this way because the combined effects of the independent factors cannot be measured. Factorial design is a valuable technique used to overcome these problems of optimization and is an efficient tool for obtaining a suitable mathematical model with minimal experiments. Optimization based on factorial design allows all factors to be varied simultaneously, thus evaluating the effects of each variable at each level and expressing the interrelationships between them. 21
The objectives of this work were to prepare, amlodipine besylate loaded polymeric nanoparticles for oral administration using the emulsion solvent evaporation method. Their formulation variables were statistically optimized using 24 factorial design. The characterization of optimized formulations was done by the different parameters such as interaction between the excipients, size, shape, zeta potential, % drug entrapment efficiency, and % process yield. The selected different formulations were analyzed for in vitro drug release, and the drug release data were fitted to different models such as zero order, first order, Hixson–Crowell model, Higuchi model, and Korsmeyer–Peppas model to know the mechanism and drug release kinetics.
Experimental
Materials
The polymer used was PLGA (RESOMER® RG 504) gifted from Evonik, Mumbai, Maharashtra (India), which has a copolymer ratio of 1:1 of dl-lactide to glycolide with relative molecular mass range is 38,000–54,000 and inherent viscosity is 0.45–0.60 dl/g. Amlodipine besylate pure drug form was received as a gift sample from IPCA Ltd., Mumbai, Maharashtra (India). The polymer PVA used as a surfactant, which was purchased from Sigma Aldrich, New Delhi (India). A dialysis membrane bag (pore size 2.4 nm, molecular weight cut off 12,000−14,000 Da) was obtained from Hi-Media, Mumbai, Maharashtra (India). Milli-Q quality purified water was used during the entire experiment and all other chemicals were of AR grade.
Preparation of amlodipine besylate loaded polymeric nanoparticles
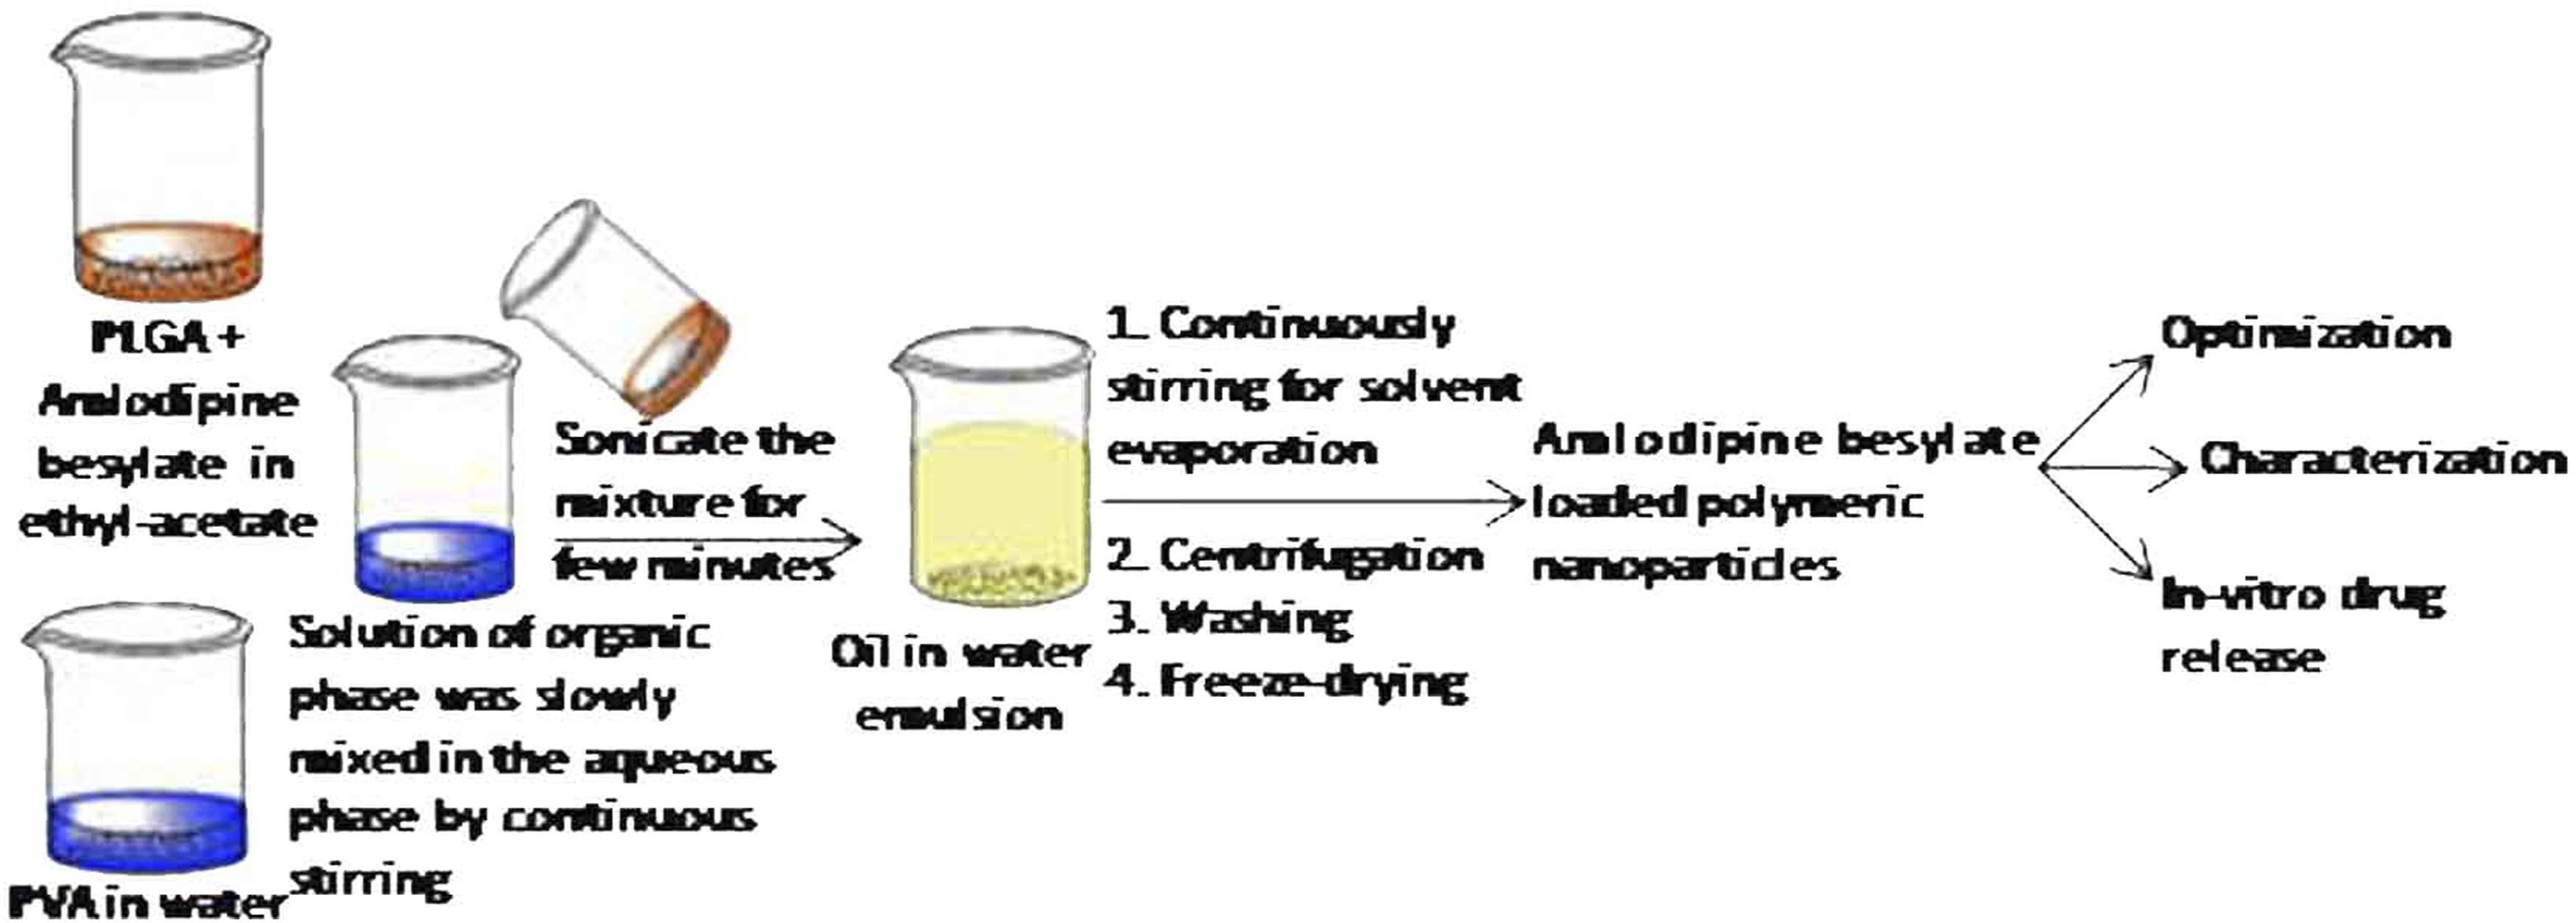
The amlodipine besylate loaded polymeric nanoparticles were prepared by an emulsion solvent evaporation method. 1 In brief, typical amounts of PLGA and amlodipine besylate were added into solvent (ethyl-acetate). It was suitably stirred to dissolve the whole amount of the drug and polymer in the solvent. Then, the organic phase solution was slowly mixed into the continuously stirred aqueous solution of PVA. This mixture was sonicated by a microtip probe sonicator (Soniweld Probe Sonicator, Imeco Ultrasonics, India; a continuous mode energy output 55 W) for a couple of minutes. To evaporate the organic solvent from the formed oil in water emulsion, it was smoothly stirred at room temperature by a magnetic stirrer (Remi, India) for 5–6 h. The formed nanoparticles were recovered by centrifugation by using ultracentrifuge (WX ultra 100 ultracentrifuge Thermofisher Scientific USA) at 22,000 rpm for 20 min, and washed with purified water repeatedly to remove the surfactant. After the purification these nanoparticles were freeze-dried (YSI-250, Yorco Freeze Dryer (Lyophilizer), Yorco Sales Pvt. Ltd., India) to get the fine powder of nanoparticles, which were placed in a vacuum desiccator.
Factorial design and optimization
Different parameters used for 24 factorial design.

The formulation design was generated by using Design Expert Software (Version 9.0.0).
Characterization
Fourier transforms infrared (FTIR) spectroscopy
The potential interactions between formulation components were assessed by FTIR. The FTIR spectra of the PLGA, amlodipine besylate, and amlodipine besylate loaded polymeric nanoparticles were recorded on potassium bromide plates in the scanning range of 4000 cm−1 – 400 cm−1. The FTIR-8400S Fourier Transform Spectrophotometer (Shimadzu, India) was employed for this purpose.
Determination of particle size and zeta potential
The size and zeta potential analysis of polymeric nanoparticles were performed by dynamic light scattering (DLS) using a Zetasizer (Malvern Instruments, UK; Model- ZEN 3600). The lyophilized dried samples dissolved in purified water and sonicated for few seconds before analysis. The obtained homogeneous suspension was examined for the mean diameter (size) and zeta potential.
Surface morphology
The transmission electron microscopy (TEM) and atomic force microscopy (AFM) was used to determine the morphology of the amlodipine besylate loaded polymeric nanoparticles. TEM analysis was done by using an instrument (TECNAI 200 KV TEM (Fei, Electron Optics) Japan) for the examination of the shape and size of drug-loaded nanoparticles. For TEM analysis, a drop of the sample was placed on a Copper grid and then stained with 2% (w/V) phosphotungstic acid solution, and then the image was captured.
AFM was also used to examine the surface morphology. Atomic Force Microscope (INNOVA, ICON Analytical Equipment, Bruker, India) operating under the Acoustic AC mode (AAC or Tapping mode), with the aid of a cantilever (NSC 12(c) from MikroMasch, Silicon Nitride Tip) by NanoDriveTM version-8 software. The 2.0 N/m force constant was applied, while the resonant frequency was 284.60 kHz. The scanning was performed at room temperature, with the scan speed of 1.5–2.0 lines per second. The Nanoscope Analysis software was used for data analysis. The sample coated substrates were dried at the dust-free space under 60 W lamp for 6 h followed by high vacuum drying and subsequently examined under AFM.
Drug entrapment efficiency and process yield
Nanoparticles were separated from the dispersion by centrifugation and the obtained supernatant was suitably diluted and analyzed for the free drug (amlodipine besylate) by a double beam UV-Visible spectrophotometer (Model No.-2201, Shimadzu, India) at 247.2 nm. The percentage of entrapment efficiency was calculated as

In-vitro drug release study
Analysis of the in-vitro drug release study of drug loaded polymeric nanoparticles was done by a dialysis bag diffusion method. 22 Samples were suspended in 5 ml phosphate buffer solution (pH 7.4) and it was kept in a dialysis bag and tied at both ends. It was immersed in a receptor compartment containing 100 ml of phosphate buffer (pH 7.4) stirred at 100 rpm and maintaining temperature 37 ± 1°C. To prevent evaporation of the medium receptor compartment was covered by the aluminum foil. 2 ml of the aliquots were withdrawn at various time intervals and replaced with a fresh volume of phosphate buffer, diluted appropriately. The concentration of the drug was measured by UV-Visible spectrophotometer at 247.2 nm. The experiments were performed in triplicate.
In-vitro drug release kinetics
It is extremely important to study drug release kinetics and their mechanisms that describe the characteristics of the carrier system. To know the kinetics and mechanism of drug release from nanoparticles, in-vitro drug release data were fitted to different kinetic models,
23
which are as the zero-order model (Eq. 3), the first-order model (Eq. 4), the Hixson–Crowell model (Eq. 5), the Higuchi model (Eq. 6), and the Korsmeyer–Peppas model (Eq. 7)


Result and Discussion
Preparation and optimization by factorial design


Experimental design and parameters for 24 factorial design for prepared formulations F1 to F16.

From equation (8) it was clear that polymer amount in mg (B) and surfactant concentration in % w/V (C) has a positive impact on particle size, that is, the particle size increased with an increase in polymer amount and surfactant concentration. The polymer concentration (B) has a positive effect on particle size; a possible reason for the positive effect could be that during emulsification, increasing polymer concentrations increased the viscosity of the organic phase which led to the formation of bigger size nanodroplets. Further, the increasing viscosity could hinder the rapid dispersion of polymer solution into the aqueous phase, resulting in larger droplets which formed larger nanoparticles after the solvent evaporation. The effect of polymer concentration on nanoparticles size was found to be in line with the previously mentioned literature.24,25 The positive impact of surfactant concentration (C) can be explained on the basis that the main function of surfactant molecules is to provide stability to the emulsion nanodroplets and prevent them from coalescing with each other. Thus, a minimum number of surfactant molecules are required to attain small-sized nanoparticles. As the surfactant concentration increases, the viscosity of the aqueous phase increases, the increased viscosity opposes the net shear force applied by sonication to droplet breakdown, which results in larger size nanoparticles. Previous authors have reported similar results for PLGA nanoparticles using PVA as a surfactant.15, 26
The negative signs for coefficients A and D in equation (8) indicate that the particle size decreases with an increase in sonication time (A) and an increase in the volume of organic solvent (D). The negative effect of factor (A) on nanoparticles size can be interpreted in such a way that the basic step of the emulsion solvent evaporation technique is the application of energy to get the emulsion and it is provided by sonication. Increasing the sonication time provides higher energy thus producing smaller sized nanoparticles. The same has been reported in the literature. 24 Increasing the volume of the organic solvent reduces the particle size because large amounts of organic solvent are available for diffusion into the oil/water emulsion, which prevents the correlation of droplets. 25 Thus factor (D) has a negative effect on nanoparticles size.
However, in equation (9) the positive sign for the coefficient B and D showed that the % entrapment efficiency can be increased by an increase in B and D, but whereas the negative sign for the coefficient C showed that the % drug entrapment efficiency increases by the decrease in C. In the polynomial equation (9), the coefficient of (A) is very small, so it can be neglected compared to the other three, implying that the sonication time has no significant effect on the % drug entrapment efficiency. The polymer concentration (B) has a positive impact on % entrapment efficiency because increasing the polymer concentration increases the viscosity of the organic phase. It increases the resistance for the drug molecules from the organic phase to the aqueous phase causing more drug molecules to be entrapped in the polymer nanoparticles. 27
Increasing surfactant concentration (C) reduces the % drug entrapment efficiency because, with increased surfactant concentration, more drug molecules can rapidly partition out into the aqueous phase during the emulsification process. Due to this fewer drug molecules are available in emulsion droplets to interact with PLGA molecules. Similar results have reported earlier. 28 Factor (D) shows a positive effect on % drug entrapment efficiency because amlodipine besylate is a hydrophobic drug and its solubility increases when the volume of organic solvent increases. In the emulsification process, a greater number of drug molecules interact with nanodroplets, thereby increasing the % drug entrapment efficiency.
These polynomial equations (8) and (9) were utilized for justification of the experimental design. Design-Expert software 9.0.0 provides the three-dimensional response surface plots resulting from polynomial equations, which are represented in Figures 2 and 3 for particle size and % drug entrapment efficiency, respectively. These plots are helpful in understanding the combined effect of two variables on the dependent variable at a time and can also predict their responses at intermediate levels.
29
Three-dimensional response surface plots depicting the effects of (a) polymer amount in mg (B) and sonication time in min. (A); (b) volume of organic solvent in ml (D) and sonication time in min. (A); (c) volume of organic solvent in ml (D) and polymer amount in mg (B); (d) surfactant concentration in % w/V (C) and sonication time in min. (A); (e) surfactant concentration in % w/V (C) and polymer amount in mg (B); (f) volume of organic solvent in ml (D); and surfactant concentration in % w/V (C) on the particle size (Y1). Three-dimensional response surface plots illustrating the effects of (a) polymer amount in mg (B) and sonication time in min (A); (b) sonication time in min (A) and volume of organic solvent in ml (D); (c) polymer amount in mg (B) and volume of organic solvent in ml (D); (d) sonication time in min (A) and surfactant concentration in % w/V (C); (e) polymer amount in mg (B) and surfactant concentration in % w/V (C); (f) surfactant concentration in % w/V (C) and volume of organic solvent in ml (D) on the % drug entrapment efficiency (Y2).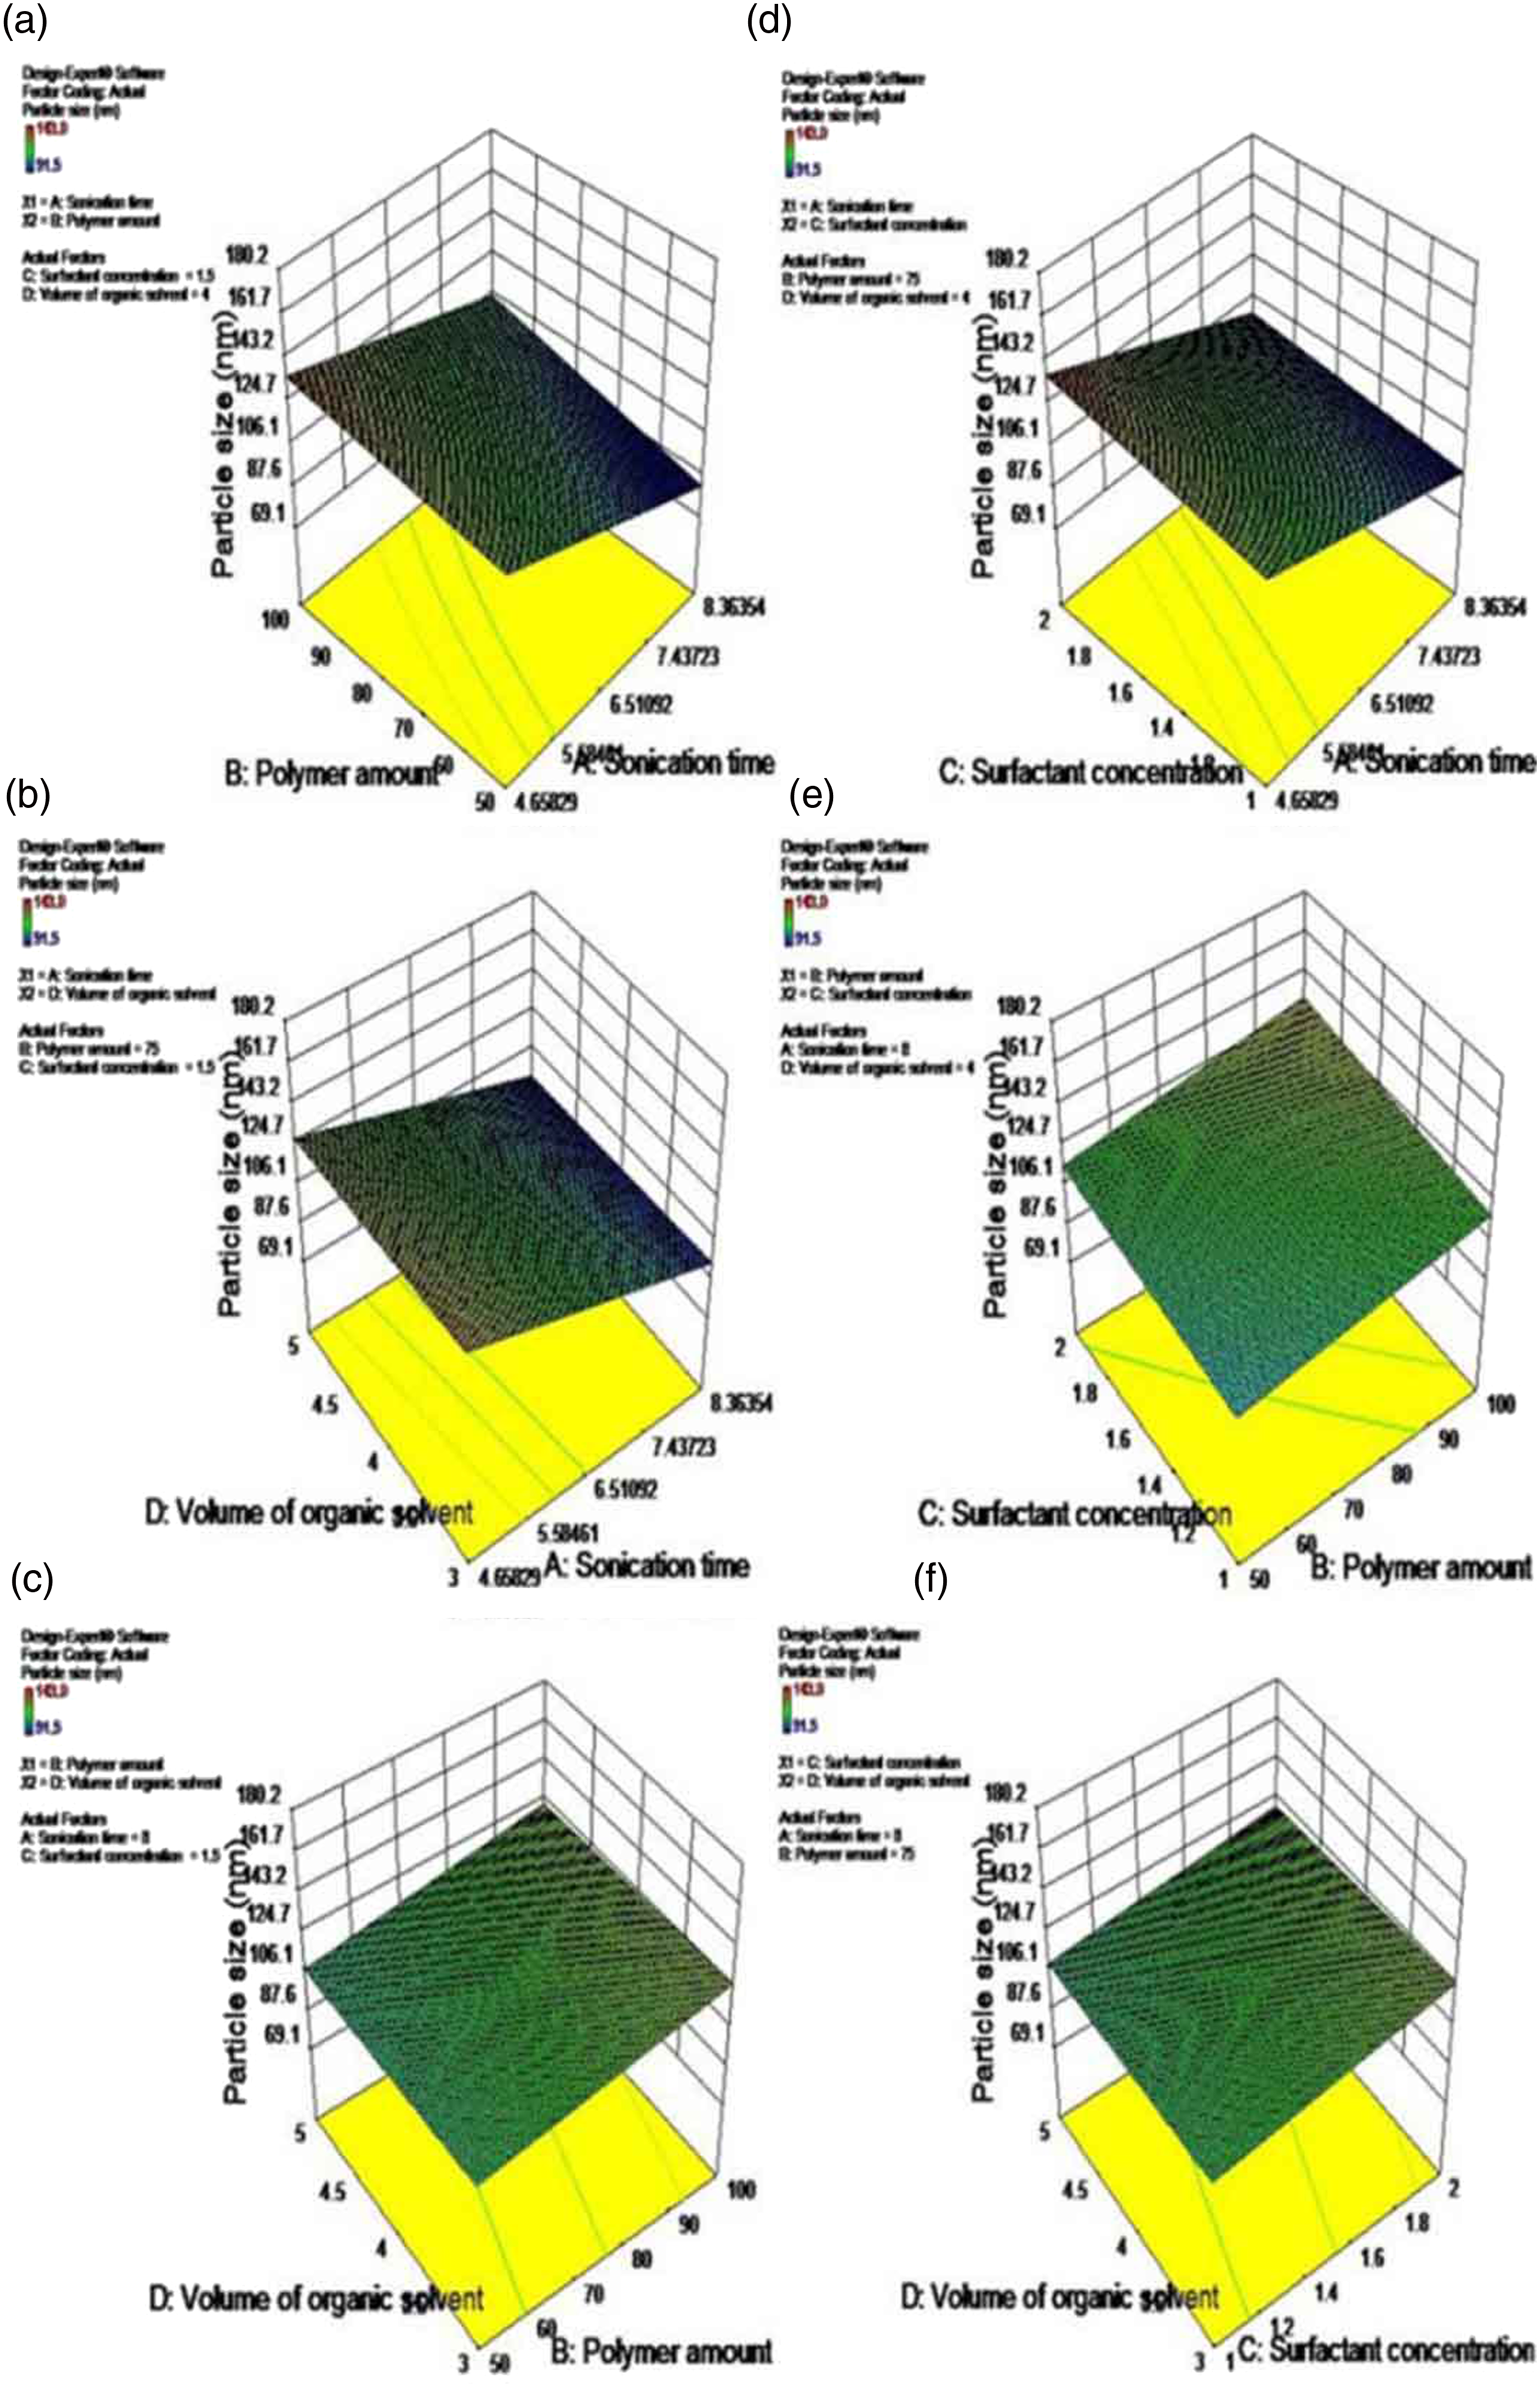

Analysis of variance (ANOVA) for 2FI (interaction) model.

Characterization
FTIR
FTIR analysis is an important spectroscopic technique that is used to identify chemical molecules and their interactions with each other.
30
The spectra for PLGA (Figure 4a) show peaks at 3358.18 cm−1 for O-H stretching, at 2949.63 cm−1 for C-H stretching, at 1764.56 cm−1 which is its characteristic peak due to the stretching of the carbonyl group, and at 1096.58 cm−1 for C-O stretching. The spectra for amlodipine besylate drug (Figure 4b) show peaks at 2964.69 cm−1 for C-CH3 stretching, at 1698.53, 1676.11 cm−1 for ester C=O stretching, at 1493.92 cm−1 for aromatic skeletal stretching, at 1205.55 cm−1 for Sulfonate (S=O) asymmetric stretching, at 1095.13 cm−1 for C-Cl stretching and at 710 cm−1 for C-H bending aromatic. The FTIR spectra of amlodipine besylate loaded polymeric nanoparticles of preferred formulation F7 (Figure 4c), shows characteristic peaks of both polymer and drug with no major shifting as well as no loss of functional peaks. The spectral study indicates that there is no significant molecular interaction between PLGA and amlodipine besylate that could change the chemical structure of the drug. FTIR spectrum of (a) PLGA (b) amlodipine besylate and (c) amlodipine besylate loaded polymeric nanoparticles of preferred formulation F7.
Particle size and zeta potential
The amlodipine besylate loaded polymeric nanoparticles were uniform, discrete, and <150 nm in the size range. The range of particle size was found 91.5 ± 4.3 nm to 143.0 ± 3.5 nm and the PDI was in the range 0.116 ± 0.009 to 0.392 ± 0.011. The particle size and PDI results of all the formulations (F1 to F16) of amlodipine besylate loaded polymeric nanoparticles are summarized in Table 2. All these formulations have particle size in nanometer range with low value of PDI. The optimized formulation F7 had particle size as 91.5 ± 4.3 nm, 0.368 ± 0.014 PDI and zeta potential was −17.5 mV. The high negative charge of the zeta potential indicates that electrostatic repulsion between particles of similar electric charge will prevent the aggregation of particles and may stabilize them.
31
Zeta potential values in the range −15 mV to −30 mV are common for PLGA nanoparticles.
32
The DLS image and zeta potential graph of optimized formulation F7 is shown in Figures 5a,b. (a) DLS image of preferred formulation F7. (b) Zeta potential graph of preferred formulation F7.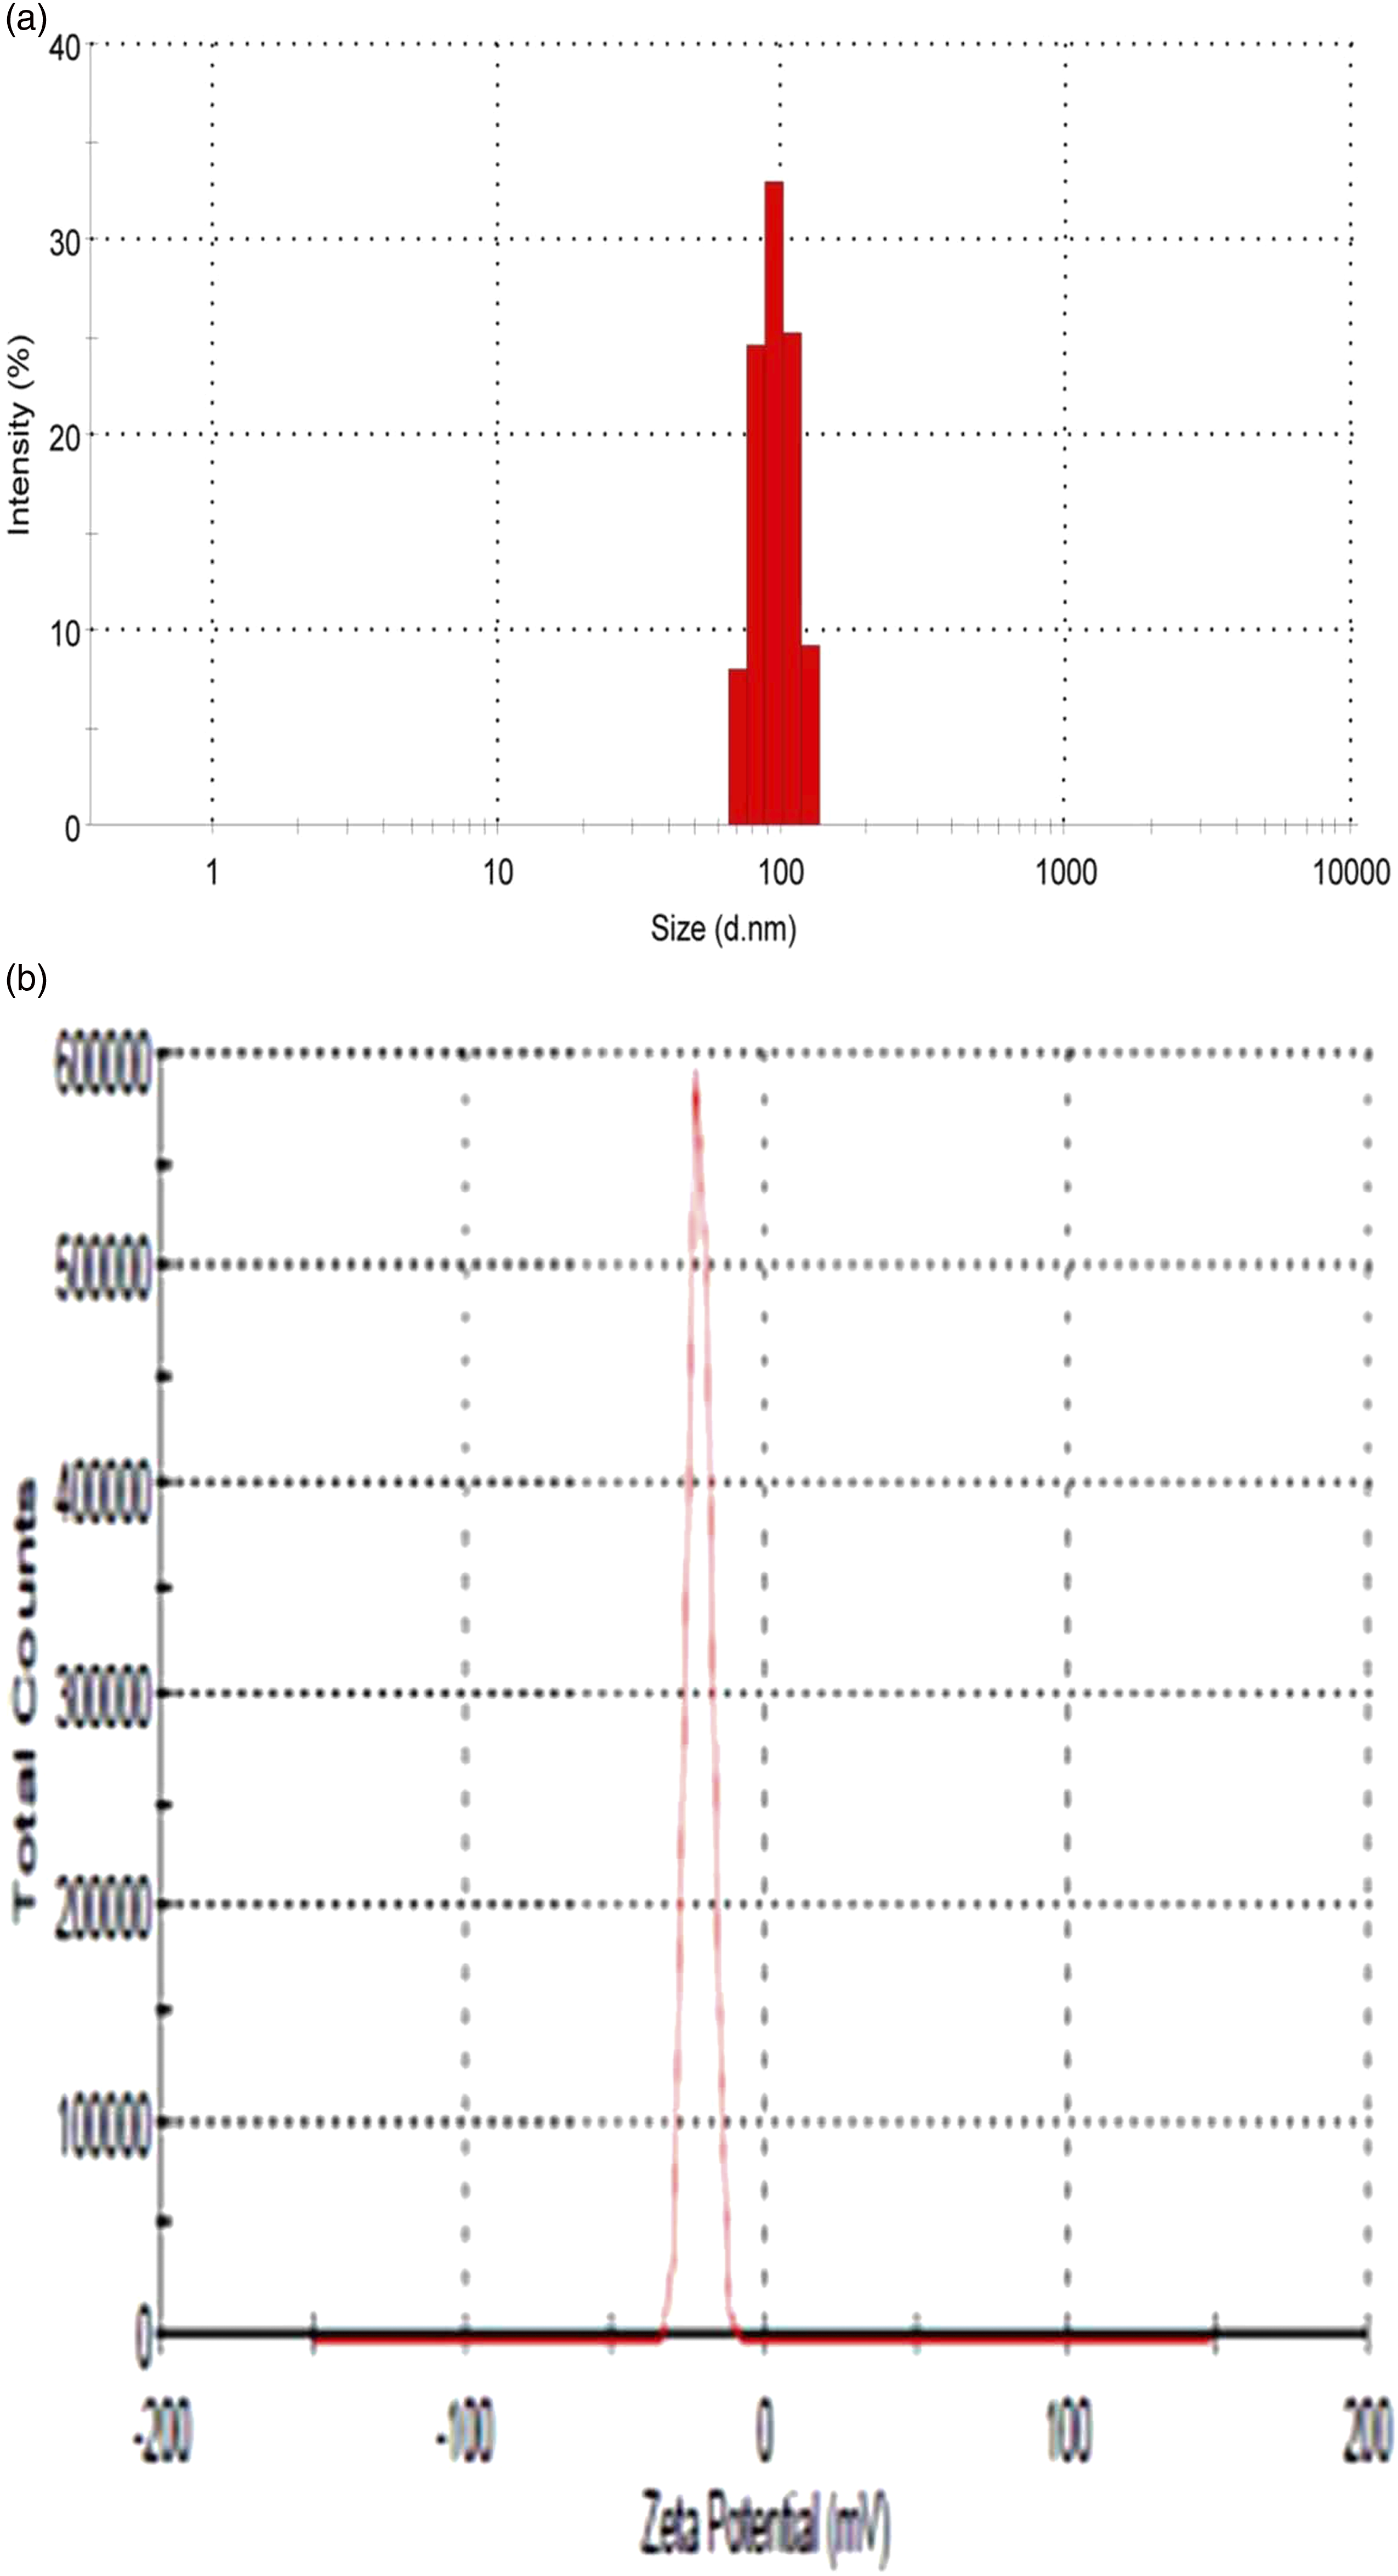
Surface morphology
The surface morphology of nanoparticles is another important parameter, which influences the drug release and drug absorbance properties. The evaluation of the surface morphology of the prepared formulations was done by the help of TEM and AFM analysis. Examination of TEM images of the prepared nanoparticles revealed that these were spherical and surfaces were smooth. TEM images of formulation F7 were presented in Figure 6a. The spherical shape of these nanoparticles is confirmed by the AFM analysis. The AFM image of the preferred formulation F7 was illustrated in Figure 6b and its 3D view in Figure 6c. The average particle size for preferred formulation F7 was also analyzed by TEM and AFM analysis which was 80.9 ± 5.8 nm. The size obtained by DLS analysis was higher because in this technique hydrodynamic size was measured. (a) TEM image of preferred formulation F7. (b) AFM image of preferred formulation F7. (c) 3D view of AFM image of preferred formulation F7.
Entrapment efficiency and process yield
The % drug entrapment efficiency of the formulations was in the range, 67.15 ± 3.4% to 76.18 ± 1.2%. Formulation F2 containing −1 value of sonication time in min, −1 value of polymer amount in mg, +1 value of surfactant concentration in % w/V of the aqueous phase, and −1 value of the volume of organic solvent in ml was found to possess lowest % drug entrapment efficiency and formulation F11 containing −1 value of sonication time in min, +1 value of polymer amount in mg, −1 value of surfactant concentration in % w/V of the aqueous phase, and +1 value of the volume of organic solvent in ml had highest % drug entrapment efficiency. The % drug entrapment efficiency of preferred formulation F7 containing +1 value of sonication time in min, −1 value of polymer amount in mg, −1 value of surfactant concentration in % w/V of the aqueous phase, and +1 value of the volume of organic solvent in ml had 74.06 ± 2.1%.
To check the efficiency of the preparation method it is necessary to check the process yield. If the process yield is greater than 50%, then it is suitable for prepared formulations. 33 The process yield values for all the formulations are given in Table 2. This was found in the range from 70.16 ± 2.8% to 82.64 ± 0.9%. The formulation F12 shows the highest process yield 82.64 ± 0.9% and formulation F14 shows a low value of process yield as 70.16 ± 2.8%. This demonstrates the suitability of the method for prepared formulations.
In-vitro drug release study
The in-vitro drug release studies were done by using the dialysis bag method. The drug release profile of the amlodipine besylate loaded polymeric nanoparticles for the different formulation is presented in Figure 7. This depicts the drug release profile for selected formulation such as for the formulation F11 and F2 had highest and lowest % drug entrapment efficiency, respectively; F7 and F10 possess lowest and highest particle size, respectively, and formulation F14 and F12 had the lowest and highest process yield, respectively. All of these formulations showed a biphasic release profile, initial burst release, and followed by sustained release. The preliminary fast release was due to the adsorbed drug molecules in the exterior of the nanoparticles. These drug particles on the surface dissolve immediately as they enter the medium.
34
Thereafter, the release rate decreased that reflects the release of drug entrapped in the polymer. It is assumed that the rate of release at this stage is to be controlled by the diffusion rate of the drug in the polymer matrix.
35
In vitro drug release of amlodipine besylate from nanoparticles for selected formulations (a) F2, (b) F7, (c) F10, (d) F11, (e) F12, and (f) F14.
In-vitro drug release kinetics
Release parameter for amlodipine besylate loaded polymeric nanoparticles of selected formulations obtained by fitting in-vitro drug release data to different models for drug release kinetics.

On the basis of best fit with the highest correlation (R2) value, it is concluded that the all selected formulations (F2, F7, F10, F11, F12, and F14) of nanoparticles follow the Korsemeyer–Peppas model. For preferred formulation F7 correlation value R2 = 0.97997 and release exponent value n = 0.679. The magnitude of the release exponent n indicates that the release mechanism is an anomalous transport or non-Fickian diffusion, which is related to a combination of both diffusion of the drug and dissolution of the polymer. 36
Conclusions
In this work, amlodipine besylate loaded polymeric nanoparticles were successfully prepared by an emulsion solvent evaporation method using biodegradable polymer PLGA. Different preparation variables such as sonication time, polymer amount, surfactant concentration, and volume of organic solvent were optimized by using factorial design. A 24 factorial design was applied to identify the optimal formulation parameters for nanoparticle preparation with minimum particle size and high drug entrapment efficiency with high process yield. Analysis of morphology confirmed that the nanoparticles were spherical with nearly smooth surface. The preferred formulation F7 have particle size as 91.5±4.3 nm, PDI as 0.368±0.014, zeta potential as −17.5 mV, 74.06 ± 2.1% drug entrapment efficiency, and 78.51 ± 1.8% process yield. In vitro release studies indicated non-Fickian or anomalous type of transport for the release of amlodipine besylate from the nanoparticles. Further in-vivo studies are necessary in order to support the findings.
Supplemental Material
sj-pdf-1-ppc-10.1177_09673911211056154 – Supplemental Material for Formulation, optimization, and characterization of amlodipine besylate loaded polymeric nanoparticles
Supplemental Material, sj-pdf-1-ppc-10.1177_09673911211056154 for Formulation, optimization, and characterization of amlodipine besylate loaded polymeric nanoparticles by Vibha Chourasiya, Sarvesh Bohrey and Archna Pandey in Polymers and Polymer Composites
Footnotes
Declaration of conflicting interests
The author(s) declared no potential conflicts of interest with respect to the research, authorship, and/or publication of this article.
Funding
The author(s) received no financial support for the research, authorship, and/or publication of this article.
Supplemental material
Supplemental material for this article is available online.