
Abstract
Composite materials were prepared using epoxy as a matrix and nanoclay as a reinforcement with weight fractions 5% and 10%, using hand lay-up as a preparation technique. An unreinforced epoxy cast was also prepared for comparison. Heat and acoustic insulation were studied, in addition to tensile, compression, and impact tests. The results showed that the sound levels were the highest in the unreinforced specimen, and decreased gradually with nanoclay, suggesting that the nanoclay have impeded the path for sound waves transmission. The same behavior was observed with thermal conductivity. The tensile strength for the 5% wt. specimens were about 40% higher than that of the 10% wt. specimens, and about 60% higher than the unreinforced epoxy. The Young's modulus was 1.899 MPa, 3.25 MPa, and 4.143 MPa for the 5%, 10%, and unreinforced epoxy, respectively. Impact and compressive strengths were directly proportional with nano clay content. Scanning electron microscopy was used to reveal the microscopic details. The results prove that the addition of nanoparticles must be optimized to get the desired results.
Introduction
The use of nanoclay as a reinforcement for polymeric composites has attracted a great deal of interest, since only a small addition is sufficient to enhance the properties, 1 with montmorillonite being the most used type of nano clay because of its relatively high aspect ratio and commercial availability. 2 Nanoclays is part of a large collection of clays that consist of hydro silicates with sheet-shaped structure arranged one over the other, giving it the shape of flakes. Epoxy resin is a highly efficient and commercially available polymer that has a wide range of desired properties, making it useful as a matrix for polymer composites. 3
Many works have been conducted to study nanoclay/polymer composite materials. In 2011, Mo-Lin C. et al. studied the different mechanisms that may interpret the increase in mechanical properties of the nano clay reinforced polymers. Their efforts focused on the many attempts the researchers carried out to achieve maximum homogeneity and even distribution of the nanophase all over the polymer matrix. The researchers used a rotating pump to facilitate the removal of trapped air bubbles in the polymer/nanoclay mixture, which led to a highly dispersed and evenly distributed nanophase in epoxy, with an improvement in mechanical properties (tensile strength and Young’s modulus) up to 25% and 34%, respectively. 1 Nano clays were added to (polyamide/polypropylene) blend in a weight fraction of 5%, in the melt blending process of the aforementioned polymers. The specimens underwent several tests: X-ray diffraction, scanning and transmission electron microscope, and rheology. The results showed higher dispersion of both types of clays in the blend matrix, as this was supported by the TEM and SEM micrographs which showed the clay silicate layer has settled at the interface between PA and PP. 4
A study carried out by Ladhari et al. to investigate the absorption of the sea and distilled water by polypropylene and its composites, which were reinforced by different weight fractions of nanoclay. The researcher pointed out that the distilled water takes less time than seawater to penetrate the composites, and the average absorption is directly proportional to the weight fraction of clay in PP, due to the hydrophilicity of the nano clay. The research also showed that the absorption follows a linear increase in weight with time, followed by loss of weight due to some factors like degradation of material over time. 5 S.M.R. Khalili et al. carried out a study in 2010 that focused on tensile and impact tests of adhesive joints made of epoxy reinforced with (1, 3, and 5)%wt. nanoclays. The results showed that the 1% wt. specimens had the highest tensile and impact strength, proving that high weight fractions do not necessarily improve properties. 6
The current work investigates the use of nanoclays in different weight fractions, as a reinforcement for the epoxy to prepare an acoustic and thermal insulating material that is both efficient and mechanically durable to be employed as insulating panels in the building industry.
Experimental
Materials
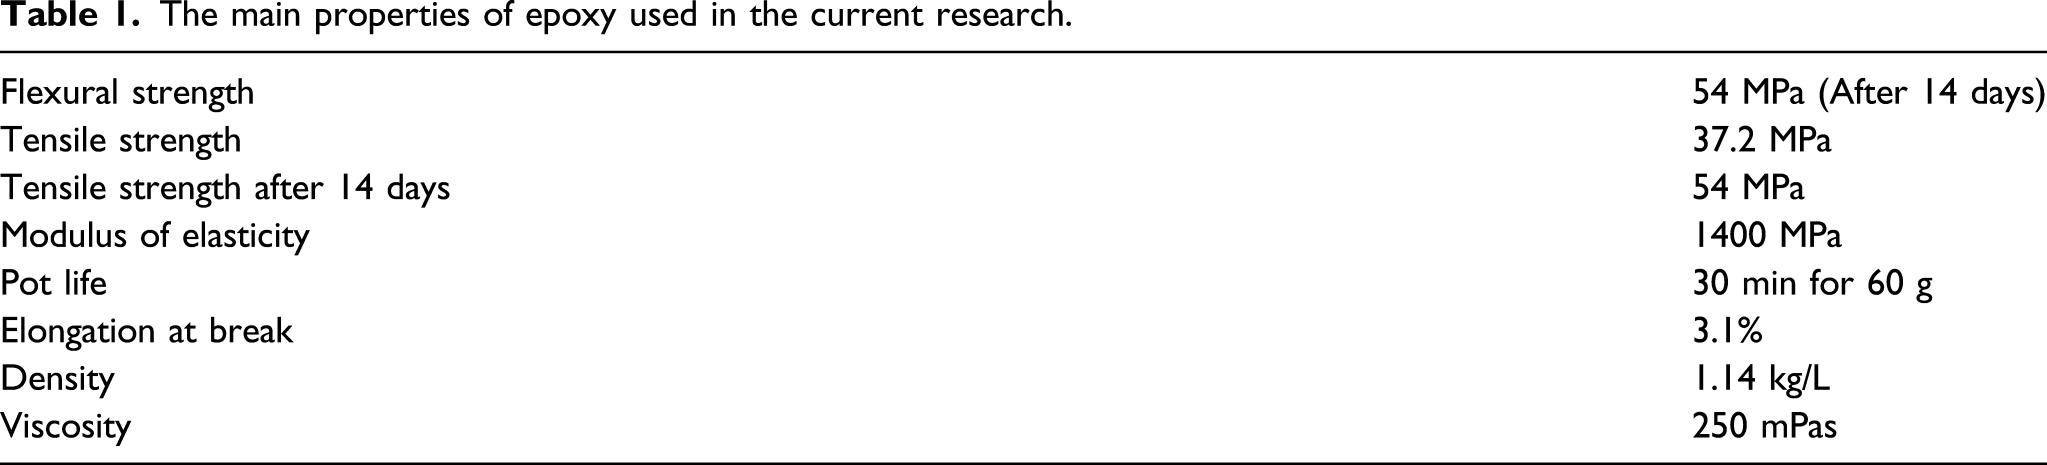
The main properties of epoxy used in the current research.
The values of tensile strength, strain, and Young's modulus for the (5)% and (10)% wt. fractions reinforced specimens.

Preparation of the composite
Castings were prepared by hand lay-up method. Nano clay powder was added in a weight fraction of 5 and 10%, hand-mixed, and then sonicated for 2 h to maximize homogeneity and prevent agglomeration, after which the hardener was added. The mixture was poured into a square galvanized steel mold, with (250*250*4) mm, lined with a protective nylon film and covered with a square lid and left for 24 h for primary solidification, then put in an oven for curing at 50°C for 4 h for maximum cross-linking and elimination of the remaining thermal and mechanical stresses. A neat epoxy (unreinforced) specimen was prepared in the same manner and was left at room temperature at 30°C.± 2 for a week for maximum solidification. The castings were used to carry out the acoustic insulation test and then were cut according to the standard specifications of each test. The castings are shown in Figure 1. The prepared specimens: neat epoxy (a) 5% epoxy (b) and 10% epoxy (c).
The tests
Acoustic insulation (sound insulation) test
This test was performed on the square casting, using the locally made sound insulation measurement instrument, following the standard specification ASTM E−336. 7 The set consists of a wave generator, an amplifier (TNG type AV-298), a loudspeaker, and a wave receiver (range 30–130 dB), which are all installed inside a rectangular wooden box with length, width, and depth (100 × 50 × 50cm, respectively. The wave generator sends sound waves in different frequencies from one side of the box, and these are transferred through the specimen to the other side to the receiver. The intensity of the received sound is a function of the material's ability to insulate sound.
Thermal conductivity
Lee's disc was used to carry out a thermal conductivity test manufactured by Griffin and George™. The instrument consists of three brass discs (A, B, and C) and the specimen placed between discs A and B. An electric heater is placed between B and C. Since the specimen is placed between discs A and B, it absorbs an amount of heat, and the remaining heat passes to disc A. The amount of transmitted heat indicates the material’s ability to insulation. The temperatures are read off thermometers placed in each disc, and normally disc A would set a lower temperature than B and C.
Thermal conductivity is calculated using the following formula
8


Tensile test
Tensile properties were tested using Universal Testing Machine-Laryee™, WDW-50, according to the standard specification ASTM D-638.
9
The specimens were fixed at one end to the stable lower jaw of the set, while the other end is tied to the moving jaw, with a strain rate of 5 mm/min and stress–strain diagrams were obtained directly since the cross-sectional area and the gauge length of the specimen were already measured. The Young’s modulus values and tensile strength were calculated, and the latter was calculated by the following formula
Impact test
The impact test instrument consists of a hammer placed at an elevated position and then released to hit the horizontally mounted specimen. The energy of failure is measured off a gauge and divided by the cross-sectional area of the material. The instrument is manufactured by Testing machines™, Amityville Inc., New York, USA, and the test is carried out according to the standard specification ISO-179.
10
The impact strength can be calculated by the following formula
Compression test
The hydraulic press manufactured by Leybold-Harris™, model (36,110), was implemented to evaluate the compressive strength of the composite, in compliance with the standard specification ASTM D-695
11
using rectangular solid shaped specimens. The maximum load indicates the compressive strength which marks the failure of the material, and is calculated through the equation
Results and discussion
Acoustic (sound) insulation
The results of the sound insulation test are illustrated in Figure 2 in which the sound levels for all specimens are plotted against a range of frequencies (100–10,000Hz.) at the low-frequency range (below 1000 Hz) the sound intensity remains low, after which it increases gradually and stabilizes as the frequency increases. Upon the addition of nanoclay, the material shifts toward lower sound intensity, especially under 1000 Hz., with the 10% wt. specimen showing the lowest sound intensity of all specimens. Nanofillers provide a wider distribution and a larger surface area for the reinforcement inside the matrix, thus they create a scattering path for the sound wave to travel through which facilitates sound energy loss, hence a low sound level and more absorbance by the composite material, compared to the unreinforced material.
12
Sound transmission loss (STL) for pure epoxy and epoxy-nanoclay composite samples.
The soundproofing ability of the epoxy escalated even with a small amount of nano clay, thus the high specific surface area of the nanoparticles, accompanied by the friction between the sound waves and the composite can diminish the sound wave to only a small percentage of its original incident energy. Furthermore, the fineness of the reinforcement plays a major role: the fine particles vibrate easier in compliance with the sound waves, hence the attenuation of the latter, unlike larger scale additives.13,14 In the current work, the sound level dropped when wt. fraction doubled. In other works carried out by other researchers, the sound insulation was affected by other factors, like the thickness of the samples, as it remained constant for all three specimens (4 mm, according to the side height of the casting mold). However, in research by J.CH. Lee et al., 15 the sound level was determined by the type of the material, and the volume and shape of the space the sound is travelling through. The rigidity of the material plays a major role in sound insulation efficiency as it determines the material’s ability to vibrate and weaken the incident sound wave energy.
The behavior of the composite may also be influenced by the distribution of nanofiller within the matrix. Effective absorption of the incident sound wave was affected positively by the even distribution of the nanofiller within epoxy due to sonication during casting. Therefore, the incident energy suffers more reflection, scattering, and absorption when travelling through the composite of higher weight fraction.12,16 The current work has been put in comparison with previous works which employed polypropylene and acrylonitrile butadiene styrene as matrices, with nano clay and carbon nanotube as reinforcements. The results were put together in Figure 3 which shows a normalized sound transmission loss curve plotted for the current results and earlier studies to show the consistency of the current work. All samples in this comparison have almost the same thickness of 3–4 mm. However, it can be noticed that the epoxy–nanoclay composite in the current work showed a sharp sound insulation behavior, which is almost consistent with polypropylene–nanoclay composite at the low sound frequencies. This may be attributed to the platelet shapes of nanoclay particles, thus damping sound energy at low frequencies, besides their even distribution, hence the attenuation of sound energy at these low frequencies.12,17 Comparison of normalized sound transmission loss of the current work with earlier investigations.
A correlation between the normalized sound transmission loss and the incident sound frequency ( Fitted curve (green line) for the (normalized) sound transmission loss behaviour.
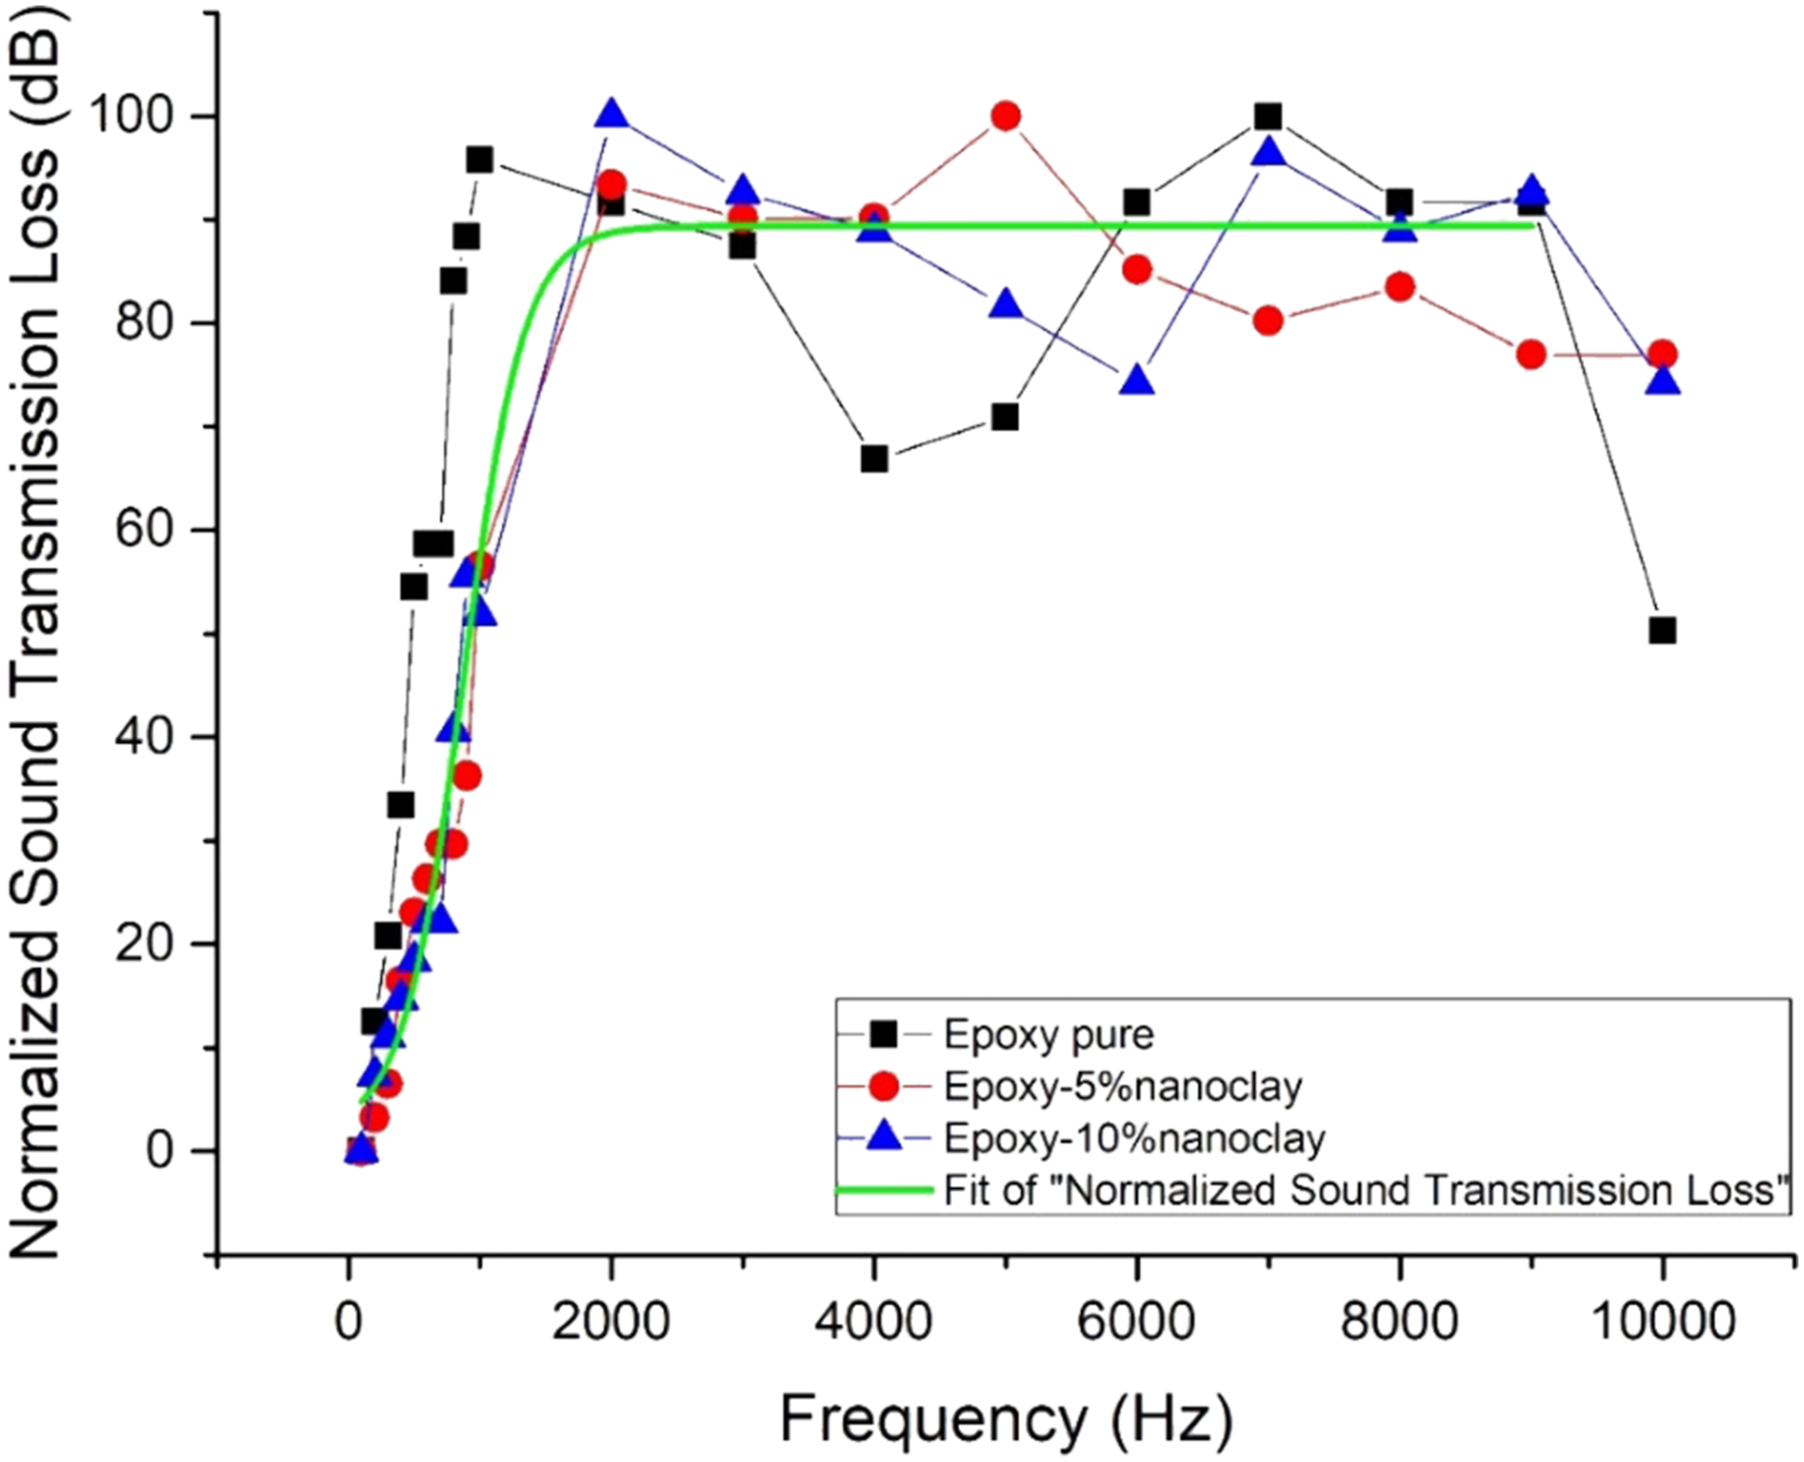
This empirical relation shows that sound insulation is exponentially related to frequency. The addition of nanoclay improved the sound attenuation over 1000 Hz as in Figure 5. The stiffness in terms of elastic modulus composite has improved with increasing nanoclay which is consistent with earlier investigations.16,20 Thermal conductivity as a function of nanoclay weight fraction.
The scanning electron micrographs support the above-suggested explanation. Figures 9 and 10 show the (5)% and (10)% wt. fractions specimens, magnified from 100 μm down to 10 μm, the micrographs (9.a) to (9.d) refer to the 5% specimens, and cluster-like agglomerations of nano clay appear to be distributed in a random manner in small groups.
On the other hand, Figure 10(a)–(d) show micrographs of the (10)% wt. specimen, where nanoclays are thoroughly dispersed through the epoxy matrix. Agglomerations are distributed evenly throughout the whole matrix and nanoclay-free regions are smaller in size compared to the nanoclay agglomerations. The low frequencies (100–1000 Hz) correspond to sound intensities (96.5) dB. and (94.9 dB. for the (5)% and (10)% wt. specimens, respectively, compared to (102.2) dB for the unreinforced specimen. The material responds easily to relatively low frequencies through vibration until equilibrium to adjust to sound frequency. After 1000 Hz. up to 10,000 Hz., all the three specimens revealed higher sound intensities, and the reinforced specimens show lower sound intensities. The results agree with other works18,19 where nano clay is used with rock wool as a reinforcement for (epoxy/polyester) blend matrix, as the soundproof ability was directly proportional with nanoclay content. Sabet et al. also explained how the weight fractions of nanoclay are decisive in obtaining a good acoustic insulator, as they used three different weight fractions (1, 3, and 5%) to reinforce polycarbonate. The specimen reinforced with 3% showed the highest sound loss transmission (STL) compared to other specimens. This may be attributed to the high nanoclay content, which is not always beneficial, as this may result in agglomeration. 20
Thermal conductivity
Thermal conductivity is directly related to nanoclay content and the results are shown in Figure 5. This may be attributed to the presence of silicon (Si) ions in the molecular formula, so an easy path for transferring heat was formed within the matrix. 21 Thermal conductivity is further enhanced by agglomerations spread through the composite, so heat transfers easily through the densely packed matrix. 22 Herrero et al. obtained results in the same context using nanoclay reinforced PVA aerogel, and they suggested that the increased density, then decreased porosity may be related to the increased thermal conductivity as the solid content of the whole material increased. 23 Nevertheless, that the addition of nanoclay to polymers enhances their mechanical and thermal stability due to the decreased porosity, resulting from denser packing after addition. 24 The heat transfer in solids depends on whether the material is conductive or insulator, so ceramics have a three-dimensional crystalline structure that vibrates to transfer heat, easing the transfer of heat across the material, while polymers have a random chain structure and free space exists between chains, and the addition of a ceramic nanofiller can change the thermal conductivity of a polymer and increase it. 25
Tensile Strength
Results of the tensile test are shown in Figure 6. Specimens were tested under the same conditions, and the results show that 5% wt. specimens have a higher tensile strength and Young’s modulus by 65.5% and 46.5% than unreinforced specimens. The 10% wt. specimens shifted towards a lower tensile strength and modulus than with 5% specimens, despite their mechanical features than the unreinforced specimens. This agrees with other researchers26,27 who suggest this could be a result of the nanoclay agglomeration and exfoliation, hence reduction in the polymer chain mobility under tensile loads.26,27 Agglomeration generally inflicts a drawback to the mechanical properties of composite materials as they act as local stress concentrators and may cause the particles interlock, increasing the movement of polymer chains, and adding to the stress concentration effect imposed by these additions. Finally, the added nanoclay acts as a crack-stopper, by deforming plastically before failure (by debonding and changing dimensions), which may explain the increase in strain after reinforcement with 5% nano clay.
28
Tensile strength as a function of nanoclay weight fraction.
A decrease in mechanical properties occurred at high percentage addition. The 10% specimen had a thicker consistency and viscosity during mixing than the 5% specimens, besides nanoclay agglomeration and poor adhesion between the two phases (nanoclay and epoxy), these combined effects led to an irregular dispersion of nanoclay throughout the matrix, and eventually decreased tensile strength. 29 This agrees with Jeyakumar et al., 30 and Yifan et al. 31 who used cloisite and attapulgite (different forms of nanoclay) to reinforce epoxy. The results showed that tensile strength was directly proportional with nanoclay content, up to the point where tensile strength and modulus dropped at 7% wt. fraction 30 and at 12%, 31 which might have been caused by the above-explained reasons.
Impact strength
Impact test results are illustrated in Figure 7, which shows that impact strength changed from 22 KJ/mm2 for the neat specimen to 61 KJ/mm2 and 54 KJ/mm2 for the 5% and 10%, respectively. This could be attributed to the interfacial area between the two phases in the composite.
32
Agglomeration of nanoclay may have also contributed to this result,
33
in addition to the voids and discontinuities created by the high concentration of nanoclay, which promote stress concentrations
26
and deform plastically on a large scale before breaking, eventually, the high impact strength is developed.
34
Viscosity may also have contributed to the non-uniform dispersion of the particles. The increase in nanoclay made it difficult to gain an even distribution of reinforcement
35
This agrees with Al-Amri and Low, who found that impact strength increased gradually up to a point where it began to drop after 5% weight fraction as they used cloisite in (0, 1, 3, and 5)%, in addition to recycled cellulose fibers.
36
Jeyakumar et al. also reported the same results with impact strength in their research, as the maximum impact strength was gained with 3%wt nanoclay, and decreased beyond that point
30
Impact strength as a function of nanoclay weight fraction.
Compression strength
The compressive strength of the composite specimens is shown in Figure 8, and the values of the 5% and 10% specimens were 41.94 MPa and 40.32 MPa, respectively. Compression behavior was different from tensile, and the nanoclay gathered in clusters, which could have enhanced microscopic mechanical interlocking, in addition to the voids closing under compression, making it difficult for the cracks to propagate.
5
Nanoclay addition has resulted in similar outcomes in the work carried out by Mohan and Kanny
37
who used nanoclay and banana fibers as a reinforcement to epoxy composites, and the results were compared with banana fiber reinforced epoxy. The hybrid composite showed the highest value of compression modulus and strength, with strain. The researchers suggested that the infusion of nanoclay into the banana fibers led to a stronger bonding at the banana fiber–epoxy interface region, due to the reduction of the amorphous, non-cellulosic region inside the fibers, leading eventually to a more load-bearing ability of the material
37
In the same aspect, the work carried out by Ahsan et al. showed the same behavior for epoxy reinforced with hybridized additives of nanoclay+graphene with carbon fibers in various volume fractions. The specimens reinforced with nanoclay+ graphene with carbon fibers provided a compressive strength of about 30% higher than its value in neat carbon fiber reinforced composites. The researchers tested the specimens for their compressive strength after exposure to seawater for 6 months at room temperature and −20°C, and in both cases the nanoclay reinforced specimens maintained a good performance. In general, the nanoparticles add interfacial strength to the (fiber/matrix) interface, which eventually improves the compressive properties.
38
Compressive strength as a function of nanoclay weight fraction.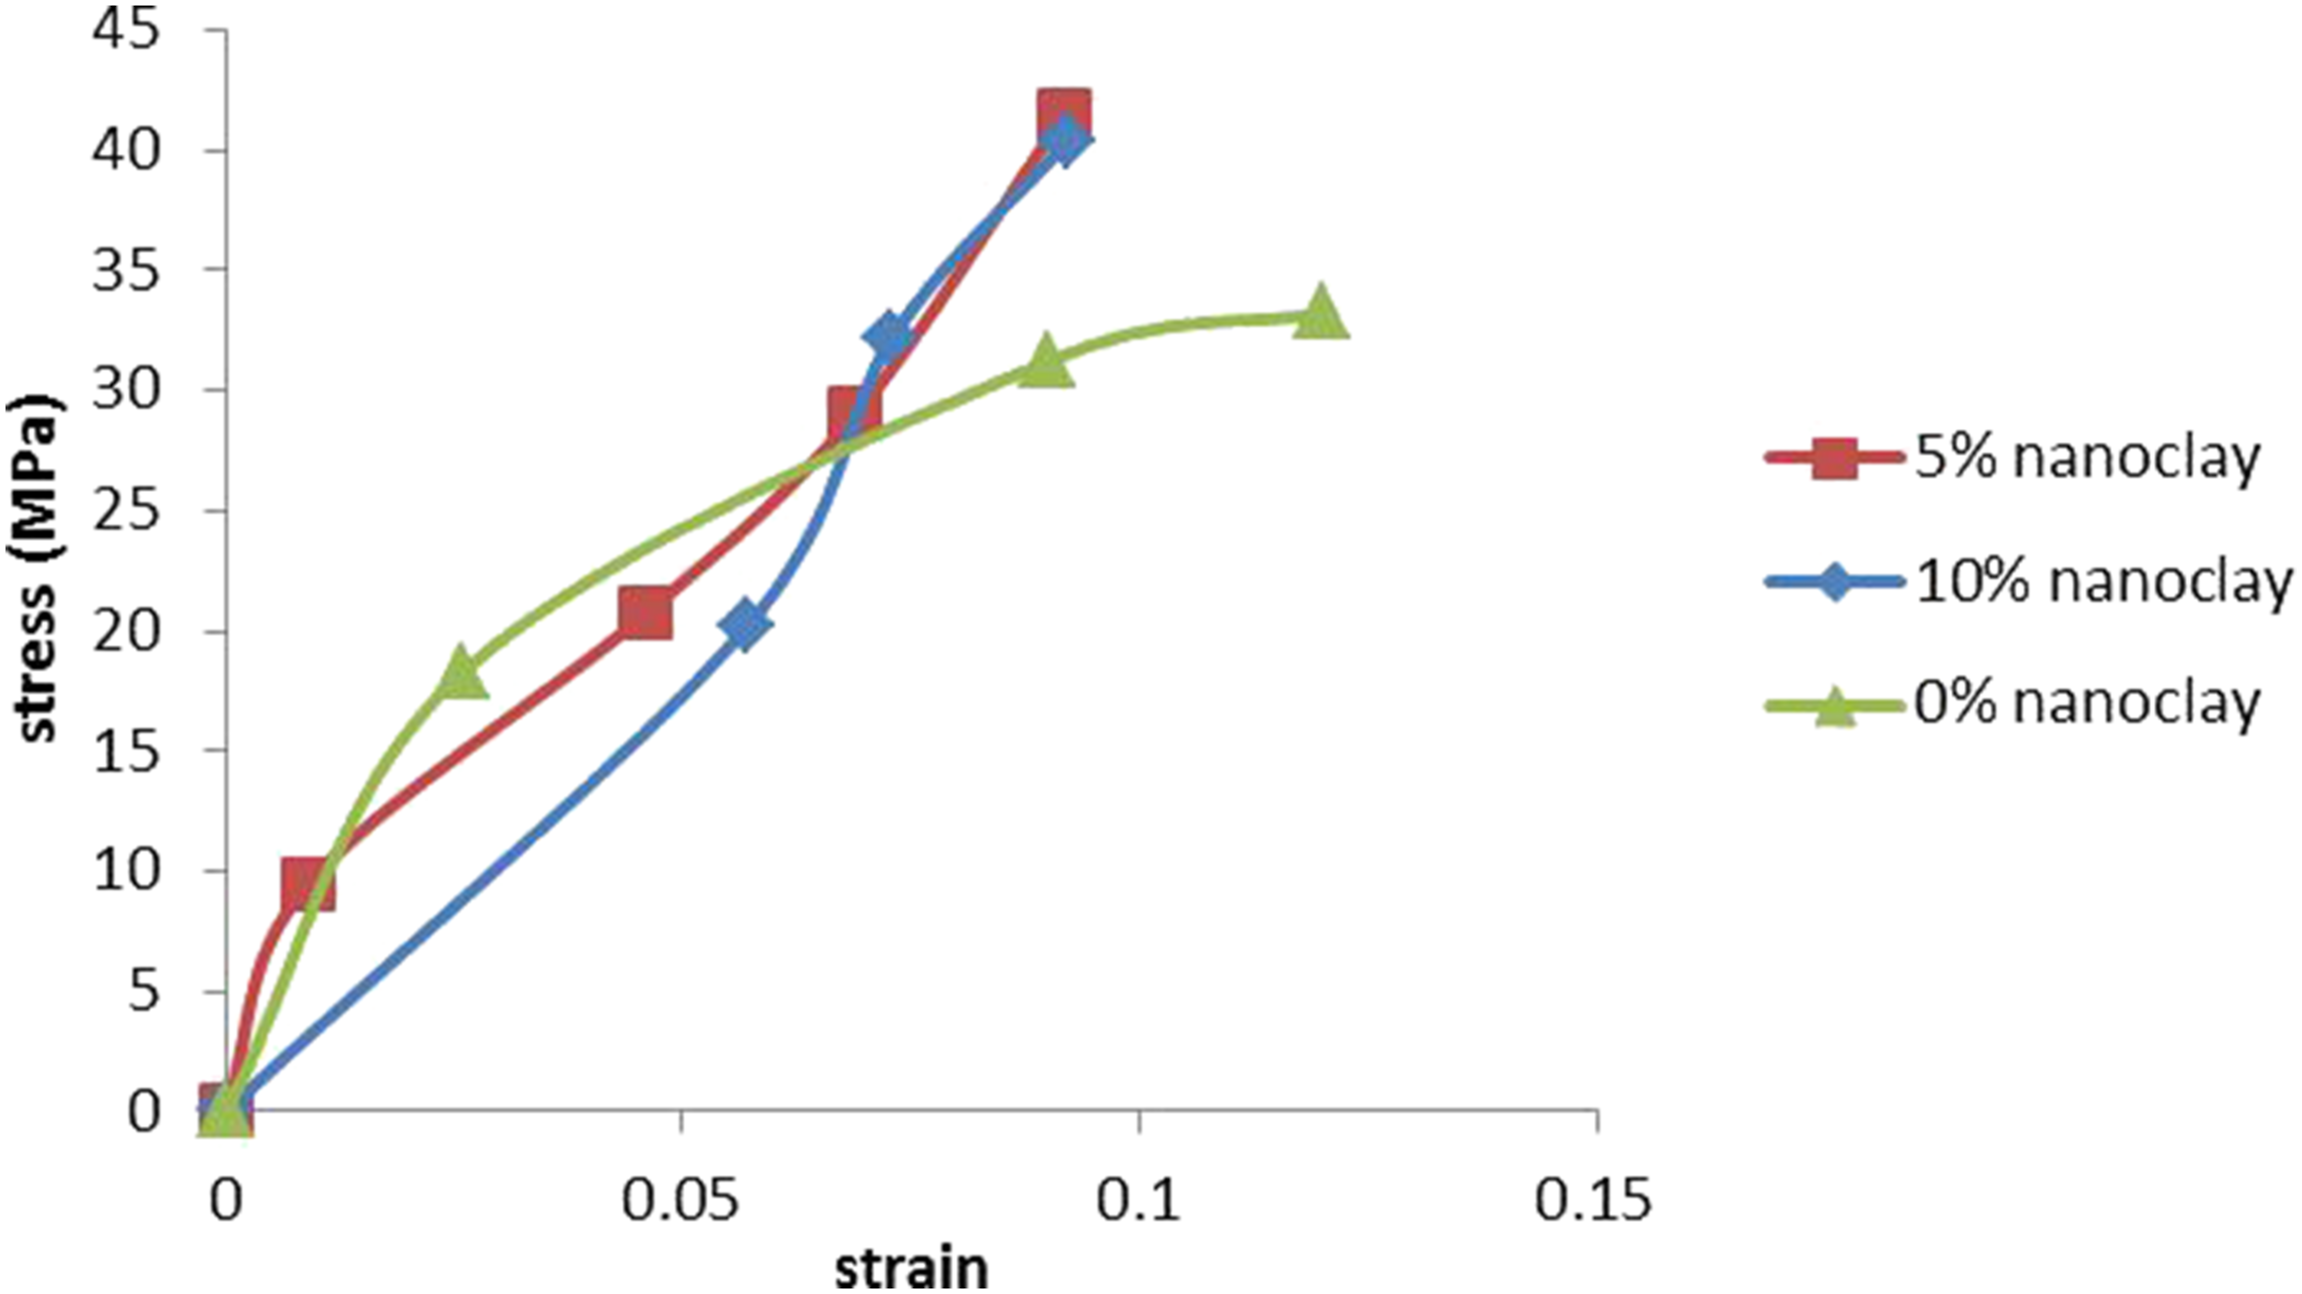
The results of the current work are further explained by the SEM images. The specimens 5% and 10% had close results at the late stages of the test, although a small difference was observed at the early stages. Nevertheless, the values of compressive strength at the point of failure were close, indicating better load-bearing properties of the composite. 39
Scanning electron microscope (SEM) imaging
SEM imaging was implemented to inspect the microscopic details of the specimens. Figures 9(a) to 10(d) show the surface features of the 5% specimen, with the agglomeration of nanoclay distributed in clusters all over the specimen, dispersed in a nanoclay-free space. There are also fracture lines of brittle fracture (sharp extended lines) before breakage, although the nanoclay reinforced specimens had a higher impact strength than the unreinforced specimens. Figure 10 shows a fracture surface with a closer packing of the nanoclay agglomerations. Fractured surface roughness suggests a deflected path for crack propagation, in a way that may have contributed to the increase in impact energy, by increasing the crack path during plastic deformation.
40
(a‐d) Surface fractographs of 5%wt. nanoclay reinforced specimen. (a‐d) Surface fractographs of 10%wt. nanoclay reinforced specimen.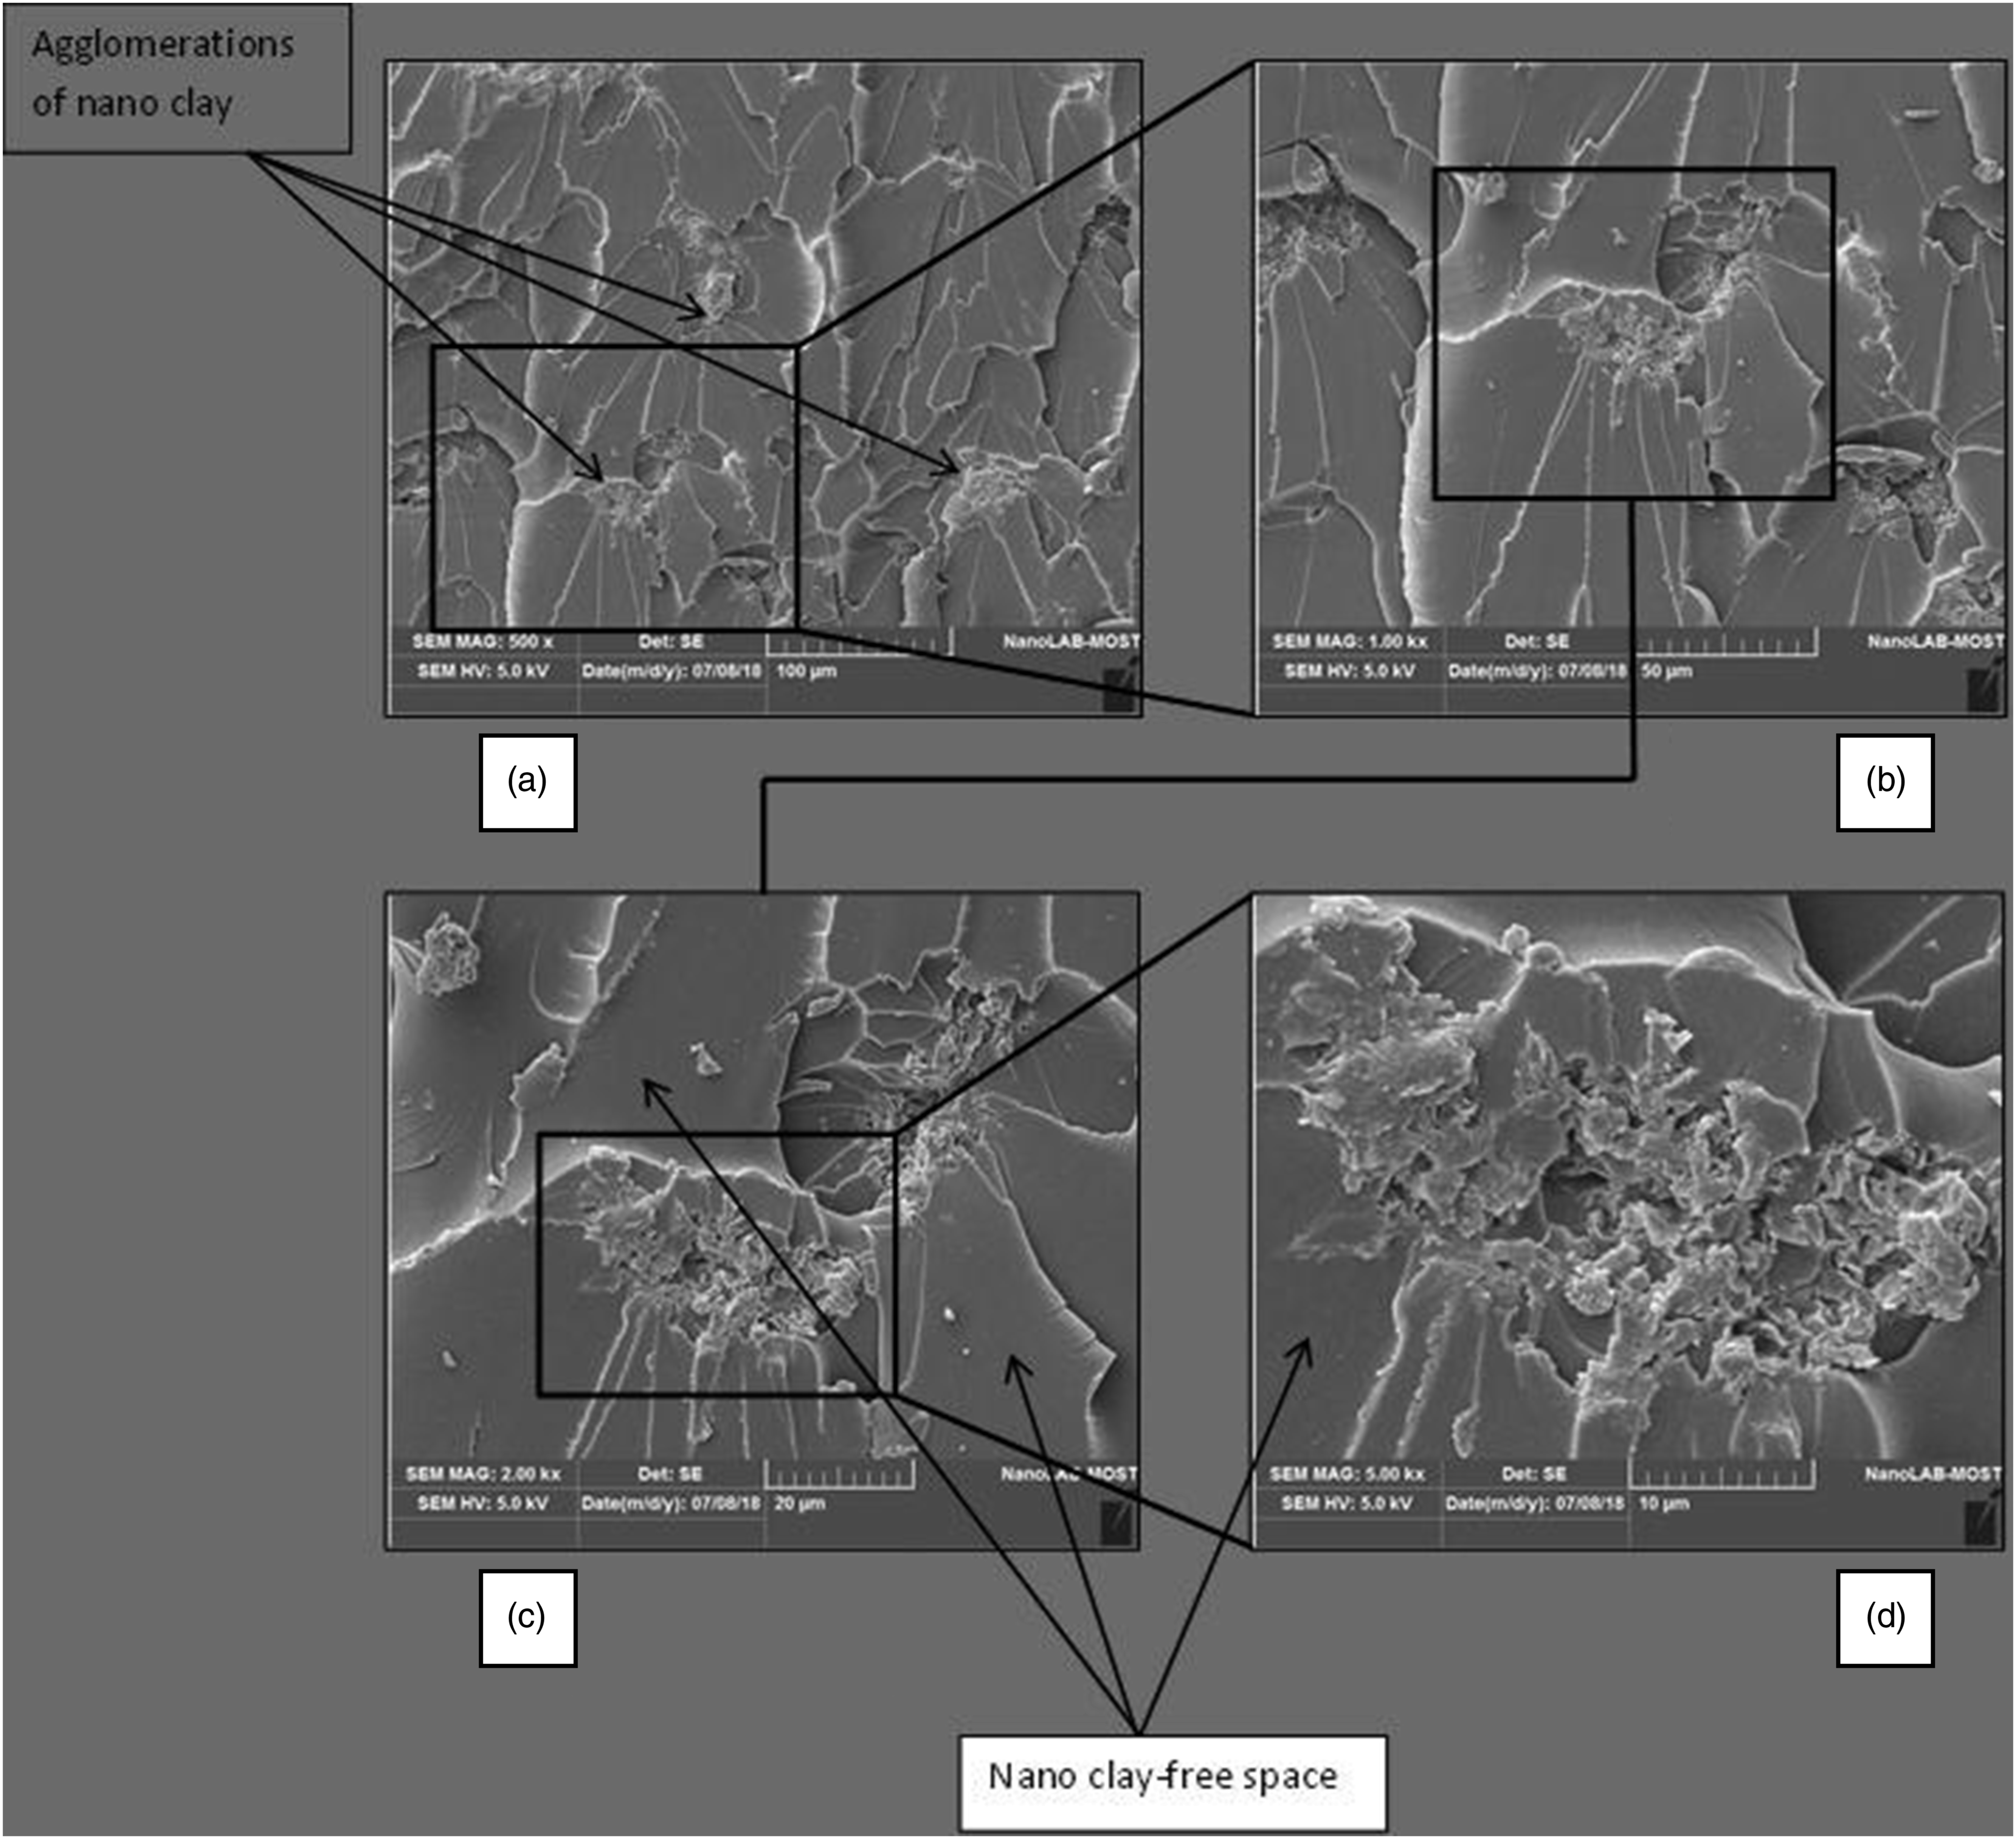

Conclusions
The sound and heat insulation properties, together with mechanical properties (tensile, impact, and compressive strengths) were carried out on 5% and 10% wt. nanoclay reinforced epoxy, in addition to the unreinforced specimen. The main points can be summarized as follows: 1. Thermal conductivity showed a slight increase by nanoclay addition compared to unreinforced material. 2. Both reinforced specimens showed better sound insulation than neat epoxy. 3. The tensile properties improved for both reinforced specimens compared to pure epoxy. 4. The same behavior was noticed under compression, with a small difference between the 5% wt. and the 10% wt. specimens. 5. Impact results showed a higher value for the reinforced specimens than pure epoxy. 6. SEM observations showed nanoclay agglomeration, although the 10% specimen had a denser packing.
Footnotes
Declaration of conflicting interests
The author(s) declared no potential conflicts of interest with respect to the research, authorship, and/or publication of this article.
Funding
The author(s) received no financial support for the research, authorship, and/or publication of this article.