
Abstract
The role of nanodielectrics in the electrical power system is becoming crucial owing to its superior properties and potential applications in the field. Yet, the materials face limited breakdown strength and thermal properties. Further, the nanodielectrics have not found a comprehensive commercial platform because of the costly manufacturing process, and characterization and testing facilities. Therefore, to reduce the involved cost, in this work, an FE (finite element) based computational technique has been implemented to visualize the effect of shape, size, and filler concentration under the application of high voltage (HV). The epoxy-based nanodielectrics have been modeled incorporating a range of different shapes and size nanofillers—Al2O3, BN, BeO, SiO2, and TiO2. The paper discusses the 2D-analysis of the modeled nanodielectric in the steady-state electrostatic fields and thermal domains. It shows the insights of the nanofillers’ choice to ensure a perfect blend of electrical and thermal properties. The epoxy with square-shaped BeO fillers showed a rise in the electric field of nearly 1.5 times than unfilled neat epoxy, which indicates a significant surge in thermal conductivity at specific filler loading.
Introduction
The nanodielectrics have evolved as a choice among the conventional insulators in the electrical power industry. The nanodielectrics are attracting industrial applications because of their superior dielectric and thermal properties compared with the traditional ceramic insulators.1–3 The epoxy with a suitable proportionate of nanofillers offers considerably reduced electrostatic fields, low loss factors at a specific range of frequencies, resistance to treeing and tracking, and good thermal conductivity. The epoxy-based dielectrics find their applications in mechanical outdoor supports for instrument transformer and busbar, pole housing, bushing plates, and cone spacer for SF6 circuit breaker up to 132 kV operating voltage. 1
Although a revolutionary work has been reported and also in present times, the diversified work is progressing in the synthesis and characterization of the epoxy-based nanodielectrics incorporating the nanofillers of Alumina (Al2O3), Boron Nitride (BN), Zinc Oxide (ZnO), Silica (SiO2), and Titania (TiO2). However, no significant work reported of Beryllia (BeO) as a nanofiller in the epoxy matrix. In contrast, the nanodielectrics yet face the reported issues like interfacial dynamics affected by numerous parameters, suggested models 4 and effect of size, shape, and concentration of nanofillers.5–12
The enormous cost is involved in synthesizing and characterizing nanodielectrics in highly sophisticated environments and laboratories to evaluate these parameters individually/simultaneously. Therefore, the nanodielectrics have been simulated on a finite element-based software package to save the prototype cost. A few findings have reported on the electric fields and thermal conductivity using finite element techniques.13–17 These research findings have not featured the effect of shape, size, and filler loading collectively. Also, the presented models13–18 could not accurately represent the gaps in the experimental and simulated results. Conversely, the combination of excellent electrical and thermal properties is difficult to find in the application. A dielectric should offer outstanding electrical and thermal properties to avoid electrical breakdown and thermal failure.
For futuristic insulation applications, the electrostatic and thermal performances of the epoxy nanocomposites have been discussed here. The modeling has incorporated different nanofillers/particles and their properties, configurations, and boundary conditions to perform FE simulations. The results confer the impacts of the size, shape, and filler loading on the electrical and thermal behavior of the modeled nanodielectrics.
Modeling of nanocomposites
The epoxy-based nanocomposites have been modeled in an FE based computational software package-COMSOL Multiphysics. The study has been carried out on a two-dimension (2D) platform. A range of electrical and thermal tests in a steady-state domain has been performed on the epoxy matrix incorporating different shapes, sizes, and percentage loading of Al2O3, BN, BeO, SiO2, and TiO2. In the present study, these nanofillers were filled in the epoxy matrix of 1 μ in a circular (sphere in 3D) and square (cube in 3D) shape; the diameter of the circular-shaped fillers was 15, 40, and 60 nm, whereas the square-shaped fillers had sides of 15, 40, and 60 nm.
In heat transfer analysis, square-shaped particles of 54 nm-sized have been examined to equalize the surface area with 60 nm-sized circular-shaped particles. The coordinates of circular and square-shaped fillers in the epoxy matrix have been randomly generated through MATLAB to visualize the actual behavior of the material subjected to the filler loading, and this remains constant in each studied case. Afterward, the fillers have been generated in the FE software package. Due to computational limitations, the percentage loading has been restricted from 1 to 5% volume fraction only. With the increase in filler size, the number of fillers reduces in the epoxy matrix. Further, the number of circular-shaped and square-shaped fillers are different due to different surface area.
The epoxy-based nanocomposite was analyzed in two domains: (1) Electrostatic and (2) Heat transfer. The electrostatic analysis was performed to observe the normalized electric field (V/m) distribution and electric field concentration. The modeled epoxy material was subjected to a steady-state 110 V high voltage application. The thermal conductivity subjected to the temperature gradient was observed in terms of the heat flux in the heat transfer domain.
The dielectric constant, density, thermal conductivity, and heat capacity of neat epoxy are 3.5, 1250 kg/m3, 0.17 W/m·K, and 1100 J/Kg·K, respectively. The properties of the nanofillers should be referred to in Table 1. The number of fillers for a specific % volume fraction should be referred to in Table 2.
Filler’s properties.

Filler configuration.

Boundary conditions
The boundary conditions were applied to perform FE simulations and depicted in Figure 1: Side 1 indicates 110 V high voltage DC terminal and side 2 is grounded terminal for electrostatic analysis, side 3 is at 495.15 K, and side 4 is at 295.15 K to create a temperature gradient of 200 K for heat transfer analysis along with the sides 1 and 2 thermally insulated. The comparison is made between the neat epoxy and the epoxy with filler loading of 1–5% volume fraction for electrostatic and thermal behavior. For the sake of brevity, a few results have been illustrated.

The epoxy matrix with 2% volume fraction of 40 nm-sized nanofillers with boundary conditions (sides).
After analyzing the results, the appropriate filler has been decided to devise a defendable insulator that can offer excellent electrical and thermal properties.
Results and discussion
Electrostatic analysis: Steady-state electric field distribution
The purpose of performing the electrostatic analysis is to observe the effects of shape, size, and filler loading in the epoxy matrix when subjected to high voltage DC application. The results show the field concentration and polarization in the material. It is reported that the high permittivity fillers stress the epoxy material but have the potential to improve other properties of the nanodielectric and vice versa.16,17 The polarization increases under the enhanced electric fields, which may eventually lead to the breakdown of the material and the same has been attempted to observe with different shapes and sizes of the fillers. The electric field in the neat epoxy was 1.18 × 10⁸ V/m, whereas the polarization was about 2.43 × 10⁻³ C/m2 when subjected to 110 V steady-state high voltage application and not shown for the sake of brevity.
Effect of filler materials
The analysis has been carried out to examine the effect of filler material in epoxy concerning the filler loading. The simulation results have been shown for the promising and distinct cases, i.e. epoxy with 15 nm-sized circular-shaped BeO, SiO2, and TiO2 fillers for two different concentrations, specifically 1 and 5% volume fraction. It is explicitly observed that the maximum field and polarization appear at the interfacial region and minimum in the fillers due to the higher permittivity in each case. With a 1% volume fraction, the maximum electric field in TiO2-based epoxy nanocomposite is 3.04 × 10⁸ V/m, whereas in SiO2-based and BeO-based epoxy nanocomposites, it is 1.26 × 10⁸ V/m and 1.68 × 10⁸ V/m, respectively.
The polarization, on the other side, in TiO2, SiO2, and BeO-based epoxy nanocomposite aggregates to 0.0031, 0.00316 and 0.00578 C/m2, individually. Further, when the filler loading increases to 5% volume fraction, electric field and polarization ascend to new heights. In Figure 2(a), the maximum electric field is 1.18 × 10⁹ V/m in TiO2-based nanocomposite. While it is comparatively lower in BeO and SiO2-based epoxy nanocomposites, i.e. 1.28 × 10⁸ V/m and 2.02 × 10⁸ V/m correspondingly; this can be viewed in Figure 2(b) and (c), respectively. The distribution of electric fields is statistically shown in Figure 3. The overlap of SiO2 over BN is observed due to an almost similar distribution of electric fields. In Figure 4(a) and (b), the polarization is remarkably as high as 0.09 C/m2 in TiO2-based epoxy nanocomposites as compared to SiO2-based epoxy nanocomposites. In the BeO-based epoxy nanocomposites, it is 0.0075 C/m2.
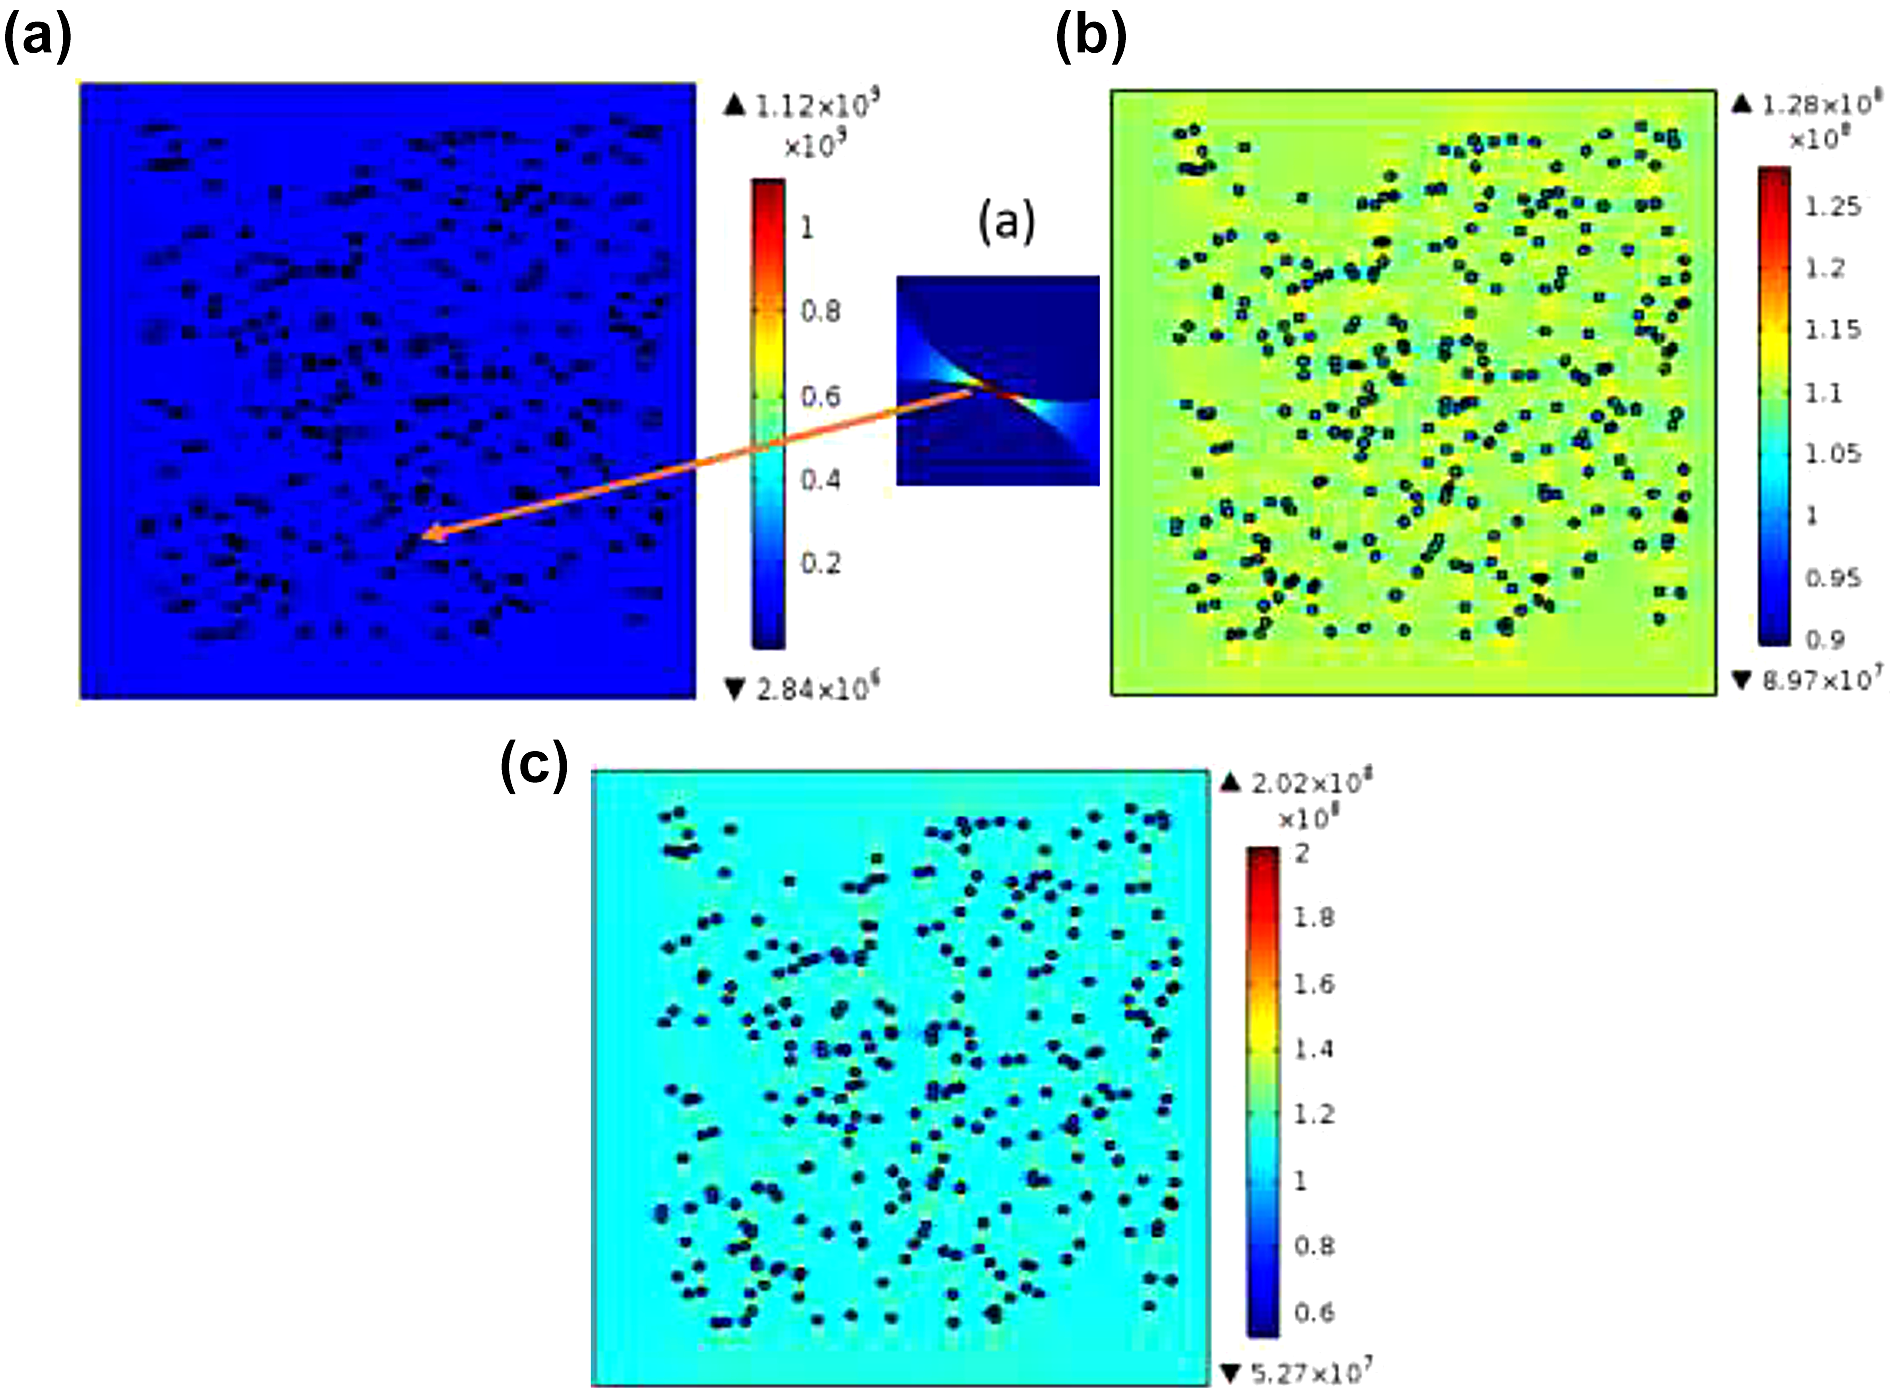
Electric field distribution (V/m) in 15 nm-sized (a) TiO2, (b) SiO2, and (c) BeO-based epoxy nanocomposites with 5% volume fraction.

Electric field distribution (V/m) in 15 nm-sized Al2O3, BeO, BN, SiO2, and TiO2-based epoxy nanocomposites with 1 to 5 % volume fraction.

Electric polarization (C/m2) in 15 nm-sized (a) TiO2 and (b) SiO2-based epoxy nanocomposites with 5% volume fraction.
The enhancement of electric field and polarization is attributed to the filler permittivity. With higher permittivity, the effective nanofiller/epoxy interface is significantly stressed. The TiO2 fillers have high permittivity and enhance the electric field and polarization to an extreme in the base material than any other analyzed in the present study. Kavitha et al. 17 have reported that the fillers having high inherent permittivity compromise the breakdown strength of the composite and vice versa. Also, when the filler concentration increases, the interparticle distances are reduced, leading to the more stressed regions,17,19,20 and it is observed from the zoomed inset in Figure 2(a) that the particle distances were even less than the size of the nanofiller when increased in the filler concentration. The particle agglomeration results differently, and this has also been reported by Paul and Sindhu 19 in the early experimental studies and Beena and Jayanna 21 for the dielectric studies on piezoelectric BaTiO3 ceramic polymer composites.
Effect of filler size
The morphology of nanofillers considerably influences the electric properties of the composite material with several other factors. 22 The analysis has been carried out to explore the effect of filler size in epoxy as regard to the volume fraction.
The simulation results have been shown for 15, 40, and 60 nm-sized circular-shaped BeO-based epoxy nanocomposites for two different concentrations, 1 and 5% volume fraction, as they offer a distinctive performance. With the increase in the filler size, the electric field and polarization reduce to significant values. With a 1% volume fraction, the maximum electric field in 40 nm-sized particles, is 1.47 × 10⁸ V/m, whereas it is 1.45 × 10⁸ V/m 60 nm-sized for BeO-based nanocomposites. Also, when the filler loading is increased to a 5% volume fraction, in Figure 5(a), the maximum field in the material with 40 nm-sized fillers is 1.72 × 10⁸ V/m. And it is 1.77 × 10⁸ V/m with 60 nm-sized fillers and is shown in Figure 6(a). In this view, while increasing the filler loading to 5% volume fraction, with 60 nm-sized BeO fillers, the electric field is reduced by about 11.88% as compared to 15 nm-sized epoxy nanocomposites. Statistically, the comparison has been shown in Figure 5(b) for BeO fillers of different sizes with the filler loading of 1 to 5% volume fraction. It is interesting to note that with a 5% volume fraction, as compared to 40 nm-sized, the electric field has enhanced in 60 nm-sized BeO-based epoxy nanocomposites. It is attributed to the size of nanofillers as the size increases, the interparticle distances decrease and it depends on the distribution of nanofillers in the base material. Further, the same trend is also observed for the polarization and it is attributed to the fact that with even higher filler concentration, the increased size of the nanofillers offers a more homogenous field, and is not shown for the sake of brevity. The nonlinear behavior of electric field and polarization us observed beyond the 2% volume fraction. It is because the overlap of the fillers/particles begins as the interparticle distances reduce. 23

(a) Electric field distribution (V/m) in (a) 40 nm-sized BeO fillers with 5% volume fraction and (b) comparison of electric fields among 15, 40, and 60 nm-sized BeO-based epoxy nanocomposites with 1–5% volume fraction.

Electric field distribution (V/m) with 5% volume fraction in (a) circular-shaped and (b) square-shaped BeO-based epoxy nanocomposites.
Effect of filler shape
It is imperative to examine the effect of filler shape on the electric properties of the nanocomposites as the filler shape has a significant hold on the distribution of electric fields. Here, the study has been carried out with 60 nm-sized square-shaped BeO fillers in the epoxy matrix for two filler concentrations, in particular 1 and 5% volume fraction. The maximum electric field with 1% volume fraction filler concentration is 1.35 × 10⁸ V/m and 1.49 × 10⁸ V/m with 5% volume fraction filler concentration. The drop in the electric field is nearly 17% to that of the circular-shaped BeO-based nanocomposites with 5% volume fraction filler concentration. This is attributed to the surface area of circular fillers as this reduces the interparticle distances leading to more stressed electric fields. In contrast, the field is remarkable at the edges of the square particles as sharp edges offer high charge density and so as the electric fields leading to the interfacial area more stressed. The electric field in square-shaped epoxy-based nanocomposites is 1.24 times that of the neat epoxy. Similarly, the polarization is dropped to 0.0043 C/m2 from 0.0049 C/m2 with 5% volume fraction and not shown for the sake of brevity.
The improved electrical performance is attributed to the square-shaped fillers as they maintain more homogeneous electric fields than circular ones. The reduced electric fields and polarization are considerably low as compared with high permittivity fillers-Al2O3 and TiO2 and not shown for the sake of brevity.
Heat transfer analysis
The heat transfer analysis has been carried out to examine the heat conductivity of the material. While mixing nanofillers and base material, voids and defects might be introduced that lead to electrical discharges. Further, it may take the form of treeing and tracking, leading to the deterioration of the surface properties. 15 It is also reported that the thermal accumulation in the filled particles deteriorates the overall physical properties of the material.13–15 Therefore, it is highly desired to have high thermal conductivity to dissipate the accumulated heat.
The thermal characteristic depends on the density, thermal conductivity, and specific heat capacity of the material. The heat is conducted through the material, and it is a steady-state unidirectional phenomenon, i.e. X-direction. The thermal conductivity (λ) was calculated as per equation (1) 16

where φ is the magnitude of the heat flux in W/m2, d is the width of the epoxy material in μm, and ΔT is the temperature gradient between the sides of the epoxy material.
The thermal conductivity of the neat epoxy is merely 0.17 W/m·K. The heat transfer flux is shown with contours (yellow highlighted) wherever necessary. It indicates the reach of heat flux (W/m2) to the fillers around.
Effect of filler materials
The study has been carried out to investigate the effect of filler materials in the bulk of epoxy. The simulations have been performed for the typical cases, i.e. epoxy with 15 nm-sized circular-shaped BeO, BN, and TiO2 fillers for two different concentrations, specifically 1 to 5% volume fraction. The contours of heat flux for TiO2, BeO and BN-based epoxy composites can be observed in Figure 7(a), (b), and (c) in order.
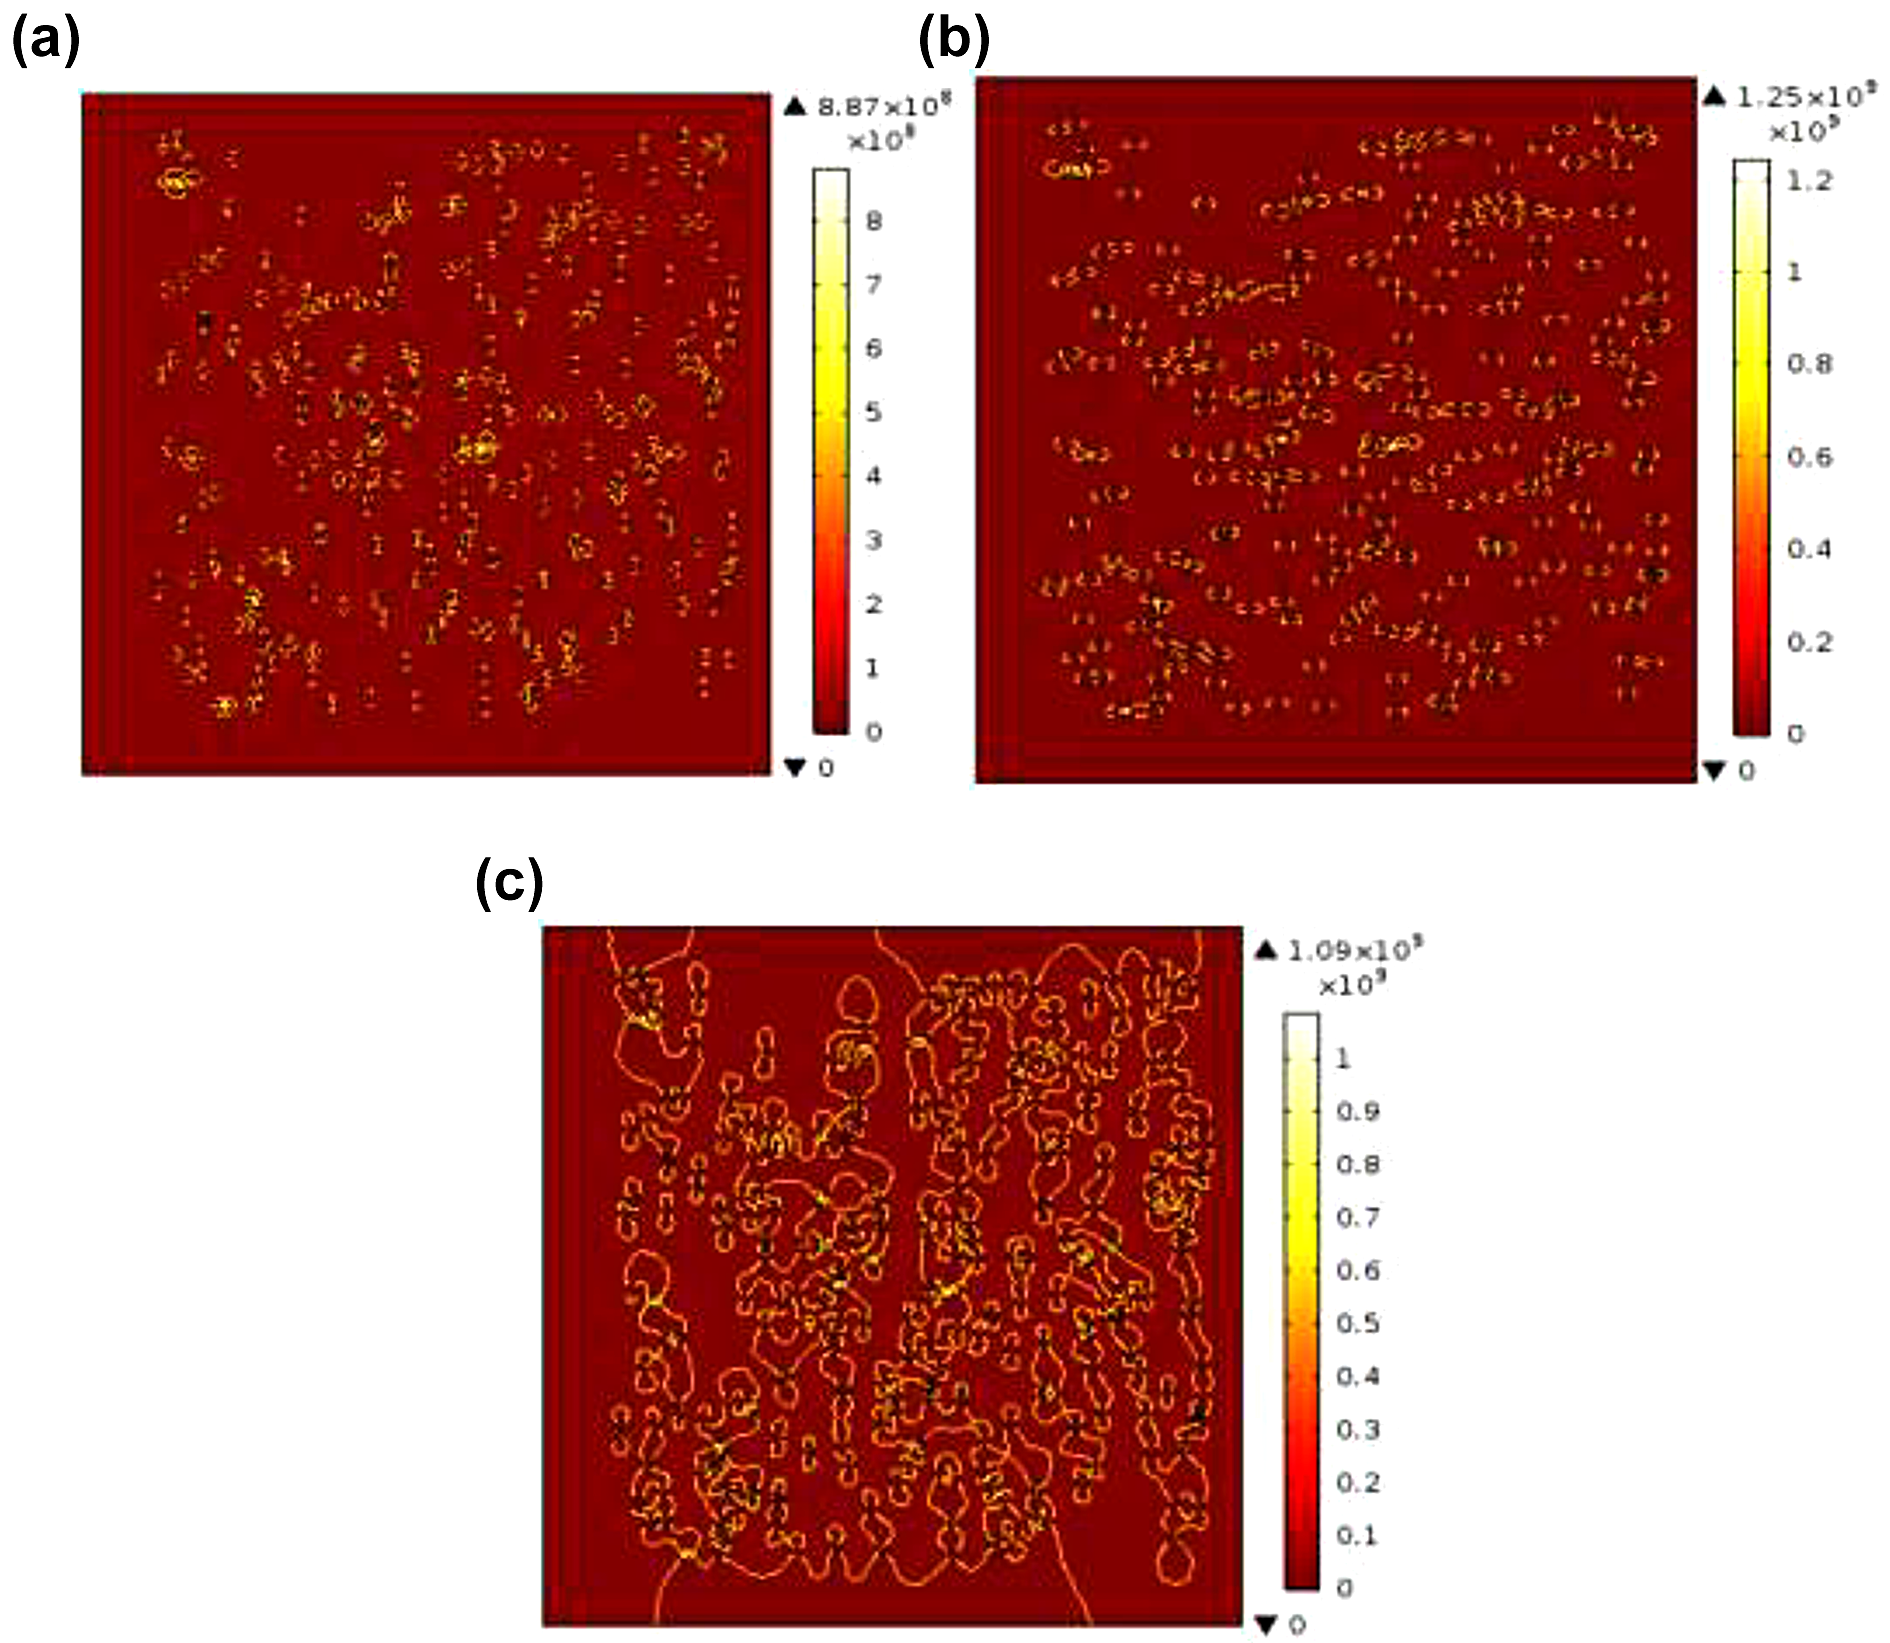
Unidirectional heat flux (W/m2) in 15 nm-sized (a) TiO2, (b) BeO, and (c) BN-based epoxy nanodielectrics with 5% volume fraction.
With a 1% volume fraction, the maximum heat flux in TiO2-based epoxy nanodielectric is 9.38 × 10⁸ W/m2, whereas, in BeO and BN-based epoxy nanocomposites, it is 1.31 × 10⁹ W/m2 and 1.15 × 10⁹ W/m2, respectively. When the filler loading is increased to a 5% volume fraction, the heat flux considerably surges to new magnitudes; it is 8.86 × 10⁸ W/m2 in TiO2 and 1.25 × 10⁹ and 1.09 × 10⁹ in BeO-based and BN-based nanocomposites, respectively. The thermal conductivity calculated from equation (1) in BeO-based epoxy material is 6.25 W/m·K that is highest among the studied nanomaterials in the present work with a 5% volume fraction.
Statistically, the thermal conductivity can be studied in Figure 8. The declined behavior in heat transfer and thermal conductivity with higher filler loading in all the presented cases is attributed to the particle agglomeration; it restricts the effective contact area among particles. The BeO fillers inherently exhibit high thermal conductivity together with density. The high-density material always tends to conduct more heat as the molecules are closer to each other, and for indoor applications of epoxy dielectrics, it is highly desired to maintain thermal stability against low convective surroundings. Further, Kunrath et al. 24 have observed that high-density materials improve mechanical properties, electrical and electromagnetic properties in graphene-based epoxy composites. Agrawal and Satapathy 25 have reported thermal conductivity in epoxy composites filled with micro-sized Al2O3 but have not incorporated nanofillers of different shapes and sizes.

Thermal conductivity (W/m·K) in 15 nm-sized BeO, BN and TiO2-based epoxy nanodielectrics with 1 to 5% volume fraction.
Effect of filler size
In solid dielectrics, heat conduction depends on the surface area of the molecules. The filler size influences the thermal behavior and stability of dielectrics. The discussion on circular-shaped 15 nm-sized BeO nanodielectrics has already been made in the previous section. With a 1% volume fraction, the maximum heat flux amounts to 8.85 × 10⁷ W/m2 in 40 nm-sized nanodielectric and 1.02 × 10⁸ W/m2 in 60 nm-sized nanodielectric. Besides, with a 5% volume fraction, the maximum heat flux sums to 9.96 × 10⁸ W/m2 in 40 nm-sized nanodielectric, whereas it is 1.48 × 10⁹ W/m2 in 60 nm-sized nanocomposites; the illustrative models are not shown for the comparison due to conciseness. When the filler loading is increased to a 5% volume fraction, the thermal conductivity increases to 7.4 W/m·K that is nearly 1.5 times that of the 40 nm-sized nanocomposites. The comparative analysis of thermal conductivity has been represented in Figure 9. In general, with an increase in size and filler loading, the thermal conductivity increases, and that is highest in BeO-based epoxy nanocomposite owing to the high inherent thermal conductivity of the fillers.

Thermal conductivity (W/m·K) in 15, 40, and 60 nm-sized BeO-based epoxy nanodielectrics with 1 to 5% volume fraction.
Effect of filler shape
The filler shape plays a crucial role in conducting the heat within the bulk of the material. The effects of filler shape have been analyzed between 60 nm circular-shaped and 54 nm-sized square-shaped BeO-based nanocomposites with 1 and 5% volume fraction. The introduction of 54 nm-sized square fillers is to make equal surface areas with circular fillers. It makes comparisons simpler. However, when the insulator is subjected to the actual operating voltage conditions and environmental conditions, the filler size is 60 nm. In 54 nm-sized square-shaped BeO-based epoxy nanocomposites, the maximum heat flux is 1.02 × 10⁸ W/m2 with a 1% volume fraction, whereas it is 1.48 × 10⁸ W/m2 with a 5% volume fraction and it is represented in Figure 10. It was also observed that the interfacial particle layers showed overlap beyond the 2% volume fraction that can potentially contribute to the nonlinear behavior of the thermal conductivity. The overlap of the interfacial regions occurs when the interparticle distances are less than the size of nanofillers. The square-shaped particles share stronger interaction in the base material than the circular-shaped, and Tsekmes et al. 16 have reported a similar study on Al2O3 and SiO2. It is predicted from this characteristic that even though the square-shaped fillers share strong interaction, the increased volume fraction of square-shaped particles can uprate the thermal conductivity than circular-shaped fillers. Kareem 26 has reported a similar work on carbon fiber-SiC epoxy composites.

Heat flux (W/m·K) in (a) 54 nm square-shaped and (b) 60 nm circular-shaped BeO-based epoxy nanocomposites with 5% volume fraction.
Conclusions
In the study, the epoxy nanocomposites have been modeled with five different nanoparticles—Al2O3, BeO, BN, SiO2, and TiO2. The electrical and thermal performances of epoxy composites have been analyzed in an FE environment. Contemplating all the results, it is apparent that with the increase in volume fraction, both electric fields and thermal conductivity increase subject to the filler material, filler size, and filler shape. Besides, the following points are worth conclusive: With low inherent permittivity, the BeO-based epoxy nanocomposites with 60 nm-sized circular fillers at 5% volume fraction offer electric fields as low as 1.78 × 10⁸ V/m. It is nearly 1.5 times that of the fields in the neat epoxy dielectric. Besides, with the same configurations, the thermal conductivity improves to 7.4 W/m·K is a very high value than the unfilled epoxy (0.17 W/m·K). However, the SiO2 and BN-based epoxy nanocomposites offer electric fields as low as 1.27 × 10⁸ V/m and 1.29 × 10⁸ V/m with a 5% volume fraction, respectively, but the heat flux and conductivity are inferior in comparison with BeO-based nanocomposites. It is significant to note that although square-shaped fillers exhibit strong surface interaction for heat transfer mechanism, it would require further addition of nanofillers as square fillers are smaller in surface area. And it is also true that loading the base material would further enhance the electric fields. It is overtly observed from the results that BeO-based epoxy nanocomposites promised superior performance that offer a perfect blend of electrical and thermal properties among the others analyzed in the study. However, it is entirely reliant on the priority, i.e. electrical performance or thermal behavior for a specific application.
The presented study is proceeding to investigate and characterize the interfacial dynamics in the bulk of the material. It is recommended to synthesize and characterize the material analyzing the actual effects of the presented cases with a definite filler loading of specific shape and size of the nanofiller(s).
Footnotes
Declaration of conflicting interests
The author(s) declared no potential conflicts of interest with respect to the research, authorship, and/or publication of this article.
Funding
The author(s) received no financial support for the research, authorship, and/or publication of this article.