
Abstract
It has been demonstrated that adding a few percent of nanoscale reinforcements, leads to remarkable improvement in mechanical properties of the polymers such as stiffness, damping, and energy absorption. These lightweight materials are attractive substitutes for the heavy metallic structural parts in the automotive, military, aerospace and many other industries. However, due to complexity of these multiphase materials, accurate modeling of their behavior in real loading cases is still ambiguous. The impact simulation is a vital step in design procedure of a vehicle, where a strain rate-dependent model of its components is required. In this paper, an elasto-viscoplastic modeling procedure of the polymer-based nanocomposites, assuming the elastic behavior of the nano-phase is presented; whereas the polymeric matrix deformation is dependent to the loading rate and is characterized by the method of Genetic algorithm optimization-based fitting to the experimental observations. By introducing a modified Halpin-Tsai method, the nanocomposite is then modeled as a homogenized material where the modification algorithm is the main challenge. A combination of approaches including parametric analysis, central composite design of experiments and response surface method is proposed to modify the tangent modulus of the polymeric matrix to be passed as the input to the Halpin-Tsai equations. Finally, the procedure is implemented to a set of epoxy-GNP nanocomposites under unidirectional compressive loads with different rates and the stress-strain curves are predicted with a decent precision.
Introduction
The innovative lightweight materials are increasingly focused by researchers over the last two decades due to their valuable energy and cost saving potential.1,2 Thanks to the incredible stiffness and strength, the nanomaterials (e.g. Carbon Nano Tubes (CNTs), Graphene Nano Platelets (GNPs) and…) are found to be attractive reinforcements to be added to the polymers.3-5 Taking the advantages of both polymers and nanomaterials, a polymer-based nanocomposite could be a lightweight, easily formable, highly energy absorbing and stiff material. Furthermore, a nanomaterial could be used as a secondary reinforcement to the polymer-based composites. Lazar et al. 6 studied the effect of adding Nano Silica (SiO2) to the Epoxy-Fiberglass composite as the secondary reinforcement and observed the effect on the modulus and damping factor of the resultant nanocomposite. The welding strength could also be improved using the nanomaterials. Subramani et al. 7 investigated the dispersion effect of Silicon Carbide (SiC) nanoparticles within the stir zone in a Friction Stir Welding (FSW) process of AZ31B magnesium alloy joints and a remarkable improvement was observed in the joint ultimate tensile strength. However, the Computer Aided Engineering (CAE) analysis of the models containing nanocomposite materials is still faced with reliability problem, due to material modeling complexity. Many researches have been conducted on this issue especially in the last decade. Prediction of the elastic properties of nanocomposites have been widely investigated in the literature.8-10
Despite the success in prediction of stiffness, natural frequencies and vibration, buckling analysis and…, the linear elastic models of nanocomposites are not capable to predict the large deformation, strain rate-dependent and plastic flow in these materials. It is demonstrated that deformation of the polymer-based materials is highly dependent to the loading rate.11-13 Ignoring this dependence in the finite element transient dynamic simulations, could lead to remarkable faults in accurate prediction of the real behavior of the system. Automotive and aerospace impact problems are two major areas where the strain rate effects are very important and unignorable. There are very limited studies in the literature, addressing the strain rate-dependent modeling of the nanocomposites. Shadlou et al. 14 presented a model for prediction of the yield stress and elastic modulus of epoxy-GNP nanocomposite. They used the Halpin-Tsai model for multiscale modeling of the nanocomposite and modified the equations based on experimental observations to compensate the error of ignoring GNP imperfections and non-uniform distribution. However, their model is not giving any information about the plastic deformation.
Goldberg introduced a procedure similar to the Ramaswamy-Stouffer state variable constitutive model which had been developed for predicting the viscoplastic response of metals. 15 These equations were originally developed to predict the high temperature, inelastic deformation of metals. In this model, the strain rate-dependent viscoplastic deformation of the polymer-based composites is calculated using an associated flow rule and the Bodner-Partom model. 16 This model was further extended by Goldberg 17 to take into account the hydrostatic stress effects. This method has been successfully used in many researches to model the strain rate-dependent deformation of polymers and polymer-based composites.18,19 Moreover, Shojaeefard et al. 20 improved the Goldberg’s model in finding the material parameters using a Genetic Algorithm based optimization method.
In this study, the Goldberg’s constitutive equation is developed by a novel procedure to predict the elasto-viscoplastic behavior of the polymer-based nanocomposites. In the first step, the polymeric matrix model is calibrated by the method presented by Shojaeefard et al. 20 The Halpin-Tsai micromechanical model is employed in the step-wise linearization method for multiscale homogenization purpose of the nanocomposite material. The Halpin-Tsai model is developed for isotropic materials. On the other hand, the flow-induced anisotropy does not let the isotropic condition remain in the plastic deformation phase. Consequently, the Halpin-Tsai micromechanical model is not always valid to be used after the material is reached the yield stress. Therefore, an experimental based parametric study procedure is introduced to modify the tangent modulus of the pure polymer to be used in the Halpin-Tsai model even in the plastic deformation region. This is a general procedure which could be used for all of the polymeric materials with arbitrary behavior after the yield. The proposed model is verified by implementation on the epoxy-GNP nanocomposites, taking into account the variable loading rates and GNP volume fractions. The results show a very good prediction accuracy, especially if the generated response surface covers the design range of loading rate.
Elasto-viscoplastic modeling of the polymeric matrix
Polymer constitutive equations
It is demonstrated that making use of the Drucker-Prager yield criterion, assuming a linear correlation between the yield function and hydrostatic stress, improves accuracy of the theoretical estimations
21
and helps to eliminate the yield over-estimation problem which is observed mainly in polymers.22,23 The 3D flow rule is summarized in the form presented by Goldberg
17
which is stated in equation (1). In this equation, D0 and n are the material parameters representing the maximum inelastic strain-rate and material dependence to the strain-rate respectively. The state variables in this model (

Material parameters identification
The purpose of this section is to find the set of material parameters which describes the material behavior in the most accurate manner. A genetic algorithm optimization-based method which is developed by Shojaeefard et al. 20 is employed in this research to find the material parameters of Epoxy in accordance with the Goldberg constitutive model.
Numerical solution of the constitutive equations
Since the constitutive equation (1) cannot be formally integrated, achieving a closed-form solution for this equation is not possible. Hence, fourth order Runge-Kutta method, the well-known numerical integration routine is employed to find the time dependent state variables by an explicit iterative approach.24,25
Multi-scale modeling of the nanocomposite elasto-viscoplastic behavior
In this section, the procedure of extending the elasto-viscoplastic model of the pure polymers to the polymer-based nanocomposite, under unidirectional loads is described. After characterization of the polymeric matrix, a sequence of operations as will be discussed later in section 3.2 is applied and the result will be a model describing the rate-dependent deformations of a polymer reinforced with the Nano-sized reinforcements.
The well-known Halpin-Tsai micromechanical model is used as the main bridge between the pure polymer and the polymer-based nanocomposite. Despite the simple and straight-forward modeling procedure of the elastic behavior of nanocomposites, the Halpin-Tsai model is demonstrated to be not effective in prediction of the material behavior after the plastic deformation onset. This incapability is originating from the fundamental assumptions in derivation of the Halpin-Tsai equations. Then, the proposed algorithm which is the main contribution of this research will be introduced in this section to illustrate the multi-scale homogenization procedure and to compensate the Halpin-Tsai model incapability in prediction of the after yield behavior of the polymer-based nanocomposites.
The flowchart for multi-scale homogenization procedure of polymer-based nanocomposites in modeling the elasto-viscoplastic behavior of these materials is illustrated in Figure 1. In this figure, the circular numeric symbols are representing step counter functions where the outputs (represented by outward rectangular boxes) are resulted from the inputs (represented by inward rectangular boxes) by the mathematical equations (2) to (7). The big rectangular box (as shown by dashed lines) demonstrates a single iteration (time-step) in solving the differential equations, where the inward and outward solid rectangular boxes represent the inputs and outputs at each of the iterations. Therefore the matrix stress level in start of each step
1- Calculation of the inelastic strain increment in the polymeric matrix (equation (2))

2- Calculation of the elastic strain increment in the polymeric matrix (equation (3))

where
3- Calculation of the stress increment in the polymeric matrix (equation (4))

where
4- Calculation of the new stress, as the input for the next iteration (equation (5))

5- Calculation of the tangent modulus of the polymeric matrix (

6- Calculation of the modified tangent modulus of the polymeric matrix. The Halpin-Tsai model is not expected to be valid in plastic deformation condition. Because there are two fundamental assumptions in development of the Halpin-Tsai micromechanical model: (1) The material remains in the linear phase under the loading condition, (2) The material is isotropic (i.e., the mechanical properties are independent of the direction). In the current step, the tangent modulus of the polymeric matrix in the plastic deformation phase is modified to be used in the Halpin-Tsai multi-scale model. The flowchart for this modification process is depicted in Figure 2.
For initial evaluation purpose, at least two experimental unidirectional tensile or compressive tests will be carried out on the nanocomposite samples. Then, the uncalibrated model predictions will be compared to the experimental results. If the model predictions are not matched with the experimental values, the model calibration procedure will be required by modification of the plastic tangent modulus. The first step in the calibration procedure is parametric analysis to detect the most effective parameters on the tangent modulus. Then, a Design of Experiment (DOE) will be performed to construct a response surface based on the root mean square error minimization in the variation ranges of the effective parameters. The result will be a calibrated model in the range of the selected parameters.
7- The effective tangent modulus of the nanocomposite
8- The effective tangent modulus of the nanocomposite for the next

Therefore, the tangent modulus and stress are calculated for all steps and finally the stress-strain relation of the nanocomposite material under the uniaxial force will be achieved.

The flowchart of modeling the elasto-viscoplastic behavior of the polymer-based nanocomposites: The circular numeric symbols are representing step counter. The big rectangular box (as shown by dashed lines) demonstrates a single iteration (time-step) in solving the differential equations, where the inward and outward solid rectangular boxes represent the inputs and outputs at each of the iterations.

Flowchart for modification of the polymeric matrix tangent modulus.
Implementation of the method on epoxy-GNP nanocomposites
The experimental research 14 on the epoxy-GNP nanocomposite is chosen as the reference in the present work to implement and verify the proposed elasto-viscoplastic model. In this research, deformation of the epoxy-GNP nanocomposites have been studied in the unidirectional tensile and compressive loading cases, to investigate the effect of loading rate and GNP volume fraction variations.
Pure polymer model calibration
A Genetic algorithm optimization is defined and solved to find the set of material parameters for epoxy resin describing the elasto-viscoplastic deformations with minimum error. Since the experimental data is available for the loading rates
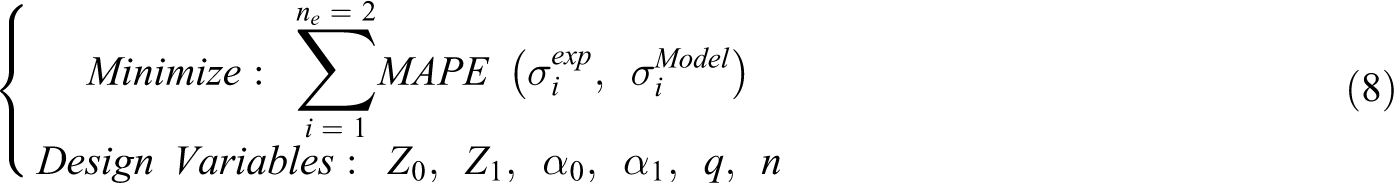
where, ne is the number of experiments which are used in model calibration and MAPE is the Mean Absolute Percentage Error 26 and q is a material parameter representing “hardening”.
Optimal values of the material parameters are reported in Table 1. The reported values lead to the most possible accurate model in the loading rates which are used in the calibration process (
The elastic
12
and the calibrated viscoplastic parameters of epoxy in range of

The calibrated model predictions are compared to the experimental results in Figure 3. Since model calibration is carried out based on these loading cases (

Comparison of the calibrated viscoplastic epoxy model and the experimental results in loading rates of
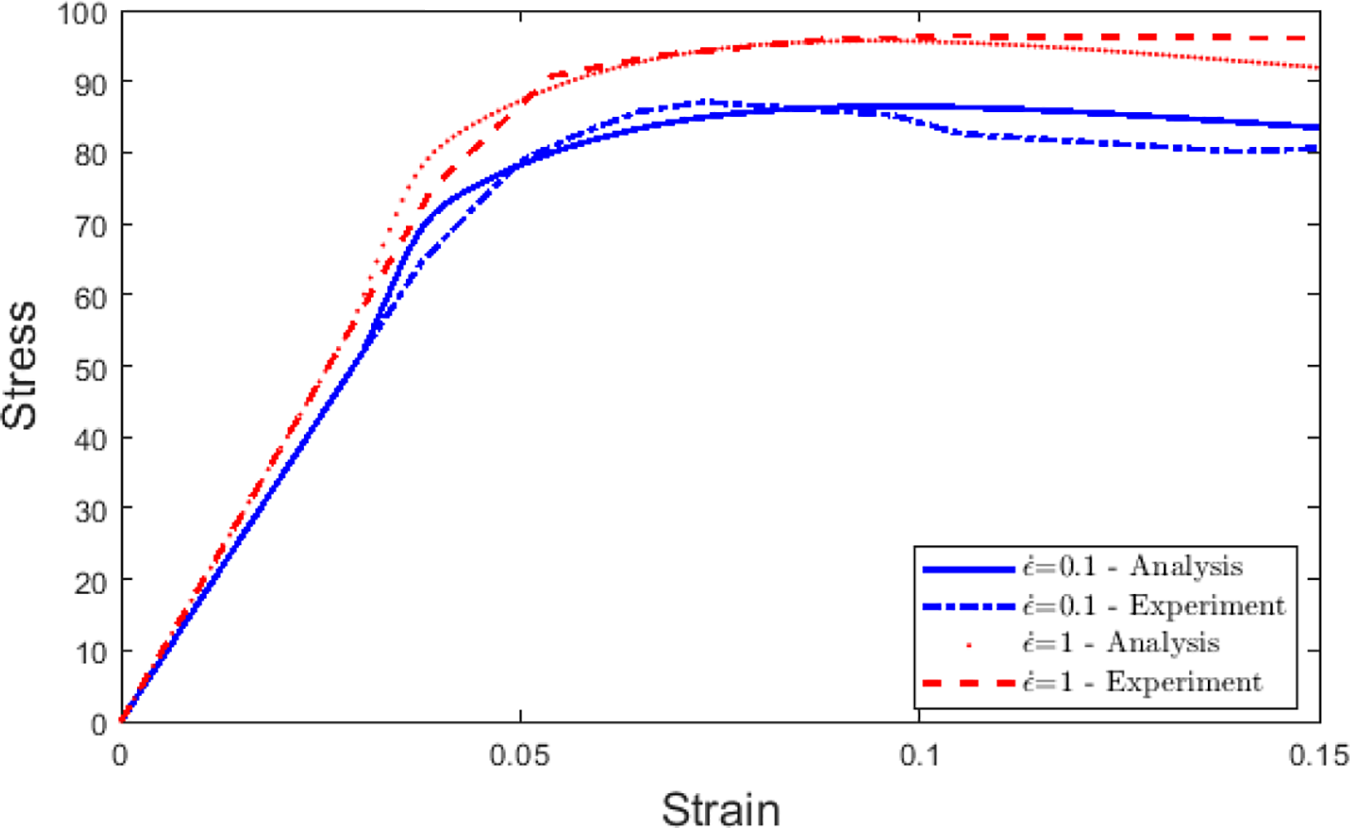
Comparison of the calibrated viscoplastic epoxy model and the experimental results in loading rates of
The resulted MAPE for different loading cases, including the calibration and validation tests on the epoxy resin.

Evaluation of the tangent modulus
The available experimental tests on epoxy-GNP nanocomposite includes combinations of 4 different loading rates and 3 different GNP volume fractions (totally 12 tests). In this section, the experimental results of nanocomposite unidirectional compression test with GNP volume fraction of 0.5% and loading rate of
Geometric and elastic properties of GNP. 28

The tangent modulus of the pure epoxy is compared in two cases in Figure 5: (1) predicted by the elasto-viscoplastic calibrated model of epoxy. (2) Calculated from the experimental results applied reversely to the Halpin-Tsai equations. As it is obvious in the figure, the model accuracy is remarkably reduced once the strain reaches 4%. Figure 6 shows the portion of elastic and inelastic strain versus the strain level in loading rate of

Comparison of tangent modulus of the polymeric matrix in loading rate of

The portion of elastic and inelastic strain versus the strain level in loading rate of
Halpin-Tsai is founded based on isotropic material assumption
Although the pure epoxy is an isotropic material, the flow-induced anisotropy eliminates the isotropic situation after the material is reached the yield strain.
Consequently, epoxy is not still an isotropic material after yield and the pure epoxy’s tangent modulus in the plastic region is not extendable to the Halpin-Tsai equations without any modifications.
Modification of the tangent modulus
Parametric study
A parametric analysis is performed to study the probable parameters affecting the desired tangent modulus. The parametric study includes the following cases on the experimental unidirectional compressive tests:
The loading rate is constant and the effect of GNP volume fraction is observed.
The GNP volume fraction is constant and the effect of loading rate is observed.
The results are reported for all of the 12 tests available in Figures 7 and 8, referring to the cases “a” and “b” respectively. There is no correlation between GNP volume fraction variations and the desired tangent modulus in any of the four different loading cases, as shown in Figure 7. But inverse relation between the desired tangent modulus and the plastic strain is clearly visible. A nonlinear polynomial seems to be appropriate to describe this relation.

Investigation of the GNP volume fraction effect on the desired tangent modulus with respect to the plastic strain.

Investigation of the loading rate effect on the desired tangent modulus with respect to the plastic strain.
On the other hand, a correlation between the loading rate and the desired tangent modulus is observed in Figure 8. According to the results shown in this figure, a straight correlation exists between the loading rate and the desired tangent modulus. In other words, in all of the three sub-figures corresponding to the three different GNP volume fractions, the tangent modulus and loading rate are generally behaving in a straightly correlated way. The reason is delaying effect of the polymer’s viscosity. In other words, as the loading rate increases, the material finds lower time to deform under the applied load. As a summary of the parametric study, the two parameters plastic strain and loading rate are the most important factors affecting the desired tangent modulus.
Central composite design
A second order model is chosen to describe the relation between the desired tangent modulus and the effective parameters identified in the previous section. There are many methods for second order fitting. The most popular method is Central Composite Design (CCD). This method was introduced by Box and Wilson
29
for the first time in 1951. In this method, the design space includes nf factorial points, nc central points and
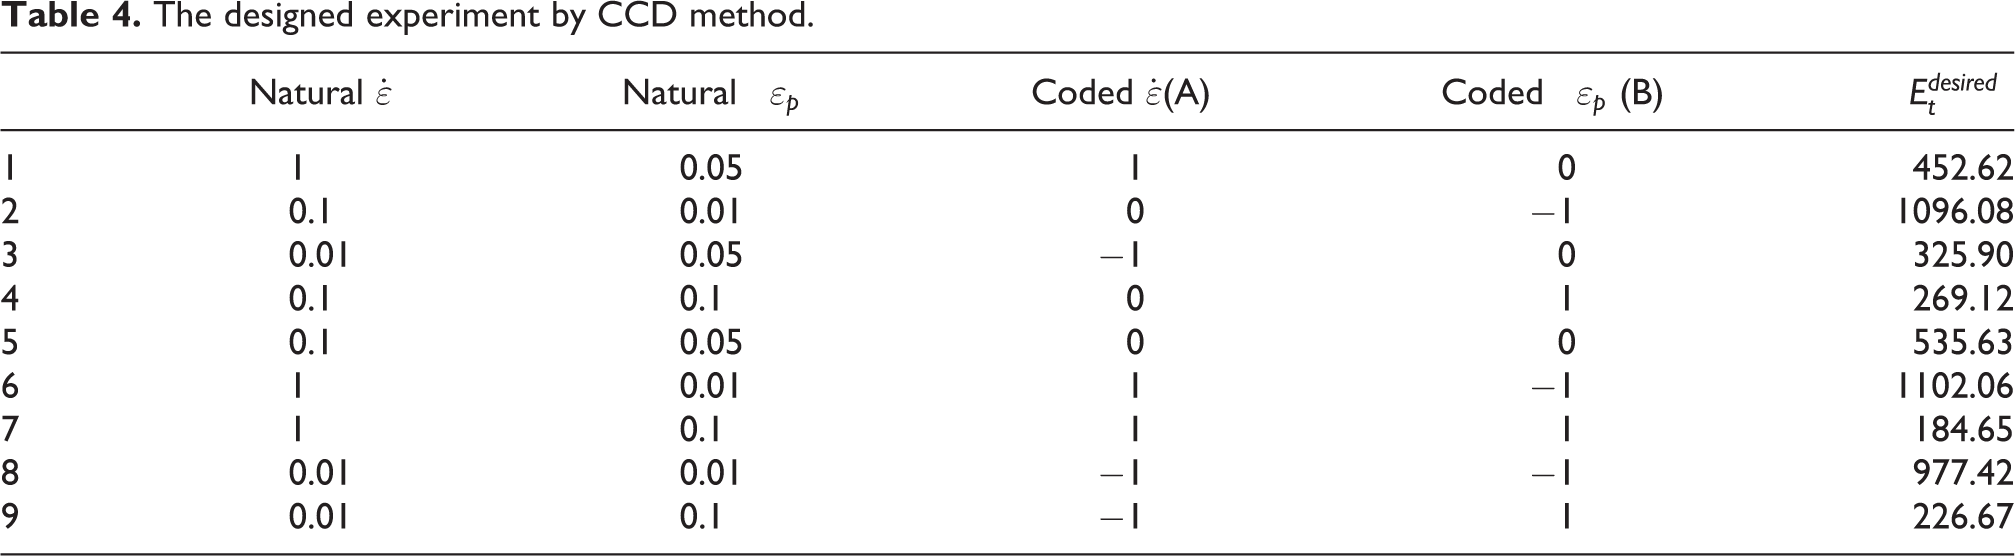
Table 4 describes the designed experiment space by the central composite design method. These experiments are defined on the epoxy-GNP nanocomposites with volume fraction of 0.5% and strain rates of 0.01 s−1, 0.1 s−1and 1 s−1 respectively. The experiments 6–9 in Table 4 correspond with the factorial points. Moreover, a central point regarding to the zero level of all parameters is considered which is reported in Table 4 as the fifth experiment. Also, the experiments 1–4 in this table are referred to the 4 axial points. In order to satisfy the orthogonality condition, the value of a which represents the axial points’ level in Box-Wilson model is found 30 from equation (9):

The designed experiment by CCD method.
Response surface method
The response surface method is applied to the design space introduced in the previous section, using the Minitab software and the response surface equation (10) is reported below. Moreover, the 3D plot of the response surface with respect to the design parameters is shown in Figure 9. The inverse relation between tangent modulus and plastic strain is well-described in this figure by the second order surface. The figure shows that the inverse effect of plastic strain dominates the straight effect of the loading rate in the design range.


3D plot of the second order response surface describing the relation between tangent modulus, plastic strain and loading rate.
Results and verification
As explained in the previous section, only 3 of the 12 available tests were used in modification process of the tangent modulus. In this section, the accuracy of the calibrated elasto-viscoplastic model of the nanocomposites for all of the available experimental results, including the three calibration experiments and the other 9 experiments is investigated. Figure 10 depicts the comparison between three cases: (1) Experimental results. (2) The proposed model estimation with modified tangent modulus. (3) The proposed model estimation with original tangent modulus for the nanocomposite with GNP volume fraction of 0.25%. Furthermore, model estimation error in all of the cases is presented in Table 5.
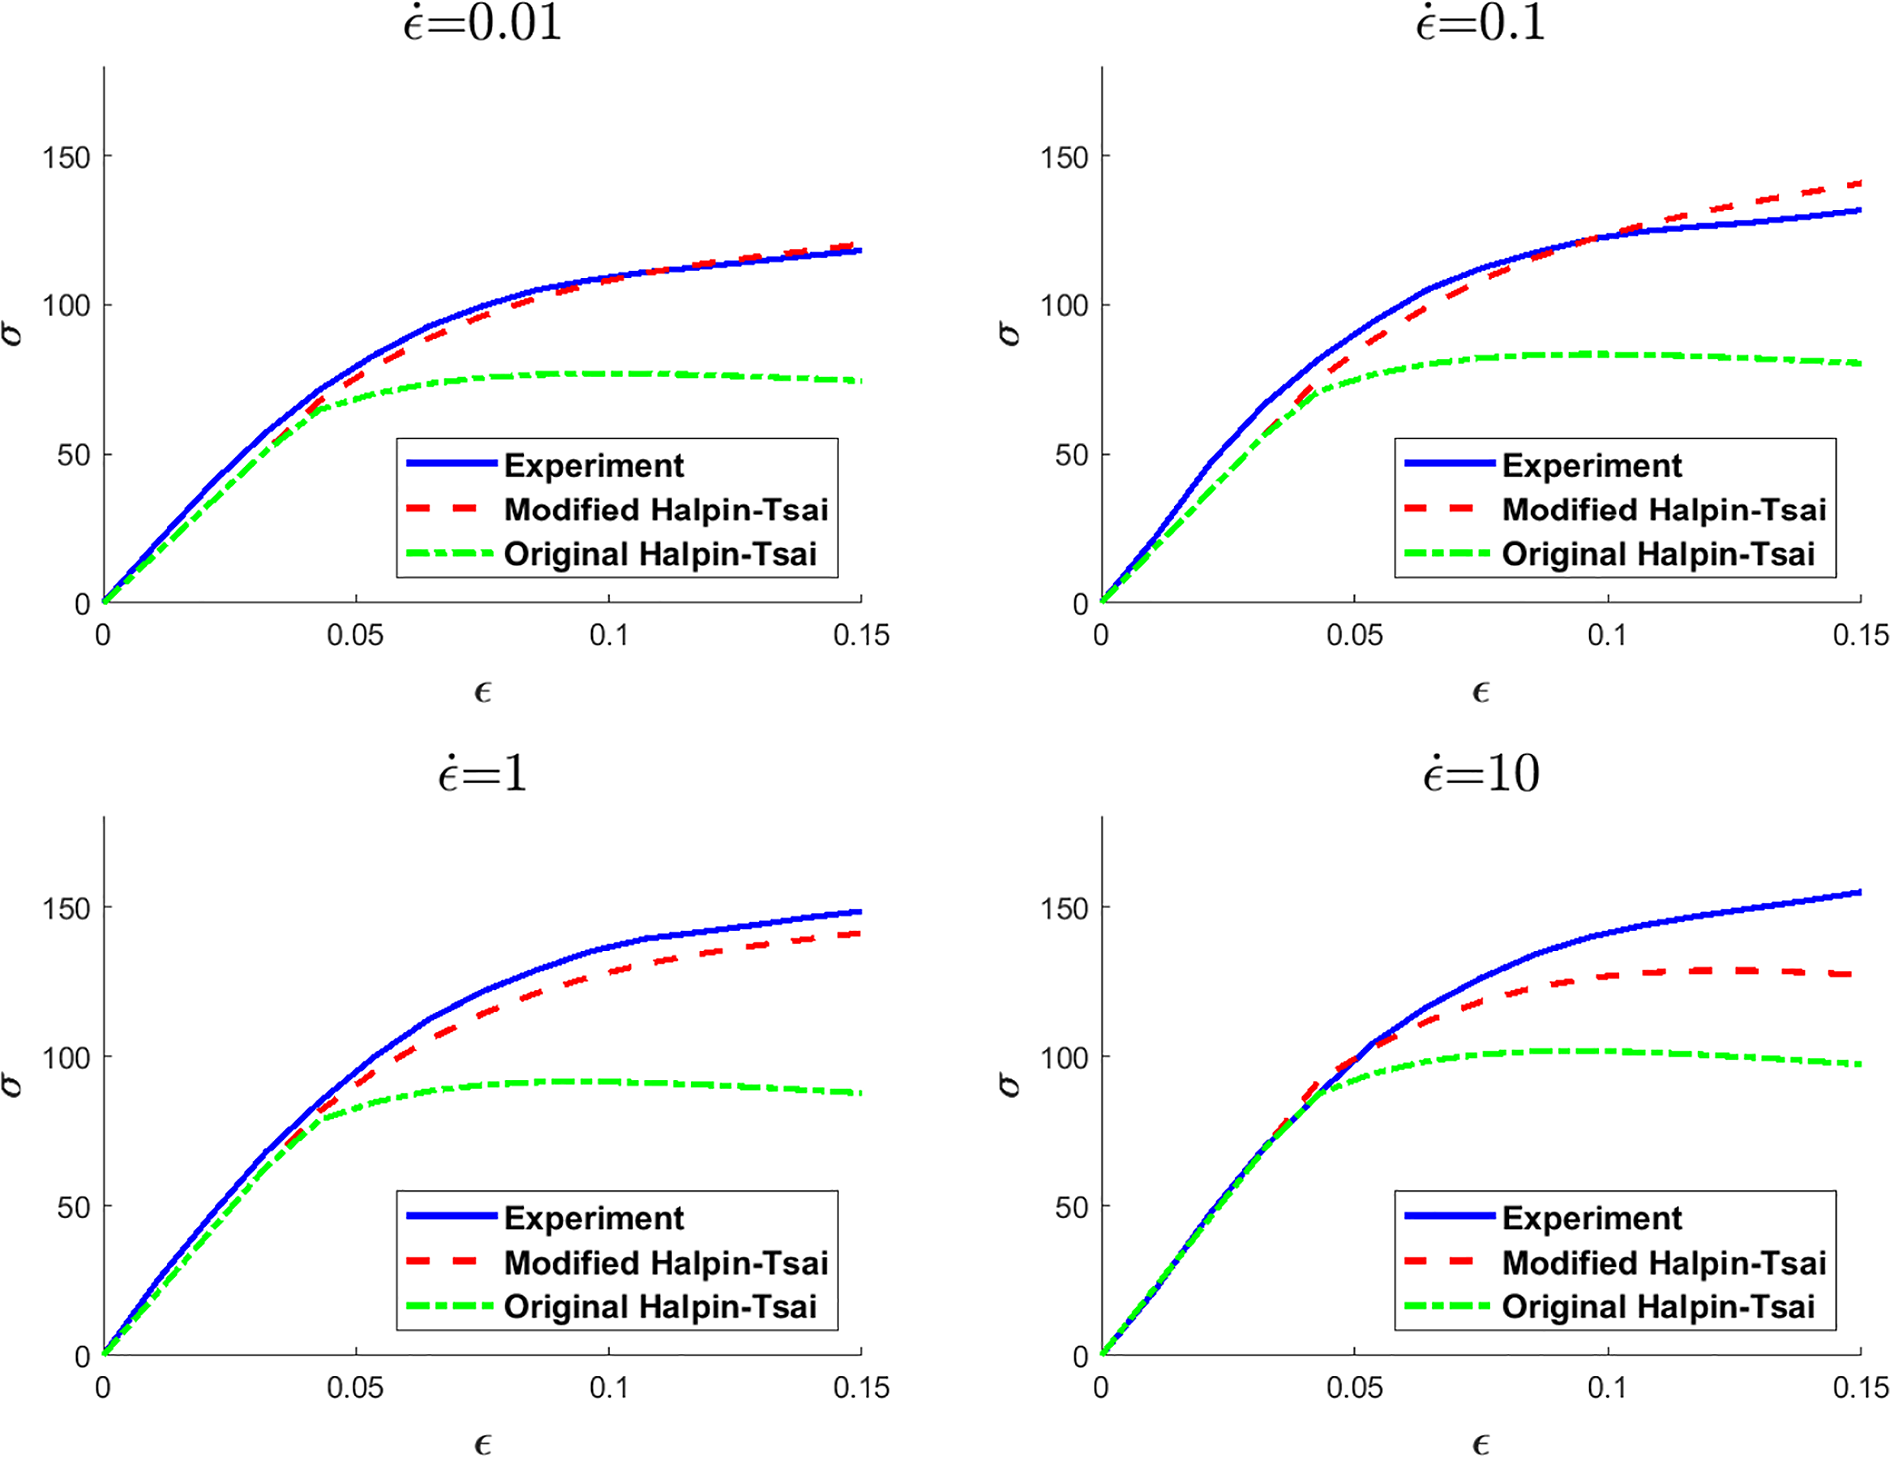
Stress-strain curve for the epoxy-GNP nanocomposite with GNP volume fraction of 0.25% for different loading rates: A comparison between three cases: (1) Experimental results. (2) The proposed model estimation with modified tangent modulus. (3) The proposed model estimation with original tangent modulus.
MAPE error of model prediction compared to the experimental results.

According to Table 5, the experiments number 5 to 7 which were used previously as the response surface model inputs are predicting the experimental results with average accuracy of 98.08%. Since the model is calibrated based on these experiments, the resulted accuracy could not be considered as a big achievement. On the contrary, the experiments number 1, 2, 3, 9, 10 and 11 are predicted with the average accuracy of 96.5%. Given that these experiments are not used in the modification process of the tangent modulus, the resulted accuracy is remarkable. Although the experiments number 4, 8 and 12 are not covered in the loading range of the response surface model, the average accuracy of 92.17% is acceptable for the applications where a relatively high accuracy is required.
According to Table 5, if the original tangent modulus of the pure epoxy is used in the model, the stress level in the plastic phase is estimated up to 48% lower than the real value. This fact affirms necessity of modifying the tangent modulus of the matrix before being used in the Halpin-Tsai micromechanical model.
Summary and conclusions
In this paper, a new procedure was developed for elasto-viscoplastic modeling of the polymer-based nanocomposites in unidirectional loading conditions. The first step is identification of the polymer matrix model parameters using a GA-based optimization approach. In the second step, the nanocomposite is modeled as a homogeneous material keeping the elasto-viscoplastic characteristics. Since the base of this method is linearization of the nanocomposites deformation in the loading span (including the elastic and plastic regions), the inconsistency between the Halpin-Tsai micromechanical model’s assumptions and the real behavior of the material was discussed and resolved. To verify the proposed method, the experimental uniaxial compressive tests performed by Shadlou et al. 14 were taken as the reference and the material model for epoxy-GNP nanocomposites was constructed using the proposed method. As a summary, the following results are concluded from this study:
Since the basic Halpin-Tsai model assumption (isotropic material) is violated by the flow-induced anisotropy, the presented model is not accurate without modification of the polymeric matrix tangent modulus. Otherwise, the underestimation error occurs.
The presented model implemented on epoxy-GNP nanocomposites shows the average accuracy of 97.64% for the calibrated data, 96.5% for the validation data and 92.17% for the data which is not covered by the calibration range.
The high accuracy of the response surface method in estimation of the modified tangent modulus, while only 3 experiments were used for model calibration shows that the second order regression is a good choice for modeling the response surface. Moreover, this good prediction acknowledges that the effective parameters on the modified tangent modulus are identified correctly.
Footnotes
Declaration of conflicting interests
The author(s) declared no potential conflicts of interest with respect to the research, authorship, and/or publication of this article.
Funding
The author(s) received no financial support for the research, authorship, and/or publication of this article.