
Abstract
The present work gives an outline of electrochemical and thermal properties of single ion conducting polymer-layered silicate nanocomposites. High resolution transmission electron microscopy and X-ray diffraction studies prove the intercalation of poly(vinylidene fluoride-co-hexafluoropropylene) (PVdF-HFP) inside the interlayer galleries of montmorillonite (MMT) silicate. Scanning electron microscopy reveals porosity increases with increasing MMT concentration. Room temperature ionic conductivity of 1.2 × 10⁻⁵ S cm−1 has been obtained. Electrochemical stability increases with increasing MMT concentration attaining the highest value of 4.2 V at 20 wt.% of MMT. Thermal properties substantiate decomposition temperature in the range of 300–374°C for the nanocomposites.
Keywords
Introduction
Rechargeable batteries are one of the key components in today’s modern world with widespread applications in telecommunication, portable consumer devices, light vehicles and uninterruptible power supplies. Traditional rechargeable batteries with liquid electrolytes have several limitations due to their bulky size and leakage problem. The replacement of liquid electrolytes with non-aqueous thin films of polymer electrolytes offers numerous advantages to battery technologies.1,2 The main advantage of polymer electrolytes lies in their free-standing ability. 3 Ionic conductivity, mechanical strength and interfacial stability of polymer electrolytes can be enhanced by incorporating nanofillers in the polymer electrolyte. 4 Ulaganathan et al. studied charge transport, mechanical and storage performances of sepiolite based composite polymer electrolytes and reported a higher ionic conductivity in the order of 3.58 × 10⁻⁴ S cm−1. 5 Jayanthi et al. studied nanocomposite polymer blend electrolytes comprising PEO, P(VdF-HFP), LiClO4, and nanofiller SrTiO3 and they reported that ionic conductivity of the prepared polymer electrolytes increases on increasing the concentration of SrTiO3 and they achieved maximum ionic conductivity of the order of 10−5 S cm−1 for 2 wt.% SrTiO3-added system. 6 Jayanthi reported higher ionic conductivity of 95.72 × 10⁻⁴ S cm−1 at room temperature in solid polymer blend electrolytes with PEO and P(VdF-HFP) as polymers, ZnTr as salt, and 1-butyl-3-methylimidazolium hexafluorophosphate as ionic liquid. 7 However, polymer electrolytes have the disadvantage of the movement of both cation and anion which decreases the self-life time of the battery. Hence, it is a technologically challenging idea to develop polymer electrolytes with single ion conduction.
One of the interesting fields in solid polymer electrolytes is the single ion conductor. 8 The main disadvantage of conventional single ion conductors is low ionic conductivities ∼10−7 S cm−1. 9 Recently, it was reported that some polymers with alumina-based single ion conductors showed relatively high ionic conductivity of 10−5 to 10−6 S cm−1. 10 A new strategy for creating single ion conducting polymer electrolytes with improved electrical and thermal properties is the fabrication of polymer silicate nanocomposites (PSNs). PSNs are a class of materials in which nanoscale clay particles are molecularly dispersed within a polymer matrix. 11 Intercalation of polymers into inorganic layered silicates is an excellent approach to design new organo-inorganic nano assemblies possessing a unique molecular architecture with huge interfacial area. 12 Aranda and Ruiz-Hitzky have found that intercalated PEO molecules between silicate galleries impede polymer crystallization resulting in higher ion conductivity compared with systems without clays. 13 Among the most commonly used inorganic layered hosts, montmorillonite (MMT) is a favoured choice in view of its special features of high aspect ratio (∼1000), high cation-exchange capacity (∼80 mequiv./100 g), appropriate interlayer charge (∼0.55) and length scale (clay channel width ∼16 Å). Intercalating polymer in layered clay can produce huge interfacial area to sustain the mechanical integrity and the ions residing inside the interlayer galleries can move through the polymer chains making the system single ion conducting. 14
The present paper describes the development of novel nanocomposite single ion conductor based on PVdF-HFP intercalated inside the interlayer galleries of surface modified MMT. Electrochemical and thermal properties have been thoroughly studied by changing the concentration of MMT to observe the effect of intercalation on the properties of the nanocomposites.
Experimental
The nanocomposite polymer electrolyte films were synthesized by solution casting technique. At first 2 g of PVdF-HFP was dissolved in 150 ml acetone with constant stirring at 50°C. Modified MMT was dispersed in tetrahydrofuran (THF) by ultrasonication for 20 mins and subsequently added to the PVdF-HFP solution after 6 h of constant stirring. The resulting solution was further stirred for 10 h followed by ultrasonication for 30 min. The viscous slurry thus obtained was cast on to the petri dishes and dried for 2 days under vacuum to get flexible, free-standing thin films. Different samples were synthesized taking MMT concentrations as 5, 10, 15 and 20 wt.%, respectively. The formation of PVdF-HFP-MMT intercalated nanocomposites was confirmed with high resolution transmission electron microscope (HRTEM, Jeol JEM-2100). X-ray diffraction patterns of the prepared films were obtained with a Rigaku Miniflex diffractometer. Surface morphology of the electrolyte films was observed by scanning electron microscope (SEM, Jeol 6390 LV). The ionic conductivity of the nanocomposite films was determined by AC impedance measurements using a Hioki 3532-50 LCR HiTester in the frequency range from 42 Hz to 5 MHz. The electrochemical stability was determined by linear sweep voltammetry by using electrochemical workstation (CHI600C). In linear sweep voltammetry the potential between the working electrode and the reference electrode is swept linearly in time and the corresponding current at the working electrode is measured. At a particular voltage the species get oxidized or reduced and that is registered as a peak or trough in the current signal. The experimental setup consists of a potentiostat and a three-electrode cell to deliver a potential and monitor its change in current. The three-electrode system consists of a working electrode, a counter electrode and a reference electrode. In the present work, the experiment was performed at room temperature by applying an anodic voltage to a cell consisting of nanocomposite polymer electrolyte with Pt as working and counter electrode and Ag/AgCl as reference electrode, at a sweep rate of 0.1 V s−1. The potential window refers to a potential of Pt working electrode with respect to Ag/AgCl reference electrode. Thermal stability was investigated using thermogravimetric analyzer (TGA), Perkin Elmer model STA 6000. TGA measurements were performed in nitrogen atmosphere keeping the nitrogen flow rate of 20 ml min−1 using four different heating rates of 5°C, 10°C, 15°C and 20°C min−1.
The transport number of the polymer electrolyte nanocomposites was calculated by applying Wagner’s polarization technique by measuring the residual electronic current passing through the polymer electrolytes. 15 The Wagner polarization cell Ag/polymer electrolyte nanocomposites/Ag was prepared to measure the transport number. A fixed DC potential of 300 mV was applied across the blocking electrodes and the current passing through the cell was measured as a function of time for 6 h so that the sample attains the fully polarized state. Initial total current (IT), which is the sum of ionic (Ii) and electronic (Ie) currents (IT = Ii + Ie) and final current after polarization, which is only the electronic current Ie have been measured. The cation transport number was found to be 0.78, 0.84, 0.88 and 0.91 for the PVdF-HFP-MMT nanocomposite polymer electrolytes containing 5, 10, 15 and 20 wt.% of MMT, respectively. This shows that only one ion is essentially moving and this proves the single ion conducting nature of the polymer electrolytes.
Results and discussion
Transmission electron microscopy studies
Figure 1 depicts the HRTEM micrograph of the dispersed state PVdF-HFP-MMT nanocomposite containing 15 wt.% MMT. When the inorganic silicate layers maintain a parallel registry of pristine silicates and are separated by ultrathin (1.3–5 nm) polymer matrix the nanocomposite is referred to as intercalated. It is evident from Figure 1 that layered silicate forms ordered intercalated tactoids that consist of many parallel silicate layers. The silicate layers are in stacks of several layers separated by ∼2.8 nm confirming the intercalation of PVdF-HFP inside the interlayer galleries of MMT. In Figure 1 the dark lines represent an individual clay layer, whereas the bright area represents the PVdF-HFP matrix.

HRTEM micrograph of PVdF-HFP-15% MMT nanocomposite.
X-ray diffraction studies
Figure 2 shows the XRD patterns of pure PVdF-HFP, modified MMT and PVdF-HFP-MMT nanocomposites with varying concentrations of MMT. Modified MMT exhibits (001) reflection peak at 2θ = 4.4° corresponding to the basal spacing (d001) of 2 nm. Figure 2 reveals that when modified MMT is added to PVdF-HFP, the peak position of (001) plane shift towards the lower angle side indicating that there is an increase in the basal spacing of MMT. This suggests that PVdF-HFP intercalates into the nanometric gallery of the modified MMT confirming the formation of nanocomposites. 16 The changes in d-spacing are given in Table 1 and it is observed that with increasing MMT concentration d-spacing increases up to 15 wt.% of MMT beyond which d-spacing gets saturated indicating no further intercalation. At 15 wt.% of MMT, the d-spacing is 2.7 nm which is also corroborated from HRTEM result. Figure 2 also shows that with increasing MMT concentration amorphicity of the system increases. As PVdF-HFP intercalates into the interlayer galleries of MMT, microstrain is expected to develop in the MMT layers which arises due to increased MMT gallery width. Microstrains have been calculated by employing single-line approximation method. 17 This procedure involves extraction and analysis of Gaussian (βG) and Lorentzian (βL) components of the integral breadth of a single Bragg peak. After correcting the instrumental broadening, the remaining line broadening (β) is due to crystallite size (βcryst) and retained strain (βstrain) broadening. 18 Therefore,

XRD patterns of (a) PVdF-HFP, (b) MMT and PVdF-HFP-x% MMT nanocomposites where (c) x = 5, (d) x = 10, (e) x = 15, (f) x = 20.


where ε is the microstrain. The microstrain and d-spacing values of (001) peak are given in Table 1. It is observed that with increasing MMT concentration, d-spacing and microstrain (ε) increases confirming intercalation. Beyond 15 wt.% of MMT, d-spacing and microstrain remains the same indicating saturation level of intercalation.
The degree of crystallinity

where Ac represents the area under crystalline peaks and AT represents total area under the amorphous and crystalline peaks. Area under crystalline and amorphous regions have been calculated by deconvoluting the XRD peaks using the OriginPro software. The function mode of Gaussian has been used for the fitting of the XRD spectra. Pure PVdF-HFP has degree of crystallinity of 29% which is decreased to a large extent when MMT has been incorporated. The Xc values for PVdF-HFP-MMT nanocomposite polymer electrolytes are found to be 15.2%, 13.3%, 9.5% and 9.4% for MMT concentrations of 5, 10, 15 and 20 wt.%. Degree of amorphicity can be calculated from Xc values using amorphicity as (100 − Xc)%. Accordingly, the degree of amorphicity for the nanocomposite polymer electrolytes are 84.8%, 86.7%, 90.5% and 90.6%, respectively for MMT concentrations of 5, 10, 15 and 20 wt.%. It is well known that amorphicity is required for easier movement of the ions through the polymer chains. Incorporation of MMT in PVdF-HFP matrix increases the degree of amorphicity as evident from XRD results and it is highly desirable for getting higher ionic conductivity.
2θ, d-spacing and microstrain of PVdF-HFP-MMT nanocomposite polymer electrolytes.

Morphological studies by SEM
Surface morphology of the PVdF-HFP-MMT nanocomposites with varying concentrations of MMT is shown in Figure 3. Pure PVdF-HFP has porous morphology as revealed from Figure 3(a). When MMT is added porosity increases and the pores get more interconnected as observed from Figure 3(b) and (c). As intercalation takes place, the polymer chain reorganization is hindered and, in the process, pores get widened and interconnected. With increasing MMT concentration, intercalation increases resulting in an increase in porosity and pore connectivity. Due to better connectivity of the pores the ions can easily move resulting in high ionic conductivity.

SEM micrographs of (a) pure PVdF-HFP and PVdF-HFP-x% MMT nanocomposites where (b) x = 5, (c) x = 15.
Ionic conductivity studies
Nyquist plots of PVdF-HFP-MMT nanocomposite polymer electrolytes are shown in Figure 4(a). The semicircle in the high frequency range is due to the parallel combination of bulk resistance and capacitance of the polymer electrolytes whereas the low frequency spike is ascribed to the charge transfer resistance and capacitance of the electric double layer formed at the electrode/electrolyte interface. 19 The spike should be parallel to the imaginary axis for an ideal capacitive behavior, but the experimental data deviate from ideal behavior in the form of phase-angle frequency dependence. This capacitive dispersion is due to irregularities at the electrode/electrolyte contact and the interfacial impedance can be described by a constant phase element (CPE)
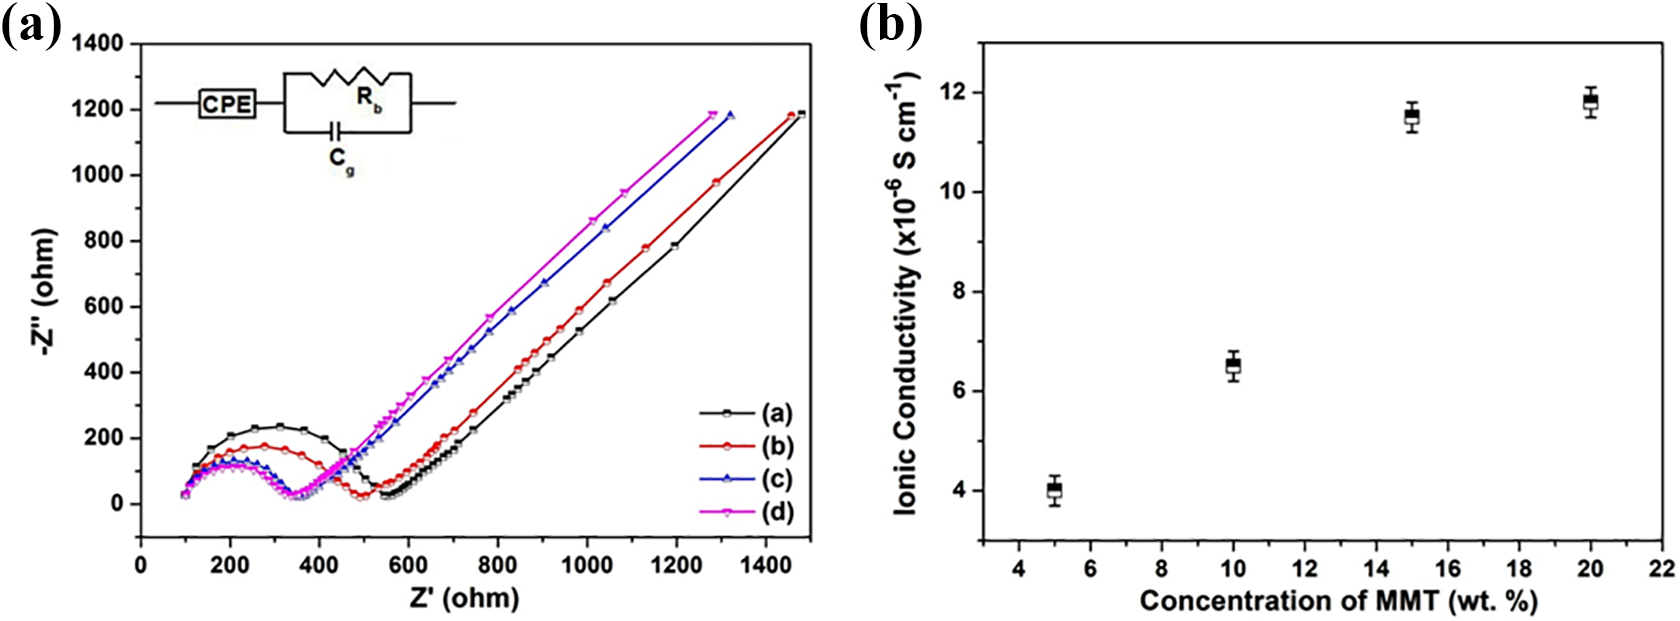
(a) Nyquist plots of PVdF-HFP-x% MMT nanocomposites where (a) x = 5, (b) x = 10, (c) x = 15, (d) x = 20. (b) Variation of ionic conductivity of PVdF-HFP-MMT nanocomposites with varying concentration of MMT.

where Cdl is the double layer interfacial capacitor independent of angular frequency (ω) and ½ < n < 1. From the experimental data the response of the electrode/electrolyte/electrode cell can be simulated as an equivalent circuit consisting of bulk resistance Rb in parallel with geometrical capacitance Cg in series with the constant phase element (CPE) as shown in inset of Figure 4(a). The total impedance of the equivalent circuit can be expressed as

Equation (5) implies that the Nyquist plot consists of a semicircle with its center on the real impedance axis and a vertical spike. It is observed that as the MMT concentration increases the semicircle shrinks and decays due to shifting towards higher frequencies which is attributed to a decrease in ionic resistance of the electrolyte at high MMT concentration. The intercept on the real axis gives the bulk resistance (Rb), which decreases with increasing concentration of MMT. From the measured values of bulk resistance, ionic conductivity has been evaluated and the variation of ionic conductivity with MMT concentration is shown in Figure 4(b). The ionic conductivity increases from 4 × 10⁻⁶ S cm−1 for the composite with 5 wt.% of MMT to 1.2 × 10⁻⁵ S cm−1 for the composite with 20 wt.% of MMT. As the MMT concentration increases, intercalation increases that enhance the number of mobile ions resulting in increased ionic conductivity. Beyond 15 wt.% of MMT, intercalation saturates and the ionic conductivity remains same.
The temperature variation of ionic conductivity as shown in Figure 5(a) reveals that with increasing temperature ionic conductivity increases which can be explained by the free volume model. 20 With increasing temperature free volume increases leading to increased segmental motion of polymer chains, which facilitates ion motion through the polymer matrix resulting in increased ionic conductivity. This behavior is indicative of the empirical relation given by
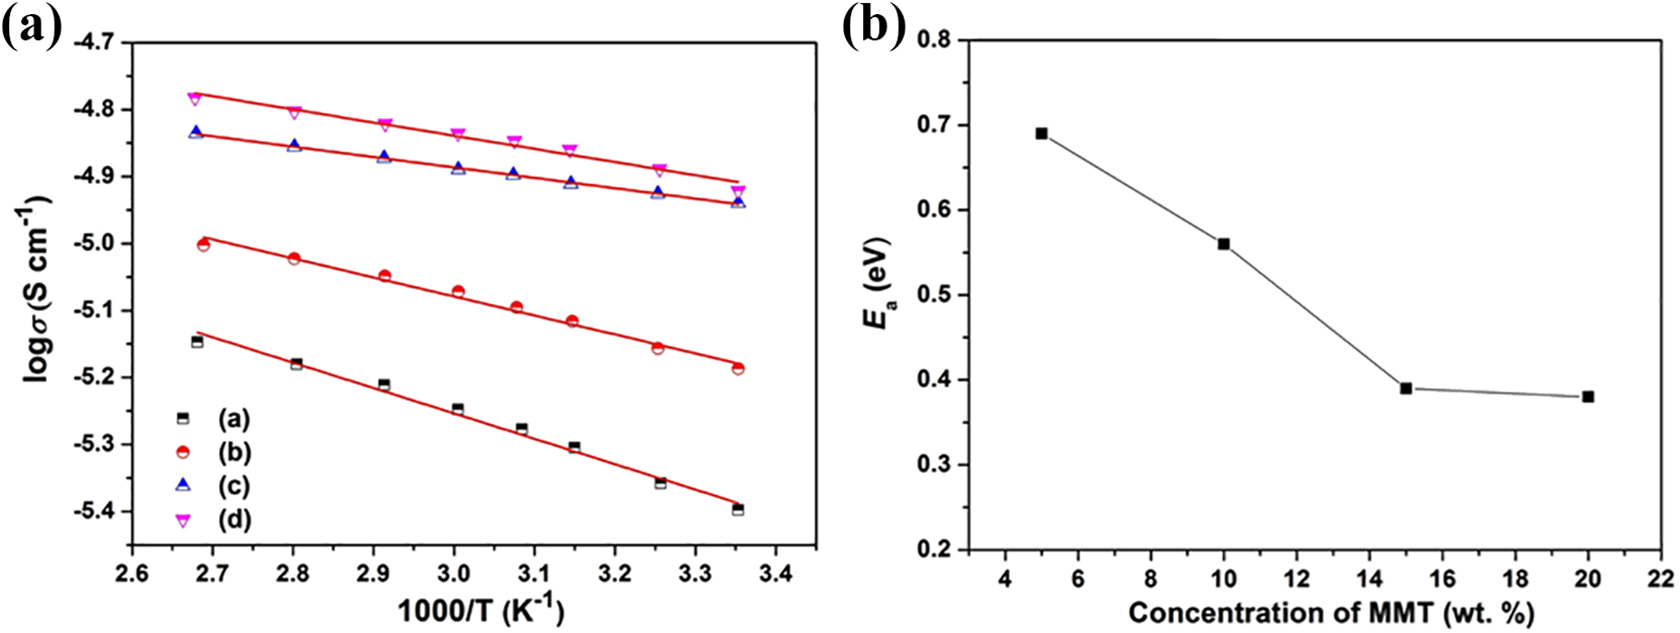
(a) Temperature dependence of ionic conductivity of PVdF-HFP-x% MMT nanocomposites where (a) x = 5, (b) x = 10, (c) x = 15, (d) x = 20. (b) Variation of activation energy of PVdF-HFP-MMT nanocomposites with varying concentration of MMT.

where σ0 is the pre-exponential factor, Ea is the activation energy, k is the Boltzmann constant and T is the temperature. 21 From the fitting of the plots, the activation energy has been calculated and the variation of activation energy with varying concentration of MMT is shown in Figure 5(b). It is observed that activation energy decreases with increasing MMT concentration. As the activation energy decreases the ions can easily jump from one coordination site to another leading to rise in ionic conductivity.
Electrochemical stability
The electrochemical stability of the nanocomposite electrolytes is shown in Figure 6. It is observed that the nanocomposite containing 5 wt.% of MMT has electrochemical stability up to 2.8 V. With increasing MMT concentration, the electrochemical stability increases attaining the highest value of 4.2 V at ∼20 wt.% of MMT concentration. As the polymer intercalates inside the interlayer galleries of MMT, the high aspect ratio MMT prevent the direct contact of the polymer with the electrodes and effectively impede the electrode-electrolyte passivation reaction resulting in enhanced electrochemical stability. Inset of Figure 6 schematically depicts that when PVdF-HFP intercalates inside the MMT layers, the contact area of the polymer with electrode decreases, which reduces the electrode-electrolyte passivation reaction at the electrode-electrolyte interface leading to an increase in the electrochemical stability.

Electrochemical stability of PVdF-HFP-MMT nanocomposites with varying concentration of MMT where MMT concentrations are (a) 5%, (b) 10%, (c) 15%, (d) 20%.
Thermogravimetric analysis
Figure 7 shows the thermal stability results of pure PVdF-HFP, pure MMT and PVdF-HFP-MMT nanocomposites at a heating rate of 20°C/min. It is observed that pure PVdF-HFP and MMT start decomposing at 435°C and 316°C, respectively, while the decomposition temperatures of the nanocomposites are 374°C, 349°C, 334°C and 334°C for the MMT concentrations of 5, 10, 15 and 20 wt.%, respectively. The decomposition temperature decreases with increasing MMT concentrations which can be attributed to the fact that as PVdF-HFP intercalates into the interlayer galleries of MMT, the chain conformation of PVdF-HFP chains changes resulting in increased amorphicity of the polymer. Degree of amorphicity increases with increasing concentration of MMT as observed from XRD results and this has been corroborated by TGA results. Due to increased amorphicity, the C-H bonds of the polymer get destabilized leading to decrease in the decomposition temperatures. The decrease in crystallinity is also corroborated from the XRD results as shown in Figure 2. The thermal degradation kinetics and thermal activation energy (Ea) of degradation can be evaluated from the TGA plots using Flynn-Wall-Ozawa (F-W-O) non-isothermal integral isoconversion method. 22 According to this method the degradation kinetics is governed by the following equation
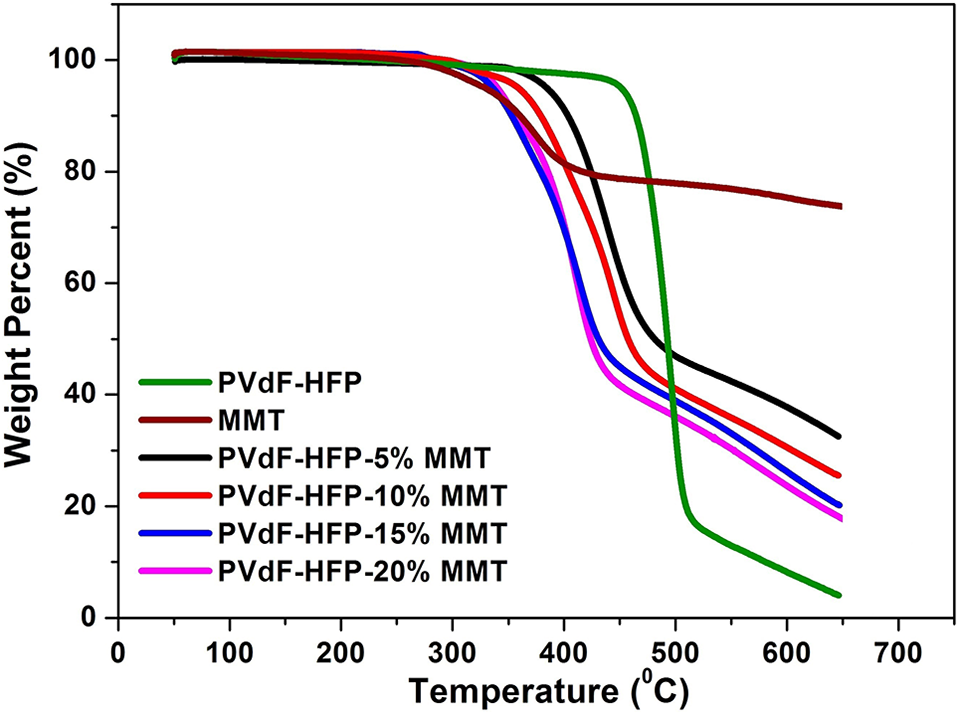
TGA plots of pure PVdF-HFP, pure MMT and PVdF-HFP-MMT nanocomposite polymer electrolytes.

where β, R and T are the heating rate, gas constant and temperature, respectively. Four different heating rates (β) of 5°C, 10°C, 15°C and 20°C min−1 have been utilized in the present study to evaluate the degradation kinetics. The plots of logβ vs. 1000/T at different heating rates for different degree of conversion (α) for the PVdF-HFP-MMT nanocomposites are shown in Figure 8(a). The degree of conversion (α) is defined as

where Wt, W0, Wf are the weights at time t, initial and final weights, respectively. The α values are chosen as 0.1, 0.2, 0.3, 0.4, 0.5 and 0.6 for the plots shown in Figure 8(a). The curves shown in Figure 8(a) have been fitted with equation (6) and it is observed that the fitted lines are nearly parallel indicating the possibility of single reaction mechanism or the unification of multiple reaction mechanisms. 23 The thermal activation energies have been calculated from the fitted graphs shown in Figure 8(b). The variation of thermal activation energy with varying concentrations of MMT is shown in Figure 8(b). The figure shows that thermal activation energy increases initially with increasing conversion rate becoming stable after 50% (α = 0.5) conversion indicating that the two components, PVdF-HFP and MMT has started decomposing before 50% conversion. From Figure 8(b), it is also observed that Ea decreases as the concentration of MMT increases. The decrease in Ea indicates that with increasing concentration of MMT, the amorphicity of the nanocomposite increases which is also corroborated from XRD results.

(a) Plots of logβ vs. 1000/T at different conversions ranging from 0.1 to 0.6 of PVdF-HFP-x% MMT nanocomposites where (a) x = 5, (b) x = 10, (c) x = 15, (d) x = 20. (b) Plots of activation energy vs. degree of conversion of PVdF-HFP-MMT nanocomposite polymer electrolytes.
Conclusions
HRTEM micrograph confirms that PVdF-HFP has been intercalated into the interlayer galleries of MMT which is also corroborated from XRD results. The d-spacing of MMT interlayers increases with increasing MMT concentration up to 15 wt.% of MMT and saturates at higher MMT concentration as confirmed from XRD results. SEM micrographs show that with increasing MMT concentration, porosity increases. Room temperature ionic conductivity of the order of 10−5 S cm−1 has been obtained for the nanocomposite single ion conductor. The ionic conductivity increases with increasing MMT concentration attaining the highest value of 1.2 × 10⁻⁵ S cm−1 at 20 wt.% of MMT. Electrochemical stability increases with increasing MMT concentration and maximum electrochemical stability up to 4.2 V has been obtained. Decomposition temperature in the range of 300–374°C has been obtained for the nanocomposite electrolytes and the thermal activation energy (Ea) decreases with increasing concentration of MMT.
Footnotes
Declaration of conflicting interests
The author(s) declared no potential conflicts of interest with respect to the research, authorship, and/or publication of this article.
Funding
The author(s) received no financial support for the research, authorship, and/or publication of this article.