
Abstract
The current study was aimed to fabricate a transdermal drug delivery system (TDDS) containing Ketoprofen (KTF) and Pregabalin (PGB) for controlled drug release, avoidance of the first-pass metabolism, and increased patient compliance. TDDS of KTF and PGB were formulated using the solvent casting method. Various ratios of hydrophilic polymer (HPMC) and hydrophobic polymers (Eudragit L-100 and Ethyl Cellulose) were employed for the formulation of transdermal patches. PG and oleic acid were used as a permeation enhancer, and PEG-400 was employed as a plasticizer. Surface morphology has confirmed the uniform distribution of drugs throughout the matrix and the excellent compatibility of the selected ingredients. All the formulation showed folding endurance of more than 300, which exhibited that all patches have suitable mechanical strength. One hundred percent flatness also showed good stability of the patches and suitability of the selected ingredients. In vitro drug permeation studies showed more than 97% and 95% release of PGB and KTF, respectively, during the in vitro dissolution studies. The drug release mechanism investigated with various kinetic models exhibited that the rate of drug release was not dependent on initial concentrations of the drug present in the patches and was following the drug diffusion mechanism.
Introduction
The transdermal route has the edge over other drug delivery routes because of avoidance of gastric irritation and hepatic first-pass metabolism, protection of the drug from harsh GI environment, 1 fewer chances of systemic side effects of potent drugs, 2 ease of administration, 3 sustained drug release 4 and site-specific delivery. 5
Pregabalin (PGB) is an anti-epileptic drug. It is (S)-3-(aminomethyl)-5-methylhexanoic acid. Though the precise mechanism of action of Pregabalin still needs to be elucidated, it has a high affinity for auxiliary subunit, alpha2delta (A2D) of voltage-gated calcium channels (VDCCs) present in the CNS. 6 It has been employed for nerve pain 7 and is required to be administered three to four times/day by oral route to achieve its therapeutic response to treat partial seizures.
Ketoprofen is a widely employed analgesic for managing chronic pain conditions. Also used for the treatment of the various acute and long-term inflammatory pathological conditions, such as colonic adenocarcinoma and rheumatoid arthritis. 8 Ketoprofen presented to be more potent (20 times) in carrageenin-induced abscesses in the rat than ibuprofen and also has higher potential in reducing inflammation (80 and 160 times) than phenylbutazone and aspirin, respectively. 9 Ketoprofen is considered as one of the most potential cyclo-oxygenase inhibitors at a concentration well within the range of therapeutic plasma levels.
Ketoprofen has also shown its potential as an antipyretic agent alternative to ibuprofen and acetaminophen. 10 Notwithstanding that Ketoprofen is useful in several treatments, but it poses side effects in the GIT, hepatic, and renal systems. 11 To reduce the prevalence of systemic events pertinent to Ketoprofen, the development of TDDS has been most crucial.
The present work aims at designing the transdermal patch of the Pregabalin and Ketoprofen as model drugs and evaluation of the feasibility of these drugs for TDDS, the compatibility of the drugs and excipients and the effect of various concentrations of eudragit L-100 and HPMC on the drug release mechanism of TDDS. Moreover, the in vitro permeation and the release behavior of the drug from formulated patches were also investigated.
Thus, the present study aims at developing a controlled release (CR) dosage form (DF) of Pregabalin and Ketoprofen other than injectables and oral route. Therefore, a non-oral and non-invasive transdermal delivery system of Pregabalin and Ketoprofen was considered to be developed and investigated to attain CR of both drugs over an extended time period to reduce the frequency of administration of drugs.3,4
To date, no studies in the literature have reported the combination of Pregabalin and Ketoprofen to our knowledge. This study has shown the usage of the combination of these drugs for the first time. The current study exhibited that transdermal patches of Pregabalin and Ketoprofen have the potential for the sustained delivery of drugs and can be employed to reduce the side effects pertinent to the frequent drug dosing.
Materials and methods
Materials
Pregabalin was purchased from Hilton Pharma (PVT) Limited, Ketoprofen was purchased from PRIME LABS. (PVT) LTD, Ethyl Cellulose (EC) was bought from Kima Chemicals, Zibo Co., Ltd (Shandong, People’s Republic of China), Eudragit L100 was from Rohm GmbH&Co. KG (Darmstadt, Germany), HPMCK4 M Polyethylene glycol 400, Propylene Glycol and oleic acid were from Sigma Aldrich, (St Louis, MO, USA).
Methods
Fabrication of HPMC and EC based transdermal patches of Pregabalin and Ketoprofen
Pregabalin was dissolved in water with 0.43 mL of HCl, and Ketoprofen was dissolved in Methanol to prepare solutions with magnetic stirring. Similarly, separate solutions of Oleic acid and PG were prepared in Methanol. Pregabalin and Ketoprofen transdermal patch were fabricated by using the solvent casting technique. The precise quantity of HPMC was measured and dissolved in 20 ml of Methanol: chloroform (1:1) by magnetic stirring for 30 min at 300 rpm at 30°C. After complete mixing of HPMC, EC was added to the HPMC solution and again stirred for 30 min. Later, a plasticizer, PG 30%w/w was added to the polymeric solution. Oleic acid and PG stock solutions were added to the polymeric solution. Then, both drugs solutions were added to the polymeric solution and were magnetically stirred for another 30 min. After that, the solution was poured into a petri dish, followed by peeling off the formulated patches from the mould after 48 h. The patches were stored in a desiccator after wrapping in the aluminium foil.
Preparation of transdermal patches of Pregabalin and Ketoprofen containing HPMC and Eudragit L100
The procedure used for preparing patches containing HPMC and Eudragit L100 was the same as preparing patches from HPMC and EC (Table 1).
Composition of different transdermal formulations containing Pregabalin and Ketoprofen.
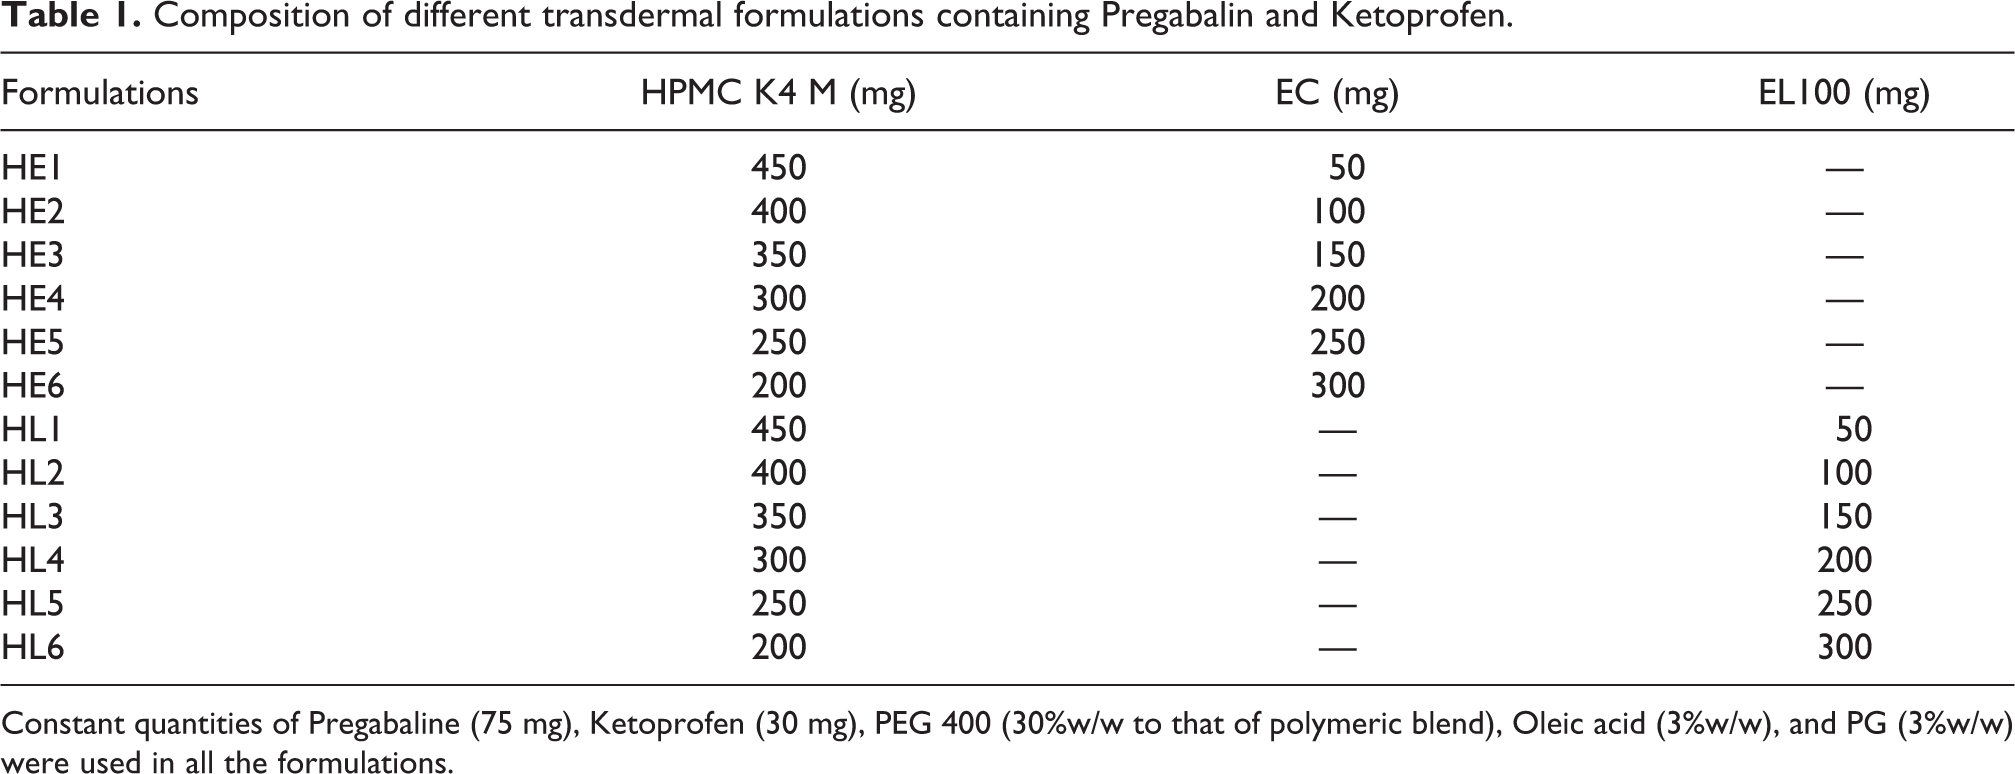
Constant quantities of Pregabaline (75 mg), Ketoprofen (30 mg), PEG 400 (30%w/w to that of polymeric blend), Oleic acid (3%w/w), and PG (3%w/w) were used in all the formulations.
Pre-formulation studies
Fourier-transform infrared spectroscopy (FTIR)
It was performed to investigate the drug/drug and drug/polymer interactions. This study was performed at 500–4000 cm−1 wavenumber using the FTIR (Bruker, Germany). To check the compatibility, transmittance was taken for individual samples and its combination.
Samples were analyzed by (T-80 UV/vis Spectrophotometer, PG Instrument, Midland, Canada) after filtration at
Surface morphology
Light microscopy
A small portion (1 × 1 cm2) of each patch was cut and observe under the light microscope at 40× power lens.
Scanning electron microscopy (SEM)
It was done for selected formulations to evaluate the drug particle morphology and surface morphology of formulated patches to check that either polymers and drugs were uniformly distributed or not. 15 Quanta scanning electron microscope was used to take SEM photographs at 120×, 240×, and 500×.
Evaluation of physicochemical characterization of transdermal patches
Thickness
Three different points were selected to measure the thickness of the patch by digital micrometer screw gauge. 16
Folding endurance
It was calculated by folding a patch constantly at the same point till it cracked/broke. The no. of times the film was folded till it broke represented the value of folding endurance. 17
Weight variation
Formulated patches were dried for 4 h at 60°C. Four pieces with the same dimensions from different parts of the patch were cut and measured on a digital balance. Weight uniformity was calculated by measuring individual wt. and avg. wt. of the patch. 18 The patches were subjected to weight variation by individually weighing 10 selected patches randomly, and the average was calculated.
Flatness
A defined length of strips was cut from patches, and the non-uniformity in flatness was checked by measuring the length of the patches again after a specific time. If there was zero percent constriction, then it was considered as 100% flatness. 19
pH determination
The formulated patches were kept in distilled water for one hour. To accurately measure the surface pH of the patch, the pH meter electrode was kept near the patch surface for one minute to equilibrate the reading. 20
Percentage moisture loss
All formulated patches were weighed accurately. After weighing, patches were stored at room temperature in a desiccator having anhydrous calcium chloride (CaCl2). Three days later, the films were reweighed. The following formula was used to calculate moisture loss 21 :

Content uniformity
A strip of 2 × 2 cm2 cut from the patch was dissolved into methanol phosphate buffer pH 7.4 and was stirred for 24 h to ensure complete dissolution. Drugs analysis was performed after filtration with a membrane filter 22 and dilution with methanol phosphate buffer. 23
Drug permeation studies
In vitro drug permeation
Cellulose acetate synthetic membrane (0.22 µm diameter) was mounted on the Franz diffusion cell to act as a barrier between the patch and receptor compartment. The Franz diffusion cell was filled with methanol phosphate buffer pH 7.4 and maintained at a temperature of 37 ± 0.5°C. Receptor and donor compartments were screwed properly with a clipper. The solution in the Franz diffusion cell was magnetically stirred for 30 min 24 at 250 rpm. The sample was taken at 0.5, 1 h, 2 h,…8 h, and analyzed by UV Spectrophotometer.
Drug release mechanism
USP apparatus V, paddle method was used to study the influence of polymers on the drug release mechanism of patches. The dissolution studies were done with PBS 7.4 pH at a stirring rate of 50 rpm at 32.0 ± 1°C. At time points of 0, 1, 2 up to 12th hour, a specified volume of sample was taken, filtered through a membrane filter of diameter 0.2 µm and diluted with an equal quantity of PBS pH 7.4. The sample was then analyzed using UV-spectrophotometer, and absorbance for each sample was noted.
Results and discussion
Pre-formulation study
Drug-drug and drug-polymer compatibility study (FTIR)
FTIR spectra of drug-drug and drug-polymers have shown that the selected ingredients are chemically compatible with each other (Figures 1 and 2).

FTIR of: (A) Pregabalin; (B) Ketoprofen; (C) HPMCK4 M; (D) Ethyl Cellulose; (E) Eudragit L100; (F) Pregabalin and Ketoprofen; (G) HPMCK4 M and Ethyl Cellulose; (H) HPMCK4 M and EudragitL100.

Representation of FTIR analysis, (A) Pregabalin, HPMCK4 M, and Ethyl Cellulose; (B) Ketoprofen, HPMCK4 M, and Ethyl Cellulose; (C) Pregabalin, HPMCK4 M, and Eudragit L100; (D) Ketoprofen, HPMCK4 M, and Eudragit L100; (E) Pregabalin, Ketoprofen, HPMCK4 M, and Ethyl Cellulose; (F) Pregabalin, Ketoprofen, HPMCK4 M, and Eudragit L100.
The FTIR spectra of Pregabalin indicated absorbance peaks at wavenumbers 1680 cm−1 and 1553 cm−1, which corresponded to the bending of amide groups (C=O stretching) and (N–H bending). The absorbance peaks at 1374 cm−1 and 1428 cm−1 were due to the bending of alkanes (C–H) present in the molecule of Pregabalin. The absorbance at 1250 cm−1 wavenumber was because of stretching of C–O bond of carboxylic acid present in the structure of Pregabalin. The stretching of alkanes (C–H bonds) gave absorption peaks at 2957 cm−1 and 2878 cm−1. FTIR of Ketoprofen showed absorption peaks at around 2947 cm−1, 2856 cm−1 and 1700 cm−1 indicating the stretching of C–H bonds and C=O stretching of acid, respectively. The absorption peaks at 1554 cm−1 and 1464 cm−1 are due to C=C stretching of aromatic ring. The Figure 1 was showing the FTIR spectra of HPMC K4 M. The spectra of HPMC K4 M indicated a clear absorbance peak at wavenumber 941 cm−1, which might be due to the bending of unsaturated =CH bond. The absorbance peaks obtained at wavenumbers 1010 cm−1 and 1055 cm−1 were because of the stretching of C–O bonds present in the molecule confirming the presence of carboxylic acids. The medium absorbance peak observed in the FTIR spectra of EC at 1082 cm−1 showed the stretching of C–O bonds of alcohols present in the molecule. The absorbance peak obtained at wavenumber 1055 cm−1 was due to stretching of C–O bonds of ether groups present in the structure of EC. The two characteristic peaks observed in the FTIR spectrum of Eudragit L100 was at wavenumbers 1121 cm−1 and 1692 cm−1 which correspond to the C–O bond stretching and stretching of C=O bonds. This proves the presence of alcohol and carboxylic acid groups in the structure of Eudragit L100. The FTIR spectra of the mixture of Pregabalin and Ketoprofen showed absorption peaks from both drugs at the wavenumbers of 1642 cm−1, 1550 cm−1, 1410 cm−1, 1356 cm−1 and 1300 cm−1 which corresponds to the stretching of amide groups (C=O), (N–H) bending, bending of alkanes (C–H bonds) and stretching of C–N bonds, respectively. The FTIR spectra of mixture of HPMC K4 M and EC indicated two absorbance peaks. The absorbance peak at 1055 cm−1 is same as observed in FTIR spectrums of HPMC K4 M and EC alone, which corresponds to C–O bonds present in their respective structures. The absorbance peak observed at wavenumber 941 cm−1 corresponds to the =C–H bonds present in the chemical structure of HPMC K4 M. The spectra indicated that there is no significant change in the absorbance peaks of the mixture compared to individual polymers, therefore, it is suggested that no interaction occurred between the two polymers. The absorbance peaks in the spectrum of HPMC K4 M was observed at wavenumber 1055 cm−1, which was characteristic of C–O bonds in the polymer and the major absorbance peak in Eudragit L100 was around 1692 cm−1 and 1121 cm−1 specifying the presence of C–O and C=O bonds. The FTIR spectra of the mixture of HPMC K4 M and Eudragit L100 showed peak absorbance at 1119 cm−1 and 1700 cm−1, which have indicated little shift in the spectra but within the range. Hence, it can be said that both these ingredients did not interact with each other. The FTIR spectrum of the physical mixture of Pregabalin, HPMCK4 M and EC indicated characteristic peaks of each ingredient at their specified wavenumbers. The clear absorbance peaks at wavenumbers 1680 cm−1, 1428 cm−1 and 1374 cm−1 were due to the bending of amide groups (C=O stretching) and alkanes (C–H) present in the chemical structure of Pregabalin. The absorbance peaks corresponding to C–O groups present in the structures of both HMPCK4 M and EC were observed at 1082 cm−1, 1010 cm−1 and 1055 cm−1. The FTIR of the physical mixture of Ketoprofen, HPMC K4 M and EC indicated the distinct peaks of HMPC K4 M and EC at 1055 cm−1 and 941 cm−1 similar to the FTIR of physical mixture of HMPC K4 M and EC. The absorbance peak at wavenumber 1554 cm−1 was probably due to the stretching of C=C bonds of aromatic rings of Ketoprofen. The peak at 2946 cm−1 was might be due to the stretching of C–H bond in Ketoprofen. The absence of interaction of peaks of HPMC and EC with peaks of Ketoprofen showed that there were no interactions between the drug and polymers. The FTIR spectrum of mixture of Pregabalin, HPMC K4 M and Eudragit L100 showed the characteristic absorption peaks of Pregabalin, HPMC and Eudragit. The absorbance peaks at wavenumbers 2957 cm−1 and 2878 cm−1 were due to stretching of alkanes present in Pregabalin. Variable peaks observed in a range of 1680–1714 cm−1 were probably due to the slight shifting of peaks of Pregabalin at 1680 cm−1 or Eudragit at 1692 cm−1. The absorbance peaks of Pregabalin at 1553 cm−1, 1374 cm−1 and 1250 cm−1 were also present in the spectra of mixture. Also, a slight shift in the peak of Eudragit at 1121 cm−1 indicating C–O bonds stretching was observed at 1100 cm−1. The peak at 1050 cm−1 was same as appeared in the spectra of HPMC indicating the C–O bonds of carboxylic acid group. The conclusion from the above spectral analysis is that there was no significant interaction between Pregabalin, HPMC K4 M and Eudragit L100. FTIR spectrum of physical mixture of Ketoprofen, HPMC K4 M and Eudragit L100 was indicating clear peaks of absorbance at 1700 cm−1 and 119 cm−1 similar to the FTIR of physical mixture of 60 HPMC and Eudragit as discussed earlier. The peaks of Ketoprofen were visible in the spectrum at 2947 cm−1 and 2856 cm−1 indicating the stretching of C–H of alkanes. The aromatic rings of Ketoprofen are detected from the absorption peak at 1554 cm−1 which was probably due to the stretching of C=C bonds. It had been cleared from the FTIR spectra that there was no interaction between Ketoprofen, HPMC and Eudragit. The FTIR spectra of Pregabalin, Ketoprofen, HPMC K4 M and EC showed no significant interactions between these ingredients. The peaks observed in the mixture of Ketoprofen, HPMC and EC were present in this spectrum at 2946 cm−1, 1554 cm−1, 1055 cm−1 and 941 cm−1. These peaks were indicators of C–H bonds, C=C bonds, C–O bonds and unsaturated =C–H bonds present in the structures of Ketoprofen, HPMC and EC, respectively. The absorbance peaks corresponding to the peaks of Pregabalin were at 2957 cm−1, 1428 cm−1 and 1374 cm−1 which were due to the stretching and bending of alkanes (C–H) present in Pregabalin molecule. The FTIR of the mixture of Pregabalin, Ketoprofen, HPMC K4 M and Eudragit L100 showed absorbance peaks around wavenumbers 2957 cm−1, 2878 cm−1, 1553 cm−1, 1374 cm−1 and 1250 cm−1 corresponding to the peaks observed in the spectrum of Pregabalin, which were due to C–H stretching, N–H bending, C–H bending and stretching of C–O bonds in Pregabalin. A slight shift in the peak of C=O group of Ketoprofen from 1700 to 1714 cm−1 was possibly due to the constructive interference with C=O bonds present in Eudragit at 1692 cm−1. The observed peaks at wavenumbers 2856 cm−1 and 1464 cm−1 were resembling with the stretching of C=C of aromatic rings in Ketoprofen. It could be inferred in light of these results that there were no significant interactions between Pregabalin, Ketoprofen, HPMC and Eudragit used in this formulation.
Surface morphology
Light microscopy
Optical microscopy was done for three formulations of HPMC and EC and three formulations of HPMC and L-100 by optika light microscope. The images have shown the formation of drug and polymer matrix and exhibiting the uniform distribution of drugs throughout the matrix (Figure 3).
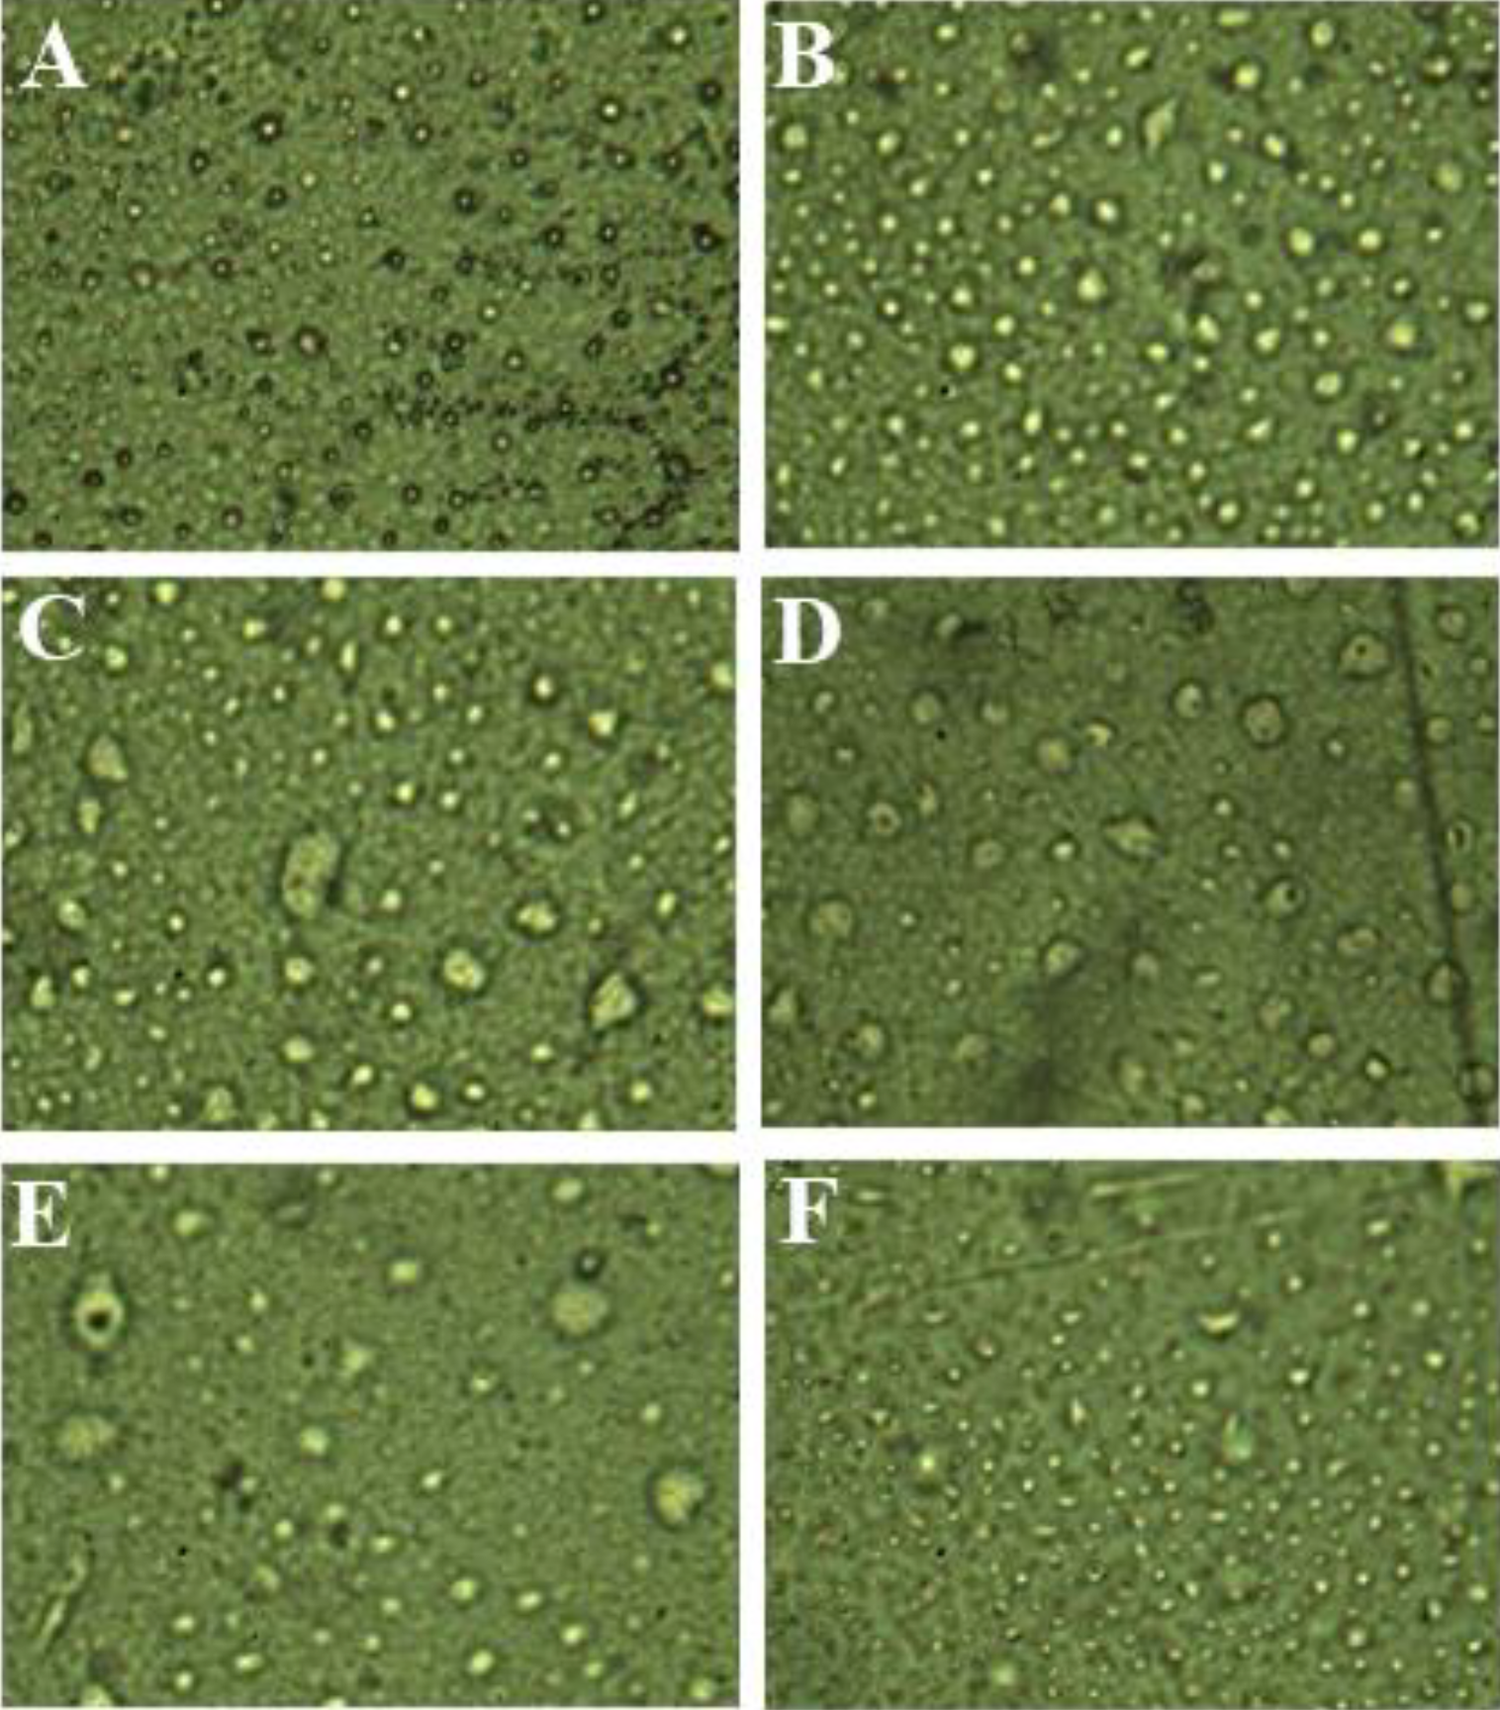
Image of formulations by 40× lens: (A) HL1; (B) HL2; (C) HL5; (D) HE1 (E) HE2; (F) HE6.
Scanning electron microscopy (SEM)
It was performed for formulations HE6 and HL5. SEM analysis of formulations based upon HPMC and L-100 exhibited that drug particles were embedded in the polymeric matrix (Figure 4). The distribution of the particles all over the entire surface was approximately uniform, indicating the potential and suitability of the selected method.
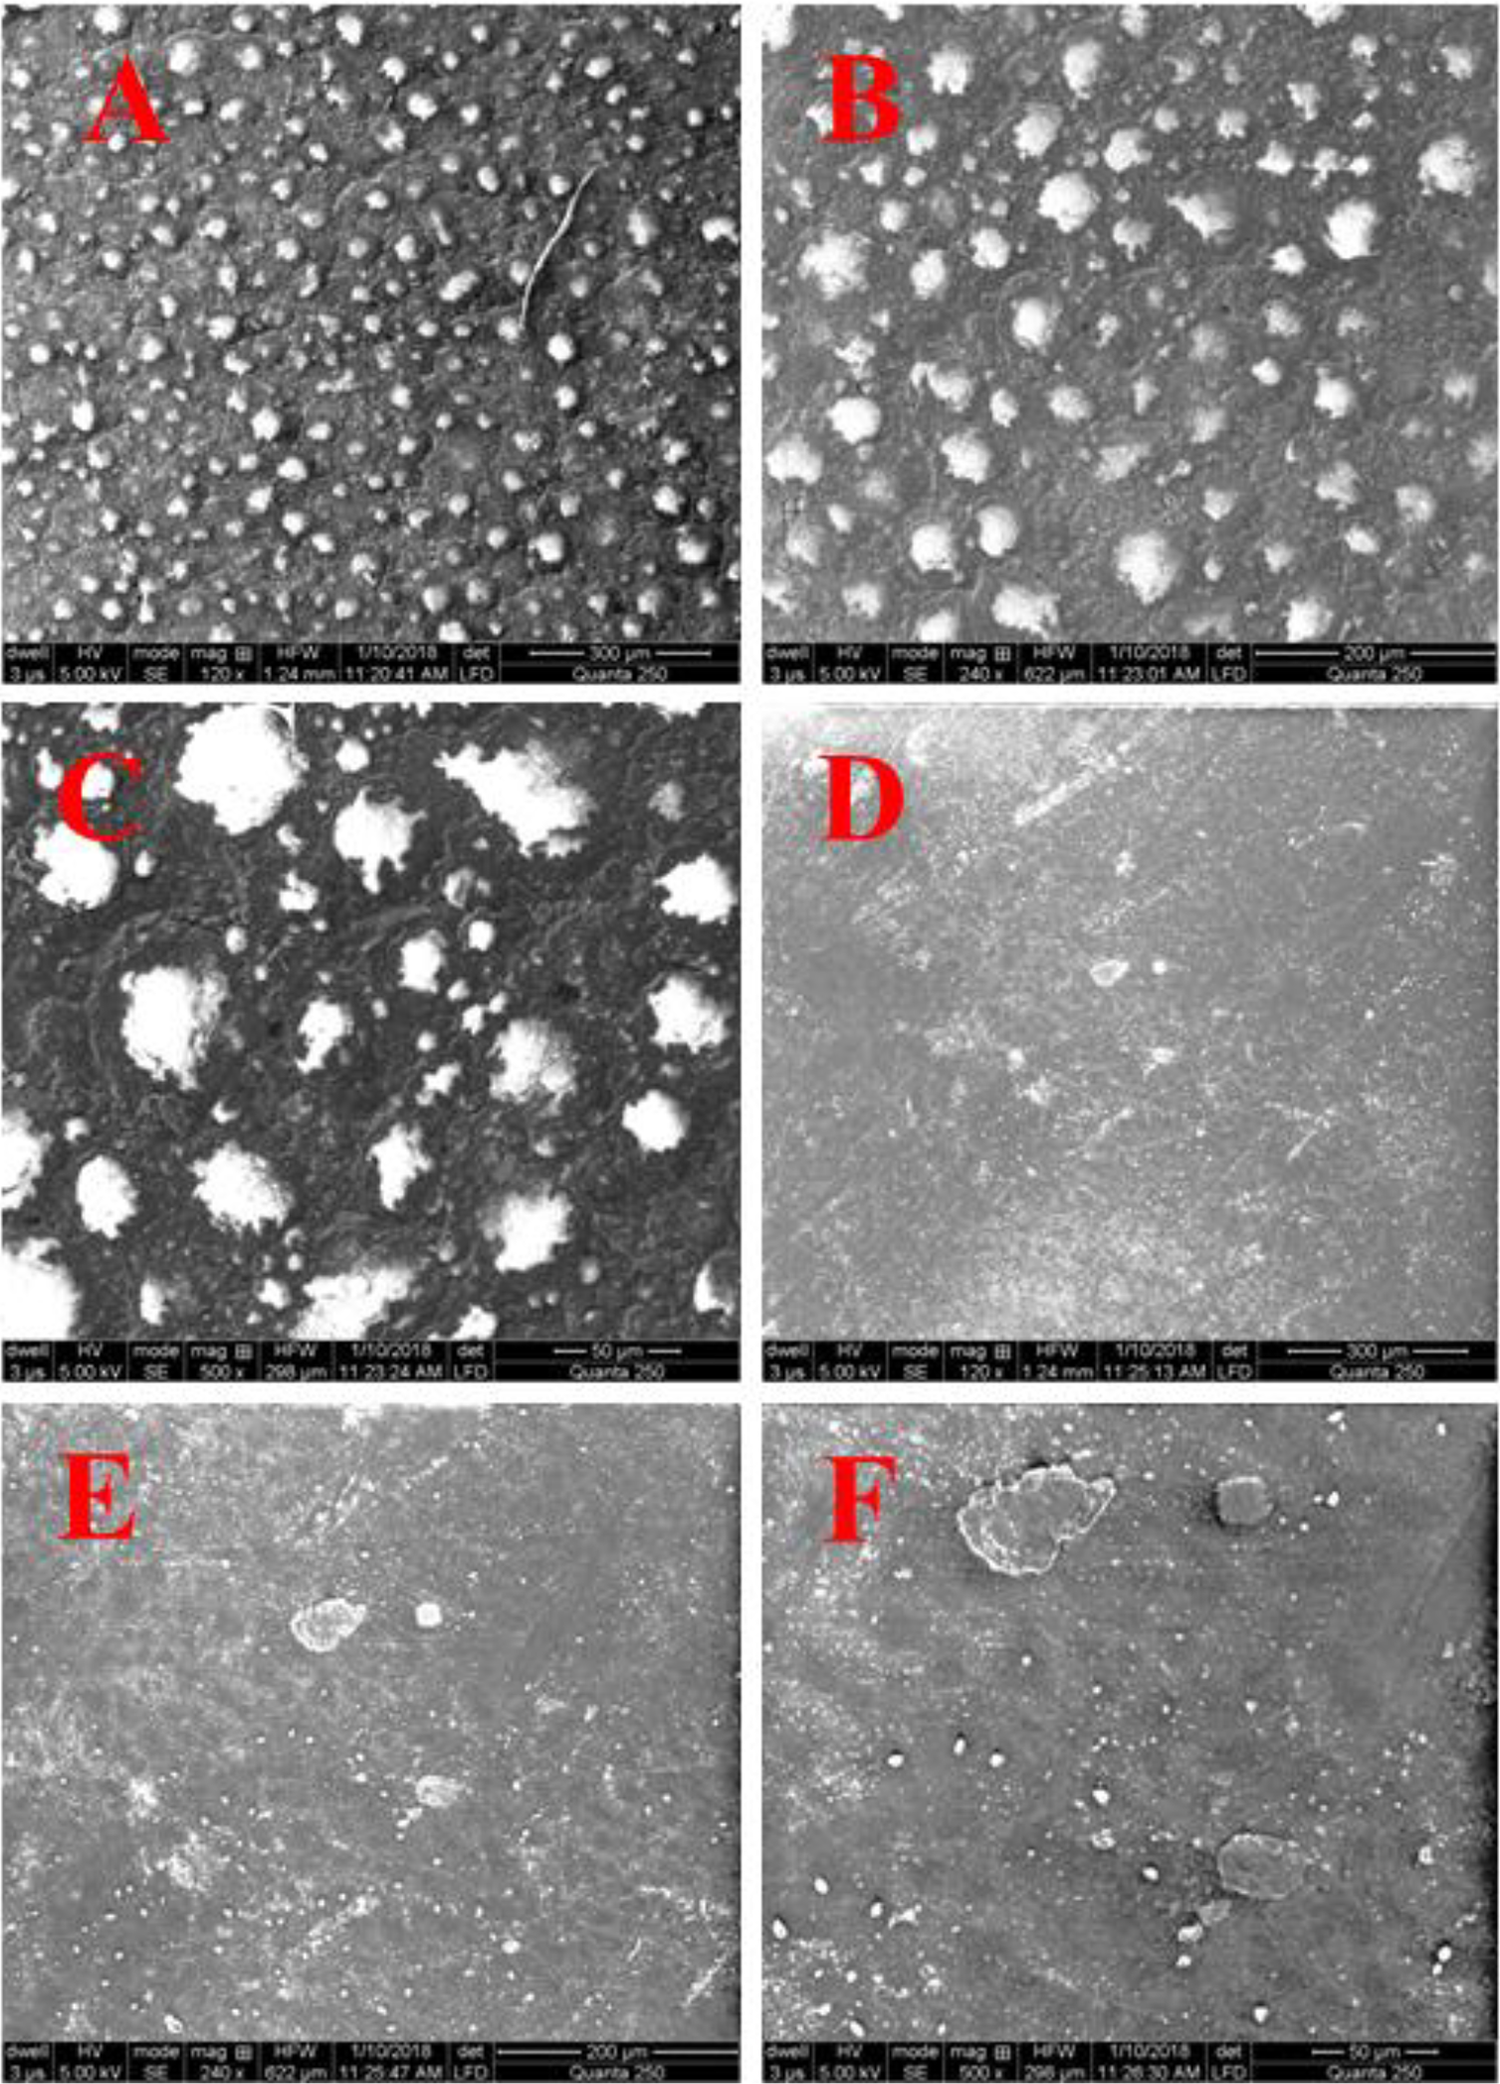
SEM micrographs of: (A) HE6; (B) HE6; (C) HE6; (D) HL5; (E) HL5; (F) HL5.
Physicochemical evaluation
Thickness
Formulations having HPMC and EC showed average thickness from 0.176 ± 0.004 to 0.251 ± 0.014 cm, and formulations with HPMC and Eudragit L100 exhibited thickness from 0.128 ± 0.013 to 0.292 ± 0.012 (Figure 5).

Thickness of HPMC and EL100 formulations.
Folding endurance
Formulation should have suitable mechanical strength, sufficient to withstand the unfavorable conditions during manufacturing, packaging, and transportation. All formulations showed folding endurance of more than 300 (Table 2).
Folding endurance of patches.

Weight variation
Results showed that patches of the same batch have negligible weight differences with minor SD showing the least variability among different batches (67). The average weight of the patches (g) having HPMC and EC ranged from 0.1157 ± 0.0033 to 0.1675 ± 0.0311. However, the average weight of patches containing HPMC and EL-100 was from 0.11675 ± 0.0023 to 0.1335 ± 0.0035 (Figure 6).

Weight variation of HPMC and EC formulations.
Flatness
No constriction was observed in all strips formulated from a combination of HPMC, EC, and also in those having Eudragit L100 along with HPMC. Zero percent constriction showed 100% flatness of the prepared patches. One hundred percent flatness 22 showed good stability of the patches, suitability of selected ingredient to formulate TDDS of both drugs. Hence, the formulation can maintain satisfactory surface smoothness. 25
pH determination
The compatibility of the formulation with the skin pH is necessary because having strong acidic/basic pH can cause irritation/dryness on the skin. The surface pH of all the formulations was near to neutral, ranging from 6.5 to 6.9 (Figure 7). This pH indicates that the patches will not produce skin irritation when applied. 26
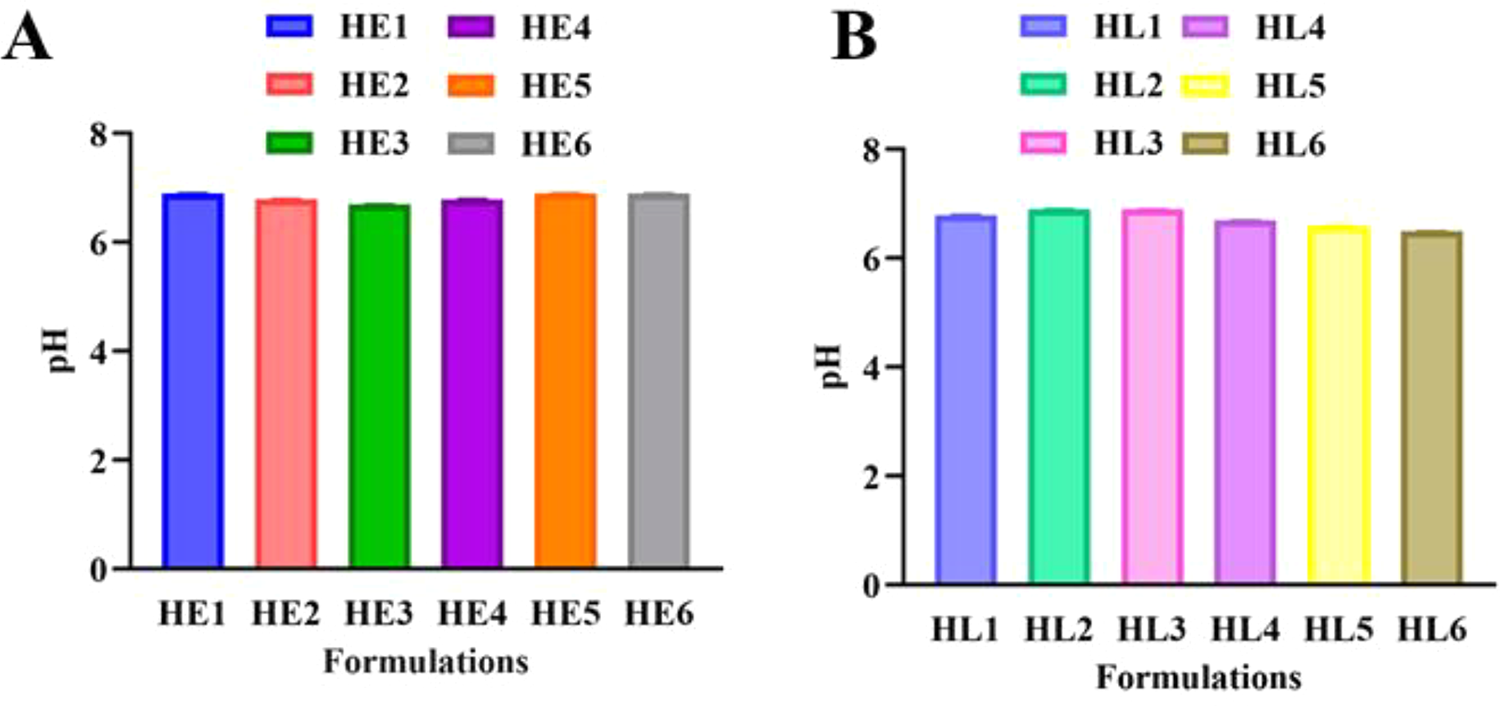
pH of HPMC with EC formulations.
Percentage moisture loss
The weight difference observed for formulation HPMC: EC was between 3.2% and 5.1%, while for formulation HPMC: EL-100 was between 2.0% and 3.8%. So, the formulations consisting of various ratios of HPMC and EC have a comparatively higher percentage of moisture than the formulations composed of HPMC and EL-100 (Figure 8). 27

%moisture loss from HPMC and EC formulations.
Content uniformity
It was performed for all formulations to determine that the given dose of the drug was present in the specified area or not (Figure 9). The acceptable range of drug in the specified area of patch was 85–105%. 28 The contents of both drugs in all formulations were within this range. Formulation made up of HPMC and EC showed the contents of Pregabalin ranging from 95.1% to 99.04% and of Ketoprofen contents ranging from 95.8% to 98.7%. The contents of Pregabalin in the formulation having Eudragit L100 and HPMC were ranging from 95.5% to 101.9%, and for Ketoprofen, the contents were from 95.4% to 98.8%.

% content Pregabalin from HPMC with EC formulations.
Drug permeation studies
In vitro drug permeation
The highest amount (>95%) of the Pregabalin was permeated from HE2, while the formulation HE3 has shown the least drug permeation (83%). From the formulations formed by the mixture of HPMC and Eudragit L-100, the permeation of Pregabalin was highest from HL1 and HL 4, while HL3 and HL6 have shown similar behavior but with greater drug retardation effect. All other formulations have more than 95% of the drug permeation for 8 h.
In vitro permeability of Ketoprofen across the membrane was also measured to ensure the permeation across the skin in vivo. HL3 has shown the highest drug retardation till the 2 h, but the release gradually increased later. Permeation from HL4 to HL6 has indicated that, an increase in EL-100 can increase the sustained effect over the release of the drug and vice versa. HL4 to HL6 has released about 77% of the drug during 8 h of permeation studies. On the other hand, the highest amount of Ketoprofen was released from HE2 and least from HE1. Figure 10 is a clear indication of the sustained effect of both polymers, i.e. HPMC and EC can retard the drug efficiently.

% permeation of Pregabalin obtained from HPMC and EC based patches.
Drug release mechanism
In vitro drug release was followed by the application of kinetic models to evaluate the drug release mechanism. The results showed that drug release is independent of initial concentrations of the drug present in the patches and following the diffusion mechanism (Tables 3 and 4). The independence of drug release from the initial concentration was judged by the values of coefficient of correlation (R2) of zero-order kinetics while the drug release mechanism was arbitrated by the values of R2 of Korsmeyer-Peppas model.29,30 Values were greater than 0.9 in all the cases; however, the value of “n” has suggested that the drug release is following super case II transport (n > 0.89). 31
Kinetic modeling of permeation of Pregabalin through synthetic membrane from HPMCK4 M, ethylcellulose, and HPMCK4 M, Eudragit L100 based formulations.

Kinetic modeling of permeation data of Ketoprofen through synthetic membrane from HPMCK4 M, ethylcellulose, and HPMCK4 M, Eudragit L100 based formulations.

Discussion
Total 12 batches F1to F6 and F7–F12 have been prepared by the combination of HPMC and EC and HPMC and Eudragit L-100 in different ratios. The ratio of hydrophilic and hydrophobic polymer in formulation affects the characteristics of patches. Thus, in the formulation of effective and optimum TDDS, the proportion of hydrophilic and hydrophobic polymer has a vital role.
All patches were estimated for their physical features such as thickness, folding endurance, % drug content, % moisture loss, and permeation study. Compatibility investigations performed by FTIR of both drug moieties and polymers-drugs presented that no interaction exists between drugs-polymers, i.e. all components of the formulation are chemically compatible. Optical microscopy was performed to determine the surface morphology, and the results showed drug-polymer matrix formation and uniform drug distribution throughout the matrix. Surface morphological studies have exhibited the excellent compatibility of the selected ingredients. The morphological investigation of HPMC and Eudragit L-100 based formulations have presented better smoothness of the patch surface than the HPMC and EC based formulations. From the SEM images, we observed that both drugs and polymers existed in the form of a drug-polymer solid solution. The presence of some individual particles has also been observed.
Comparative analysis of the formulations showed that the patches formulated with a combination of HPMC and Eudragit L100 showed higher thickness than the patches developed from the combination of HPMC and EC. Increasing the concentration of EC in patches increased the thickness of patches. On the other hand, formulations with a lower concentration of Eudragit L100 exhibited more thickness than with a high concentration of Eudragit L100. Thickness was the highest at an equal ratio of HPMC and EC, while it was highest at the relatively low concentration of HPMC than Eudragit L100 concentration. All formulation exhibited very less standard deviation in thickness, therefore, presenting uniformity in thickness.
A comparison of folding endurance among formulation formulated from HPMC and EC and HPMC and Eudragit L 100 showed no noticeable difference. The results clearly showed that all patches had a suitable mechanical strength. It also showed that all formulations contained a proper concentration of plasticizer. 32 The results vividly indicated the good uniformity in the weight of prepared patches of all formulation and hence, in the drug content (Table 1). Flatness test results showed that the formulation could maintain suitable surface flatness. The pH of the formulations was ranging from 6.5 to 6.9, i.e. close to neutral. This pH designates that the patches will not cause skin irritation on application. 26
The results of the moisture loss test showed that the % moisture loss from patches formulated with a combination of HPMC and Eudragit L100 was relatively low than the patches prepared by a combination of HPMC and EC. The hydrophilicity order of the polymers was HPMC > ERL > EC. The findings revealed that moisture loss increased with increasing concentration of hydrophilic polymer HPMC in patches formulated with HPMC and EC and HPMC and Eudragit L100. Similar results have also been reported previously. 33 The moisture content in small quantity in the formulations aids them to maintain stability and prevent them from being a brittle and completely dried. Overall, the % moisture loss of the patches was low and therefore decreased the films bulkiness.
The results of the content uniformity test have shown that in all formulations, the contents of both drugs were within an acceptable limit. HPMC and EC and Eudragit L100 and HPMC based formulations displayed no significant difference between the % content and the drugs were fairly distributed in the patches.
In vitro drug permeation studies have vividly indicated the sustained drug release from transdermal patches due to the retardation of the drug release from patches because both HPMC and EC polymers have sustained-release characteristics. The result of the permeation study verified that both drugs were released from the patches and permeated through the skin and, therefore, could probably permeate through human skin in vivo. Permeation of Pregabalin for the patches formulated with a combination of HPMC and EC showed higher permeation when the concentration of HPMC is higher than the EC. Similarly, the patches formulated with a combination of HPMC and Eudragit L100 exhibited higher permeation when the concentration of Eudragit L100 is lower as compared to the HPMC. Permeation of Ketoprofen for the patches formulated with a combination of HPMC and EC was found to be higher when the concentration of HPMC was higher than EC. Similarly, the patches formulated with a combination of HPMC and Eudragit L100 permeation was found highest when the concentration of Eudragit L100 is lowest as compared to the HPMC.
Kinetic models were fitted on results obtained from permeation studies to estimate the drug release mechanism. The conclusions exhibited that drug release is independent of initial concentrations of the drug and following the diffusion drug mechanism. The values of the coefficient of co-relation (R2) of zero-order kinetics indicated the independence of drug release from the initial concentration, whereas the values of R2 of Korsmeyer-Peppas model exhibited the mechanism of drug release. Values were more than 0.9 in all the cases but, the value of “n” has proposed that the drug release is according to super case II transport (n > 0.89).
Conclusion
Previously reported studies have advocated the sustained effect and patch forming abilities of the selected polymeric blends. The current studies have shown similar findings. Although several other model drugs have been incorporated in the transdermal patches formed by using HPMC, EC, and EL-100 but, the drugs chosen for this study were loaded for the first time in a combination to enhance patient compliance. In summary, we prepared and successfully evaluated TDDS loaded with a combination of the selected drugs. The findings and outcomes of the studies were quite satisfactory. These patches can bring multiple advantages in treatment because of a combination of drugs and a sustained drug release profile.
Footnotes
Declaration of conflicting interests
The author(s) declared no potential conflicts of interest with respect to the research, authorship, and/or publication of this article.
Funding
The author(s) received no financial support for the research, authorship, and/or publication of this article.