
Abstract
Delamination is definitely an important topic in the area of composite structures as it progressively worsens the mechanical performance of fiber-reinforced polymer composite structures in its service period. The detection and severity analysis of delaminations in engineering areas like the aviation industry is vital for safety and economic considerations. The existence of delaminations varies the vibration characteristics such as natural frequencies, mode shapes, etc. of composites and hence this indication can be effectively used for locating and quantifying the delaminations. The changes in vibration characteristics are considered as inputs for the inverse problem to determine the location and size of delaminations. In this paper Artificial Neural Network (ANN) is used for delamination evaluationof glass fiber-reinforced composite beams using natural frequency as typical vibration parameter. The Finite Element Analysis is used for generating the required dataset for ANN. The frequency-based delamination prediction technique is validated by finite element models and experimental modal analysis. The results indicate that the ANN-based back propagation algorithm can predict the location and size of delaminations in composites with good accuracy for numerical natural frequency data but the accuracy is comparitivelyless for experimental natural frequency data.
Keywords
Introduction
The usage of fiber-reinforced polymer matrix composites in aerospace, civil and automobile industries is increasing, due to its unique characteristics such as high specific stiffness and specific strength, higher fatigue and wear resistances and higher damage tolerance capability. 1 Due to the complex design features and complicated loading conditions, composites are likely to undergo failures or damages, which are hard to identify, locate and characterize. Also the lack of understanding of the damage mechanism of the composites leads to the uncertainties in the structural integrity and durability. If these damages are neglected or not detected at the early stage, catastrophic failure will occur, which may lead to loss of life and economy. This has necessitated the requirement of detection of location and assessing severity of damage in the composites at an early stage. 2
Delamination or debonding of adjoining plies is one of the most critical failure mechanisms in laminated fiber-reinforced polymer matrix composites, and is also one of the key factors which differentiate composites behavior from metallic structures. 3 Delamination always proceeds in a subtle way with harmful effects as it can easily escape from detection since they are frequently embedded within the composite structures. Delaminations can happen by any of the conditions such as low-velocity impact, lightning, manufacturing defects, etc. Their effect on the structure may cause a dramatic loss of residual strength by up to 60%. 4
Nondestructive Testing techniques such as visual inspection, ultrasonic testing, radiography, thermography, etc and Structural Health Monitoring techniques such as fiber Bragg grating, acoustic emission, vibration-based methods, etc are the currently used methods for delaminations detection. 5 Analyzing these existing composite delamination detection methods, it can be clearly seen that in most of the methods either the composite structure have to be taken to a test house or complex and large equipment have to be taken to the structure site to carry out the test. 6 While traditional nondestructive inspection (NDI) methods are applied to detect internal damage offline, recently considerable research effort has been put into developing Structural Health Monitoring (SHM) techniques which can detect delaminations in situ and in real time. 7
The presence of delaminations in the composite structures introduces a local flexibility in the damage location, which changes the dynamic behavior of the composite, because of reduction in the stiffness. Thus Vibration analysis can be the best tool for delaminations assessment, as the reduction in stiffness results in changes in the natural frequencies and modifications of the mode shapes, impulsive response, frequency response functions, etc. of the component.8,9 While the existence of damage can be easily identified by monitoring frequency shifts, identifying the location and severity of this damage is not possible directly. It can be done by solving the inverse problem, which requires the use of artificial intelligence.10,11
Vibration-based composite health monitoring through monitoring dynamic response of composite structures is the research work carried out and reported here. Glass fiber-reinforced polymer (GFRP) is the composite type chosen for this study. Composite structures in its lifetime can suffer from a number of failure mechanisms like delaminations, fibre breakage, matrix cracking, etc, due to impacts of foreign objects, fatigue loads, environmental conditions, etc. Delamination in composite structures may easily spread throughout the composite laminate upon repeated loading causing disastrousand costly failures. For better estimation of severity/size and location of the delamination, the problem is basically divided into two phases. The first phase is training the neural networks, for which a dataset of first five natural frequencies for different delamination scenarios is generated using finite element modeling technique after validating with the experimental results. During the second phase, the inverse problem is solved using artificial neural networks. The accuracy in predicting location and severity of delamination using ANN was evaluated by both numerically simulated frequency data and experimentally measured frequency data.
Database generation
For training the inverse algorithm, a database consisting of shifts in natural frequencies because of known delaminations are required. As analytical expression for vibration of the delaminated composite plate is not yet well defined and conducting experiments is costlier, the required database is generated with the help of finite element tool after validating with experimental results. FE simulation was conducted on a large number of composite beam models with different sizes and locations of delaminations. The database size used for training ANN plays a crucial role in determining the delaminations (location and severity) accurately and also influences the time spent by algorithms to determine the same. For this work 150 different delamination scenarios were generated numerically by making combinations of delaminations at six different locations (linearly), five different layer interfaces and five different areas. First five natural frequencies were obtained for all the delamination scenarios and they are used as input to ANN while delamination location and size are used as output to ANN. One hundred and forty input–output datasets were given to the ANN for training purposes and the rest were used for the validation process.
Fabrication of GFRP beams with and without delaminations
Glass fiber-reinforced epoxy beams with and without delaminations were manufactured for verifying the finite element model results and also for validating the developed algorithms for predicting location and severity of delaminations. The number of applications it is being used currently and its tremendous future scope are the main reasons for choosing E-glass fiber in this study. Epoxy resin (LY556) was selected as resin here as it is having high mechanical strength, good ability to bond with most materials, and also it is one of the most important resins used in a number of applications. Epoxy hardener was also added with the epoxy resin in 1:10 ratio for curing purposes.
The fabrication of FRPs generally involves the process of stacking required plies together using various techniques like hand layup, resin infusion, compression moulding, injection moulding, etc. Conventionally, FRPs are fabricated mostly by hand layup method, which requires skilled technicians. But here GFRP beams (glass fiber lamina with epoxy resin) are made through the vacuum bagging technique as it yields better strength rating because of higher reinforcement concentrations, less porosity and better adhesion between layers. Initially composite plates with adequate dimension were made and it was cut into required dimensions using water jet machining as shown in Figure 1.

Water jet machining.
ASTM D3039 standard is used for the dimension of beam used in tensile testing to get the properties of composite prepared. The final dimension of the composite beam used in experimental vibration analysis was 300 × 25 × 4 mm with 16-layer [0/45/90/-45]2 S laminate. The effective working length is 250 mm as 50 mm is used for clamping at the support.
GFRP beams with delamination are manufactured in two steps. Initially a single layer of parchment paper is kept at the predefined location of different layers during the layup process. This is done to form a weak bond at the areas where delaminations have to be formed after curing. Then plates were cut into the required dimension of beam and a thin metal shim with 0.1 mm thickness is used to separate the layers where delaminations were desired to happen. For experimental validation of numerical results, delaminations were made on beams at four random axial locations and layers with different areas in each location as shown in Table 1. Delamination of specimen 1 alone is shown in Figure 2 for better understanding.
Delamination size and location.


Specimen 1 with delamination 10 mm at layup 1 located 50 mm away from free end.
Vibration testing of composite beam specimens
Experimental modal analysis of clamped-free 16-layer [0/45/90/-45]2 S glass/epoxy beams with various delamination locations and sizes is carried out. Figure 3 shows the experimental setup used in vibration analysis of composite cantilever beams with and without delaminations. The effective length, width and thickness of the beam samples are 250 mm, 25 mm and 4 mm. The beam specimen was clamped as a cantilever beam and excited by using an impact hammer (PCB piezotronics 086C03; 0–500 lbf, 10 mV/lbf) which excites the beam specimen with an impulse force. The vibration response was captured by a Triaxial Accelerometer (5 mvolts/g), where mounting of the accelerometer was achieved using adhesive petro wax. NI USB-6009 (14-Bit, 48 kS/s) was used as a multichannel dynamic data acquisition system (DAQ), where accelerometer generated analog signals are amplified and converted to digital signals. DAQ was connected to the PC and interfaced with LabVIEW software of National Instruments.

Experimental setup.
Finite element analysis
ANSYS 15 commercial software was the FE tool used to create a finite element model of the undamaged and delaminated three-dimensional cantilever composite beams. The beam model used here is made up of 16-layer [0/45/90/-45]2 S laminate. The material property of the composite beam (for giving input in FEA) is obtained through experimentation. The values of Young’s modulus, Poisson’s ratio, Shear modulus and density were 19 GPa, 0.26, 2.8 GPa and 1764 kg/m3 respectively. As modeling composite beams comes under three-dimensional modeling of solid structures, layered Solid 185 was the element type used for modeling the beams. Information regarding each layer is defined by shell element and the number of elements considered for each layer along the thickness was one. For achieving a balance between computational time and model parameter accuracy, a mesh sensitivity analysis was performed and optimum number of elements is determined. To prevent interpenetration between the delaminated layers, contact elements (CONTAC173) were introduced between the delaminated surfaces. The first five natural frequencies of the delaminated beams are obtained using the modal analysis option in ANSYS 15.
Comparison of finite element and experimental modal analysis results
The validation of the Finite Element Analysis results were done by comparing the first four natural frequencies with the experiment results for undamaged and delaminated composite beams. When percentage error for each case is calculated, it is observed that finite element analysis gives higher natural frequencies for each mode than the corresponding experimental results in most of the cases. From the comparison, an error of maximum 4.5% is obtained for beam without delamination and an error of maximum 8% is obtained for beam with delamination as shown in Table 2. The comparison is not limited to data shown in the table and it was done for four beams with different delamination scenarios (out of one is shown in table) and one beam without delamination (shown in table).
Comparison of experimental and numerical results.

The discrepancies observed between Finite Element and experimental results may be attributed to: (i) Inability to manufacture the geometrical features accurately as assumed in the FE simulations, (ii) Inability to obtain exact material property values (from testing) of the beam specimens, which is further used as input to FE model, (iii) errors or inconsistency in measuring frequency experimentally, (iv) Difficulty in reproducing the ideal boundary conditions used in the numerical simulation for the experiments.
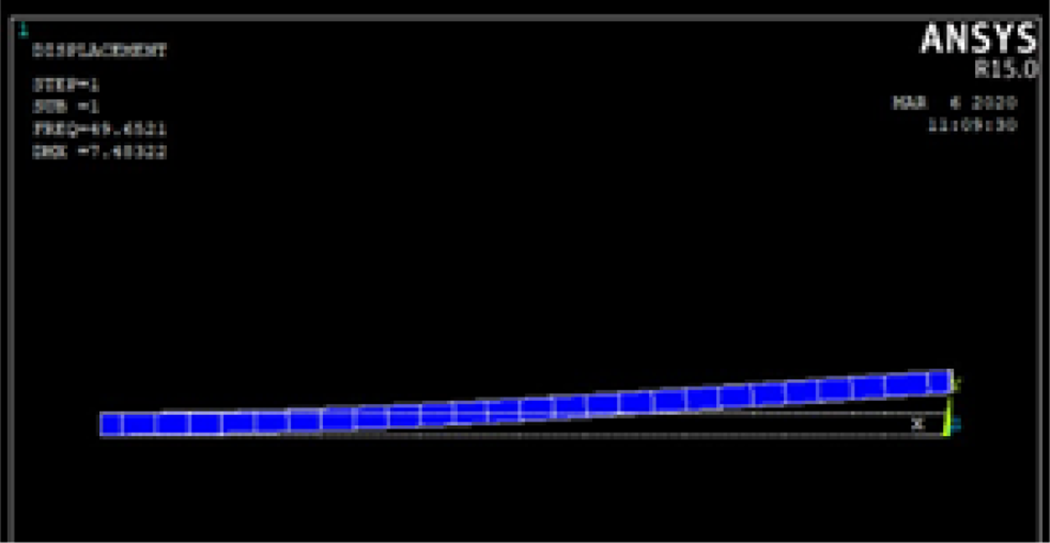
The first two bending mode shapes and frequencies of the beam samples (with and without delaminations) shown in Table 2 are shown in Figures 4 to 7. However, the FE model was able to estimate the first four natural frequencies with error less than 8%, suggesting that FE modeling is sufficient for generating the dataset, rather than labor intensive, time and cost consuming experimental approach.
Bending mode 1—Without delamination.

Bending mode 2—Without delamination.

Bending mode 1—With delamination.

Bending mode 2—With delamination.
Artificial neural network for delamination detection
It can be observed that nowadays there has been an increasing interest among researchers for using Artificial Intelligence techniques to find the location and severity of damages in complex structures.12,13 ANN is an information processing model that is inspired from the human brain. Similar to the human brain, an ANN can be configured or trained by a learning process depicting relation between different inputs and outputs. As Neural networks are now used as universal function approximators for complex problems, ANN is used here for predicting the damage characteristics.14,15
Inverse methods generally use both the initial model of the structure (delaminated beam here) and measured data (natural frequencies) to improve the model and also for testing the hypothesis. The technique followed here aims to test the efficiency of global vibration parameters (natural frequencies) as input to an ANN backpropagation algorithm on locating and predicting severity/size of the damage. Supervised feedforward multilayer backpropagation Artificial Neural Network in MATLAB Neural Network Toolbox is used here to determine the location and severity of the delamination in composite beams. The ANN size is very crucial as smaller networks cannot represent the system accurately while larger ones make it overtrained. Hence optimization in the size was done by trial and error method. A database of the first five natural frequency changes obtained from the Finite Element model of delaminated beams is used to train the ANN. For this study, ANN consists of five inputs (frequencies) and three outputs (location, layer and size of delamination) and one hidden layer as shown in Figure 8. Mean square error (MSE) is used as ANN’s performance indicator and training is done by Gradient descent with momentum and adaptive LR.

Neural network used for delamination prediction.
Database consists of 150 sets, where delamination is located on six different locations (50 mm, 80 mm, 110 mm, 130 mm, 170 mm and 200 mm from free end). These different delaminations where again distributed in different layers (0.25 mm, 0.75 mm, 2 mm, 2.5 mm and 3 mm from beam base, where each layer have 0.25 mm thickness) and were having different sizes (10 mm2, 20 mm2, 30 mm2, 40 mm2 and 50 mm2). A sample dataset for location 130 mm from free end with different delamination layers and sizes is shown in Table 3 and similarly data is generated for the other five locations also.
Dataset X = 130 mm from free end.

Prediction of location and severity of delaminations
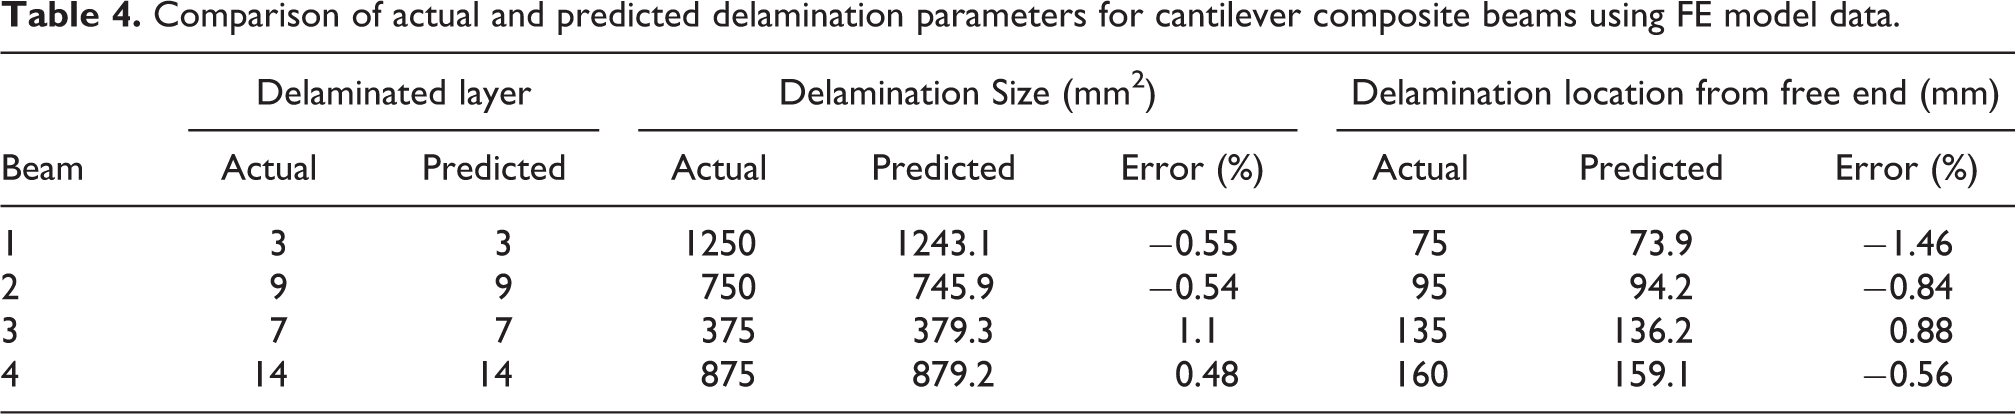
To validate the ANN technique in estimating delamination parameters (location and severity), four FE models were generated. The actual and predicted values of layer, location from free end and severity/size of delamination are shown in Table 4. The percentage errors between actual and predicted values for location and size also provided in the same table. The layer prediction was correct for all of the 4 beam samples. The differences between the predicted and actual locations measured from free end are within 0.90% except for beam 1. The error in determining delamination size/severity is within 0.56% for beam 1, 2 and 4, while for beam 3 alone the error is 1.1%.
Comparison of actual and predicted delamination parameters for cantilever composite beams using FE model data.
The delamination parameters (location and severity) predicted using the ANN technique from natural frequency shifts for the composite cantilever beams tested experimentally and actual values are shown in Table 5. The percentage errors between actual and predicted values for location and size also provided in the same table. The layer prediction was correct only for beam 2 but was somewhat acceptable for beam 1 and 4. From the table it is clear that the differences between the predicted and actual locations measured from free end are within 8.5%. The error in determining delamination size/severity is within 10% for beam 1, 3 and 4, while for beam 2 alone the error is 20% a pretty large value. When the delaminations area is small, the prediction accuracy is found to be less. The same observation was made when comparing actual and predicted delamination size using FE model data. Including more training datasets consisting of small delamination areas will improve the prediction accuracy for cases like this.
Comparison of actual and predicted delamination parameters for cantilever composite beams using experimental validation data.

While comparing actual and predicted delaminations, it is clear that prediction accuracy is lower for experimentally measured natural frequencies than the numerical frequency data. This may be because of difficulty in manufacturing geometrical features of beams accurately or errors in measuring natural frequencies experimentally.
Conclusions
In this study, vibration-based analysis is used on composite beams in order to predict the severity/size and location (from free end and layer) of the delamination. It was observed that delaminations in composite beams significantly degrades natural frequencies. The third, fourth and fifth natural frequencies degrade significantly with increasing delamination size compared to the first two natural frequencies. First five natural frequencies are taken as input to ANN and delamination scenarios (locations and sizes) are taken as output. Dataset consisting of 150 input-output pairs have been generated from different delamination scenarios and used for the training and validation of feedforward multilayer backpropagation Artificial Neural Network. The location and severity prediction accuracy of the ANN was evaluated by numerically simulated frequency data as well as experimentally measured frequency data. The experimental validation data implies that the accuracy is not good as numerical validation, which may be because of numerical dataset generation. The present work can be extended in future by improving the performance of the ANN for delamination detection and also comparing ANN with other algorithms.
Footnotes
Declaration of conflicting interests
The author(s) declared no potential conflicts of interest with respect to the research, authorship, and/or publication of this article.
Funding
The author(s) received no financial support for the research, authorship, and/or publication of this article.