
Abstract
In this study, polythiophene (PTh) and a series of polythiophene/molybdenum disulphide (PTh/MoS2) composites were prepared by in-situ chemical oxidative polymerization method using anhydrous ferric chloride (FeCl3) as an oxidant and chloroform (CHCl3) as a solvent. The successful formation of PTh and PTh/MoS2 composites were confirmed by various techniques such as Fourier transform infrared spectroscopy (FTIR), X-ray diffraction (XRD), scanning electron microscopy (SEM) and transmittance electron microscopy (TEM). DC electrical conductivity and acetone/acetaldehyde sensing studies were carried out by a four-in-line probe device. PTh/MoS2 composites exhibited significantly improved DC electrical conductivity and acetone/acetaldehyde sensing properties as compared to PTh. The electrical properties were investigated in terms of initial conductivity (i.e. conductivity at room temperature) as well as retention of conductivity, i.e. stability under isothermal and cyclic ageing conditions. The maximum initial conductivity, along with the highest conductivity retention, was observed for PTh/MoS2-2 (PTh/MoS2 composite comprising 10% MoS2 with respect to the weight of thiophene monomer). The initial DC electrical conductivity of PTh, PTh/MoS2-1, PTh/MoS2-2 and PTh/MoS2-3 was found to be 5.72 × 10⁻⁵ Scm−1, 4.03 × 10⁻⁴ Scm−1, 1.09 × 10⁻³ Scm−1 and 8.96 × 10⁻⁴ Scm−1, respectively. The sensing performance at room temperature has been studied in terms of % sensing response, response/recovery time. All the PTh/MoS2 composites based sensors performed much better than PTh. The % sensing response of PTh, PTh/MoS2-1, PTh/MoS2-2 and PTh/MoS2-3 based pellet-shaped sensors towards acetone/acetaldehyde were affirmed as 30.6/22.9, 69.9/47.3, 93.7/70.3, 78.1/65.1, respectively. The purposed sensing mechanism involved the adsorption of acetone/acetaldehyde vapours on the surface of the sensors where electronic interaction between lone pair of electrons on oxygen atoms of the carbonyl group and charge carriers of PTh was responsible for the change in conductivity.
Keywords
Introduction
Since their discovery in 1977, conducting polymers (CPs) have been studied to a great extent. The noble prize for chemistry in 2000 was jointly awarded to Heeger, MacDiarmid and Shirakawa for their pioneering work on CPs which ignited significant interest in research in this field. 1 CPs offer several advantages such as they can be easily synthesized, possess diverse structure, are flexible as well as are stable to the environment.2–4 Their electrical/electronic properties can also be easily tuned. This allows CPs to be employed as alternatives to inorganic materials that are widely used in various application fields.3–7 But the major concern is their unstable conductivity at a higher temperature because they easily degrade at elevated temperatures.8,9 However, this problem can be solved by the formation of their composites with inorganic fillers which exhibit stable conductivity at room temperature as well as at elevated temperatures.10–12 CPs such as polypyrrole, polyaniline, polythiophene (PTh) as well as their composites have been used for the sensing of several gases/vapours.2,4,9–12
Among the available composites of CPs, least studies have been carried out on composites of PTh. It has found use in various applications in several fields such as chemical sensing,13–15 dye degradation, 16 solar cells 17 and supercapacitors 18 etc. PTh possesses unique properties, for example, it can be easily polymerized, cheaply synthesized, has a highly porous π-conjugated structure, is flexible as well as has high conductivity, can be doped easily and is environmentally as well thermally stable in both the doped as well as undoped states.13–15 Conversely, pure PTh has a rather low conductivity (<10−5 Scm−1) and hence doping it is necessary to enhance its conductivity. At higher temperature, its conductivity becomes unstable and sometimes reduced significantly.19–21 PTh shows sensing response to toxic gases even at low temperatures and shows potential for enhancing the performance of the sensors. But its electrical and sensing performance can be increased many folds by the formulation of its composites with inorganic fillers such as SnO2, 15 ZrO2, 13 graphene, 11 carbon nanotubes,19,20 ZnO, 14 ZnWO4 21 etc.
The discovery of sphere-shaped nanoparticle MoS2 resembling fullerene was made by Tenne et al. in 1992. 22 Its structure consisting of S–Mo–S sandwich layers can be modulated. Its layered hexagonal crystal structure is vital for displaying lubricating properties when employed as an additive in lubricating oils. 23 MoS2, a two-dimensional (2D) layered nano-material has drawn considerable attention in recent times regarding its possible use in the field of biosensing as it possesses a quantum size ultra-thin structure and exclusive physicochemical properties. 24 It is more sensitive as well as cheap when compared to existing sensing elements. 24 It can be prepared hydrothermally and by solvent-thermal synthesis techniques which are considerably cheap as compared to other methods. 25 It is an extremely stable analogue of inorganic graphene possessing an inherent predetermined bandgap which makes it an ideal candidate for use in various fields that such as electronics, optoelectronics as well as a different range of sensor applications.24,26–28 It possesses a bandgap of 1.8 eV, and conduction through it can efficiently be switched between on and off states. 29 Conjugated polymers such as polypyrrole, polyaniline, and polythiophene displaying anisotropic optical, electrochemical and electrical properties, have been employed to form composites with MoS2.5,30–32
In this work, PTh and three PTh/MoS2 composites containing 5%, 10% and 15% of MoS2 are synthesized and characterized. The DC electrical conductivity and acetone/acetaldehyde sensing properties of all the materials have been studied and compared. The results showed that electrical conductivity and sensing properties of PTh could significantly be modified in the presence of a different amount of MoS2.
In our best knowledge, this is the first report on acetone/acetaldehyde sensing properties of PTh/MoS2 composites.
Experimental
Materials
Thiophene (E. Merck, India), molybdenum disulphide (MoS2) (CDH, India), acetone (Fisher Scientific, India), acetaldehyde (Fisher Scientific, India), chloroform (Fisher Scientific, India), anhydrous ferric chloride (Fisher Scientific, India) and methanol (Fisher Scientific, India) were used as received.
Synthesis of polythiophene (PTh) and polythiophene/MoS2 composites
PTh and PTh/MoS2 composites were synthesized by in-situ chemical oxidation method using chloroform (CHCl3) and anhydrous ferric chloride (FeCl3) as solvent and oxidant, respectively. 11 First of all, a fixed amount of MoS2 powder was taken into 500 mL beaker containing 200 mL of CHCl3 and ultra-sonicated for 3 h for exfoliation of MoS2 sheets. Then, 2 mL (25 mmol) of thiophene monomers were added in the beaker and again ultra-sonicated for 1 h for the adsorption of monomers on MoS2 sheets. After that 8.12 g (50.04 mmol) of FeCl3 was transferred into 250 mL beaker containing 50 mL of CHCl3 and stirred until a homogeneous suspension was formed. Then, FeCl3 suspension was added to the beaker containing monomer and MoS2 dropwise with continuous stirring. The reaction mixture was stirred for 24 h continuously. After completion of the reaction, a black coloured product was obtained which was filtered and washed three times with methanol, double distilled water and acetone. The resultant brown coloured product was dried in a vacuum oven at 70°C for 24 h. Then, the dried product was converted into very fine powder for the preparation of pellets for conductivity and sensing studies. Thus, all the PTh/MoS2 composites were synthesized containing 5%, 10% and 15% of MoS2 to the amount of thiophene and labelled as PTh/MoS2-1, PTh/MoS2-2 and PTh/MoS2-3, respectively. The bare PTh was also synthesized without using MoS2 by an identical process.
Characterization
The structure and morphology of PTh, MoS2 and PTh/MoS2-2 were determined by FTIR, XRD, SEM and TEM techniques. FTIR spectra were recorded by a Perkin-Elmer 1725 instrument on KBr pellets in the range of 400–4000 cm−1. XRD analysis was done by Bruker D8 diffractometer with Cu Kα radiation at 1.5418 Å. SEM micrographs were obtained by JEOL, JSM 6510-LV (Japan) after coating of samples with gold. TEM micrographs were obtained by JEM 2100 JEOL (Japan).
DC electrical conductivity and acetone/acetaldehyde sensing experiments were done by four-in-line probe instrument attached with a PID controlled oven manufactured by Scientific Equipment, Roorkee, India. The equation used for the calculation of electrical conductivity is given below:

where: I, V, W, S and σ represent the current (A), voltage (V), the thickness of the pellet (cm) probe spacing (cm) and conductivity (Scm−1), respectively.11–13
The sensor pellets were made by a hydraulic pressure machine at 70 kN pressure applied for 60 s. 200 mg of each sample was used for the preparation of Pellets. Different pellets were used in conductivity and sensing experiments.
In isothermal ageing experiments, the pellet of each sample was heated at 50°C, 70°C, 90°C, 110°C and 130°C in the air oven. The electrical conductivity was calculated at a particular temperature at an interval of 5 min. In cyclic ageing experiments, the conductivity was determined for four successive cycles starting from 50°C to 130°C.11,13
Results and discussion
Fourier transform infrared spectroscopic (FTIR) studies
FTIR spectra of PTh, MoS2 and PTh/MoS2-2 are shown in Figure 1. The characteristic peaks of PTh observed at about 467 cm−1, 698 cm−1 and 791 cm−1 were due to ring deformation mode of C-S-C bonds, bending mode of the C-S bonds and out of plane deformation mode of C–H bonds in 2,5-substituted thiophene ring, respectively.11,13 The broad peak at 3419 cm−1 was due to–OH group of moisture contents. 11 Two peaks at 2930 cm−1 and 2851 cm−1 may correspond to stretching vibrations of C-H bond.11,13–15 The peaks at 1625 cm−1 and 1438 cm−1 were related to the asymmetric and symmetric stretching vibration of C=C bonds, respectively.19–21 Whereas the peaks at 1378 cm−1 and 1321 cm−1 may be due to stretching vibration of C-C of thiophene ring.11,13 The four peaks at 1206 cm−1, 1166 cm−1, 1109 cm−1, 1016 cm−1 may be allocated to out of plane bending vibrations of C–H bonds.13–15 In the case of MoS2, the characteristic peaks observed at 994 cm−1, 836 cm−1 and 562 cm−1 were in good agreement with available literature.5,25,26 The peaks at 994 cm−1and 562 cm−1 may be allotted to the S–S and Mo–S bonds of MoS2, respectively.5,25,26
In the spectra of PTh/MoS2-2, all the corresponding peaks of PTh were seen at slightly shifted wavenumber indicating a significant interaction between PTh chains and MoS2. For PTh/MoS2-2, the peaks detected at 3419 cm−1, 2930 cm−1, 2851 cm−1, 1625 cm−1, 1438 cm−1, 1378 cm−1, 1321 cm−1, 1206 cm−1, 1166 cm−1, 1109 cm−1, 1016 cm−1, 791 cm−1, 698 cm−1 and 467 cm−1 of pristine PTh moved to 3427 cm−1, 2923 cm−1, 2855 cm−1, 1631 cm−1, 1448 cm−1, 1384 cm−1, 1319 cm−1, 1211 cm−1, 1160 cm−1, 1113 cm−1, 1021 cm−1, 784 cm−1, 692 cm−1 and 455 cm−1, respectively. Also, there were no characteristic peaks related to MoS2, which may be due to thorough coverage of the surface of MoS2 by PTh matrix.

The FTIR spectra of PTh, MoS2 and PTh/MoS2-2.
X-ray diffraction (XRD) studies
XRD spectra of PTh, MoS2 and PTh/MoS2-2 are shown in Figure 2. The amorphous nature of PTh can be confirmed by the broad diffraction peak observed at 2θ = 19–29°.11,21 In the case of MoS2, the peaks at 2θ = 14.40°, 28.85°, 32.70°, 33.55°, 35.80°, 39.60°, 44.10°, 49.85°, 56.10°, 58.30°, 60.45°, 70.28°, 72.84° and 76.13° revealed (002), (004), (100), (101), (102), (103), (006), (105), (106), (110), (008), (108), (203) and (116) diffraction planes, respectively.23,27 While in case of the PTh/MoS2-2, the characteristic peaks of MoS2 were observed at slightly higher angles, i.e. 2θ = 14.50°, 29.10°, 32.75°, 33.70°, 35.95°, 39.71°, 44.18°, 49.95°, 56.20°, 58.45°, 60.60°, 70.45°, 72.95° and 76.22°, respectively showing electronic interaction between PTh chains and MoS2. The intensity of all the peaks of MoS2 was reduced significantly in PTh/MoS2-2, revealing the successful and thorough coverage of MoS2 sheets by PTh matrix (which can be seen in SEM and TEM images).

The XRD spectra of PTh, MoS2 and PTh/MoS2-2.
Morphological studies
The SEM images of PTh, MoS2 and PTh/MoS2-2 along with TEM images of PTh and PTh/MoS2-2 are shown in Figure 3. The SEM image of PTh revealed its sheet-like structure. In SEM image of MoS2, the sheets of several nanometre thicknesses can be observed. Whereas the SEM image of PTh/MoS2-2 revealed successful polymerization of thiophene on MoS2 sheets. However, the sheets of PTh/MoS2-2 seemed thinner than PTh and MoS2 which may be due to exfoliation of MoS2 sheets then polymerization of thiophene on it. The TEM image of PTh also confirmed the sheet-like structure. The TEM images of PTh/MoS2-2 showed that PTh was uniformly laminated on the surface of MoS2.

SEM and TEM images of PTh, MoS2 and PTh/MoS2-2.
DC electrical conductivity studies
The initial electrical conductivity (at 32°C and 47% humidity) of PTh, PTh/MoS2-1, PTh/MoS2-2 and PTh/MoS2-3 was found to be 5.72 × 10⁻⁵ Scm−1, 4.03 × 10⁻⁴ Scm−1, 1.09 × 10⁻³ Scm−1 and 8.96 × 10⁻⁴ Scm−1, respectively (Figure 4(a)). PTh/MoS2-2 exhibited the highest conductivity, which revealed that the percolation threshold of PTh/MoS2 composite is near about 10% of MoS2 loading. In the case of conducting polymers, the charge carriers are polarons and bipolarons (similar to holes in semiconducting materials). The electrical conductivity could be explained by the quantity and mobility of these charge carriers. Thus, any interaction which governs the quantity and mobility of charge carriers could easily control the conductivity. Therefore, the conductivity can be tuned by changing type and level of oxidation process as well as the types of filler components.11–15 In the case of the composite, the mechanism of conductivity is explained by the movement of charge carriers along with the extended π-conjugated system of conducting polymers or the hopping/tunnelling between fillers and polymer chains.10–15,19–21,33 Moreover, these composites behave like good semiconductor at elevated temperature also due to better polymer chain alignment, improved thermal stability and enhancement in the π-conjugated system provided by synergistic/electronic interaction between polymer chains and filler inorganic nanoparticles at molecular levels.10–15,19–21,33
Herein, the significantly improved conductivity of PTh/MoS2 composite as compared to PTh may be due to following reasons: (1) The sheets of MoS2 provide a large surface area for the polymerization of thiophene, thus generating more efficient and extended π-conjugated system for charge carries transportation as compared to PTh. (2) The electronic interaction of lone pairs of sulphur of PTh with Mo ions as well as vacant d-orbitals of sulphur atoms of MoS2 could increase the number of charge carriers. (3) Reduction in hopping/tunnelling distance between metallic regions and improved density of charge carriers.
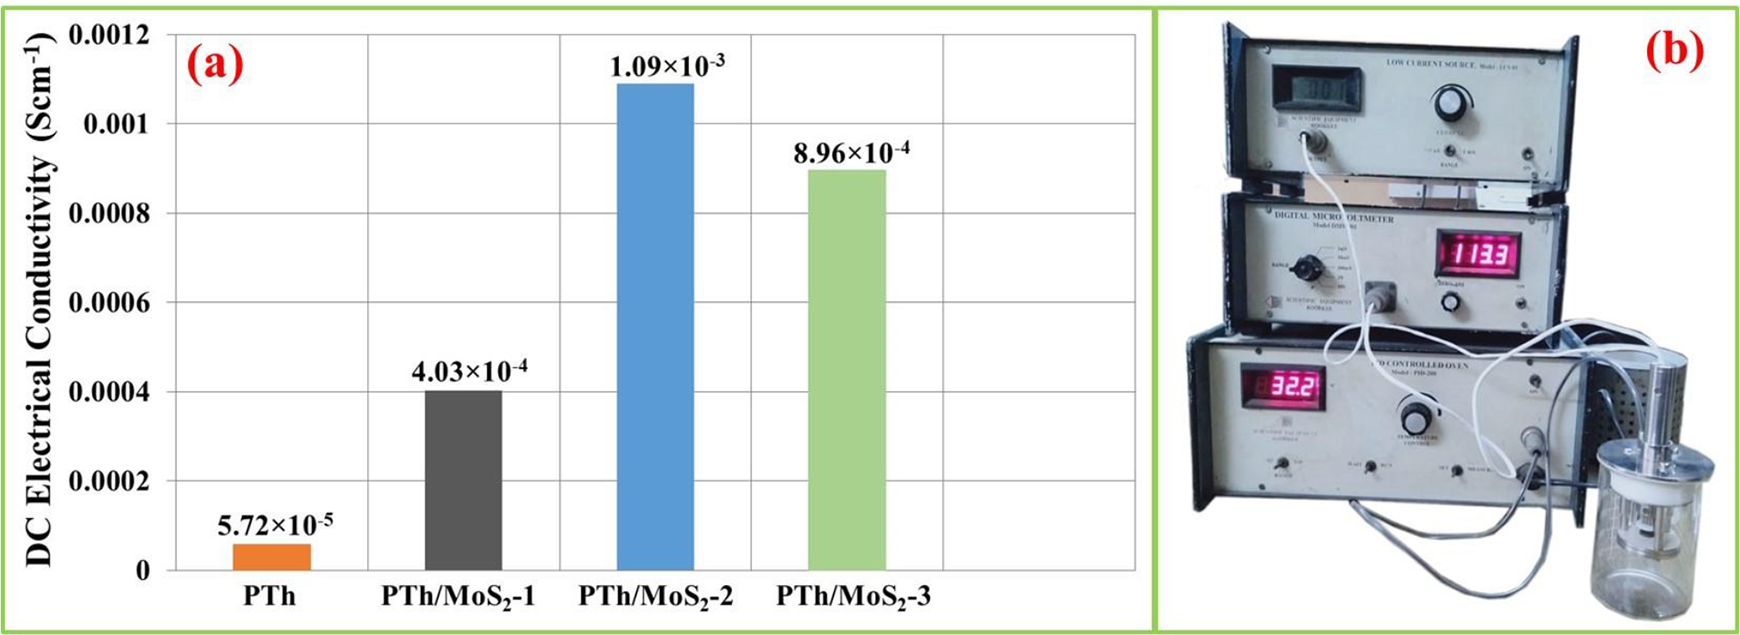
(a) Initial electrical conductivity of all the samples and (b) instrumental setup used in conductivity and sensing experiments.
DC electrical conductivity retention under isothermal ageing condition
The thermal stability of all the materials was determined by electrical conductivity retention under isothermal ageing conditions. We used the following equation to calculate relative electrical conductivity (σr,t) at a particular temperature:

where σt and σo denote the DC electrical conductivity (Scm−1) at time t and zero, respectively. 11
PTh showed high stability at 50°C and 70°C, but at higher temperatures, the conductivity significantly decreased with increasing time (Figure 5(a)). However, PTh/MoS2-1 exhibited much-improved stability as compared to PTh. It was very stable at 50°C, 70°C and 90°C and showed good stability at 110°C upto 20 min after that conductivity started to decline sharply (Figure 5(b)). In the case of PTh/MoS2-2, a significant gain in conductivity was observed with increasing temperature upto 90°C, which showed excellent semiconducting nature. At 110°C, the conductivity decreased slightly but it was greater than that of at 50°C. Most importantly, along with an increase in conductivity at each increasing temperature, it also exhibited excellent stability upto 110°C (Figure 5(c)). PTh/MoS2-3 also showed very good stability upto 110°C but gained in conductivity was lower as compared to PTh/MoS2-2 (Figure 5(d)). The decrease in the conductivity at higher temperatures may be due to loss of dopant, loss of extended π-conjugated system due to degradation of PTh and removal of trapped moisture from materials. 33 So, all PTh/MoS2 composite samples showed improved stability in terms of conductivity retention as compared to PTh. Among all PTh/MoS2 composite, PTh/MoS2-2 showed the highest stability and semiconducting characteristics.

Relative electrical conductivity of: (a) PTh, (b) PTh/MoS2-1, (c) PTh/MoS2-2 and (d) PTh/MoS2-3 under isothermal ageing condition.
DC electrical conductivity retention under cyclic ageing condition
The thermal stability in terms of DC electrical conductivity retention was also investigated under cyclic ageing conditions. We used the following equation to calculate relative electrical conductivity (σr):

where σT and σ50 correspond to the DC electrical conductivity at temperature T (°C) and 50°C, respectively. 11
PTh exhibited good semiconducting properties (i.e. increase in conductivity with increasing temperature) for two successive cycles. For the third and fourth cycle, conductivity decreased continuously with increasing temperature (Figure 6(a)). All PTh/MoS2 composite showed better stability as compared to PTh. PTh/MoS2-1 was found to be stable upto the third cycle and the highest gain in conductivity was observed in the third cycle (Figure 6(b)). PTh/MoS2-2 showed the gain in conductivity for all four cycles which may be due to greater mobility of charge carriers at elevated temperatures (Figure 6(c)). After the first cycle, PTh/MoS2-2 also showed almost similar conductivity variation patterns which revealed the excellent stability in terms of conductivity retention. PTh/MoS2-3 (Figure 6(d)) also gained conductivity with increasing temperatures but the retention of conductivity was inferior as compared to PTh/MoS2-2. Thus, PTh/MoS2-2 was found to be the most stable semiconducting material.

Relative electrical conductivity of: (a) PTh, (b) PTh/MoS2-1, (c) PTh/MoS2-2 and (d) PTh/MoS2-3 under cyclic ageing condition.
Sensing
Acetone and acetaldehyde sensing characteristics of all the prepared sensor pellets were evaluated in terms of % sensing response, response time and recovery time. First of all, the selected pellet was firmly connected with the probe of the device. Then, it was kept in 250 mL beaker containing 5 mL of testing sample, i.e. acetone and acetaldehyde (Figure 4(b)). The pellet was exposed in the vapour of testing sample for 200 s. After that, it was removed from the beaker and kept in the ambient air for 200 s. A sudden and regular decrease in the conductivity of each sensor was observed in the vapour of the testing sample, which became constant after some time. While in the air conductivity of each sensor started to increase and became saturated (Figure 7). All the PTh/MoS2 composite sensors showed an excellent dynamic response of conductivity in the vapour of acetone/acetaldehyde and ambient air (Figure 7(b) to (d)). The conductivity of PTh/MoS2 composite sensors returned to their initial conductivity in the air, which showed excellent reversibility of the sensors. But, in the case of the PTh sensor (Figure 7(a)), conductivity did not return to the initial value showing poor reversibility as compared to PTh/MoS2 composite sensors.
The sensing response (%) of all the sensor was calculated for the change in DC electrical conductivity upon exposure to acetone/acetaldehyde vapour for a period of 200 s. The % sensing response (S) was calculated employing the following formula:

where: σi and
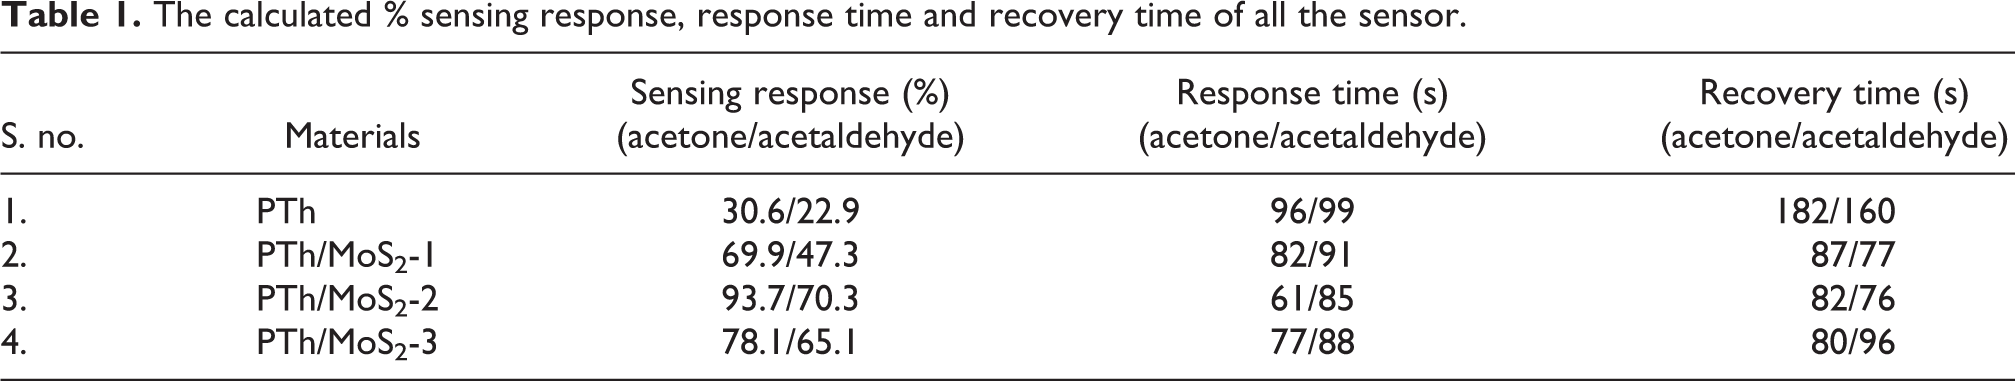
The calculated % sensing response, response time and recovery time of all the sensors are given in Table 1. All the PTh/MoS2 composite sensors showed much-improved sensing response and response/recovery time as compared to the PTh based sensor. These results revealed that incorporation of MoS2 into PTh matrix significantly improved acetone/acetaldehyde sensing properties of PTh. However, the best results were obtained in case of PTh/MoS2-2.
The calculated % sensing response, response time and recovery time of all the sensor.

The variation in conductivity of: (a) PTh, (b) PTh/MoS2-1, (c) PTh/MoS2-2 and (d) PTh/MoS2-3 with respect to time.
Sensing mechanism
The sensing characteristics of conducting polymers and their composites materials depend on the adsorption of analyte gas/vapour molecules. After the adsorption, electronic interaction between charge carriers of conducting polymers and analyte molecules alter the conductivity/resistance of sensors depending upon the nature of analyte molecules.2–4 Therefore, the improved performance of PTh/MoS2 composite sensors may be related to the greater surface area provided by MoS2, which enabled a greater number of active sites for the adsorption of acetone/acetaldehyde molecules.
Herein, the decrease in the conductivity was due to adsorption of acetone/acetaldehyde molecules on the surface of sensor pellets and interaction between lone pairs of electrons of oxygen atoms with polarons (charge carriers) of PTh and PTh/MoS2 composite. This type of interaction caused a decrease in the quantity as well as mobility of polarons resulting in a sudden fall in the conductivity which remained to decrease until all the active sites were occupied by acetone/acetaldehyde molecules. While in the air, the acetone/acetaldehyde molecules started to desorb from the sensor surface and thus quantity, as well as mobility of the polarons, increased with the rate of desorption. After the completion of desorption, conductivity became saturated. Therefore, the adsorption–desorption of acetone/acetaldehyde molecules on the sensor surface successfully explained the sensing mechanism involved (Figure 8).

The proposed sensing mechanism showing electronic interaction of acetone/acetaldehyde molecules with the polarons of (a) PTh and (b) PTh/MoS2 composite sensors.
Conclusions
This study reveals the preparation of polythiophene (PTh) and three polythiophene/molybdenum disulphide (PTh/MoS2) composites by in-situ chemical oxidative polymerization method using anhydrous ferric chloride (FeCl3) as an oxidant and chloroform (CHCl3) as a solvent. The materials were successfully characterized by Fourier transform infrared spectroscopy (FTIR), X-ray diffraction (XRD), scanning electron microscopy (SEM) and transmittance electron microscopy (TEM). The initial DC electrical conductivity of PTh, PTh/MoS2-1, PTh/MoS2-2 and PTh/MoS2-3 was found to be 5.72 × 10⁻⁵ Scm−1, 4.03 × 10⁻⁴ Scm−1, 1.09 × 10⁻³ Scm−1 and 8.96 × 10⁻⁴ Scm−1, respectively. All the PTh/MoS2 composites showed greater conductivity retention properties than PTh under isothermal and cyclic ageing conditions. However, PTh/MoS2-2 was found to be the best semiconductor in terms of initial conductivity as well as retention of conductivity. The % sensing response of PTh, PTh/MoS2-1, PTh/MoS2-2 and PTh/MoS2-3 based pellet-shaped sensors towards acetone/acetaldehyde were testified as 30.6/22.9, 69.9/47.3, 93.7/70.3, 78.1/65.1, respectively. PTh/MoS2-2 based sensor performed better than other sensors in terms of response/recovery time. Thus, electrical conductivity and acetone/acetaldehyde sensing performance of PTh can be significantly improved through the formation of PTh/MoS2 composites. Moreover, the electrical conductivity and sensing properties of PTh/MoS2 composites depends on the % loading of MoS2 into PTh matrix. Among all the PTh/MoS2 composites, PTh/MoS2-2 exhibited the best results which showed that the optimum % loading of MoS2 into PTh was 10% to the weight of thiophene monomers.
Footnotes
Acknowledgements
We are very much thankful to Professor Faiz Mohammad for his indispensable guidance and support during the preparation of this manuscript.
Declaration of conflicting interests
The author(s) declared no potential conflicts of interest with respect to the research, authorship, and/or publication of this article.
Funding
The author(s) received no financial support for the research, authorship, and/or publication of this article.