
Abstract
The aim of this work is to understand the effect of concentration of plasticizer, particle size and wt% of nanoparticles on nanocomposites by fabricating poly lactic acid (PLA) based bio-nanocomposites. The bio-nanocomposites were prepared by a solution casting method with PLA as the matrix, chloroform as solvent and poly ethylene glycol (PEG) as plasticizer. Microcrystalline cellulose (MCC) and cellulose nanocrystal (CNC) were used as reinforcements in 1, 3 and 5 wt% to modify the properties of the bio-nanocomposite. The degradation kinetics of the PLA based composites were determined by using the Coats-Redfern equation over the range of 0-5 wt% of MCC and CNC. Fabricated PLA based composite films were analyzed by differential scanning calorimetry (DSC), thermo gravimetric analysis (TGA), X-ray diffraction (XRD), Fourier transform infrared spectroscopy (FTIR), dynamic light scattering (DLS) and field emission scanning electron microscopy (FE-SEM). The analyses showed that the amount of PEG, MCC and CNC affected the degree of crystallinity. DSC results showed that the MCC/CNC content level affected the degree of crystallinity compared to neat PLA. The FTIR showed a free hydroxyl group (−OH) present in the system. The TGA analysis showed that the PLA/MCC3%/ PEG 10% composition had the highest stability compared to the other compositions but less than neat PLA.
Introduction
Biodegradable polymer nanocomposites are widely studied in an effort to eliminate the use of harmful polymer counterparts. Polymer based composites are used in many areas including food packing, tissue engineering, scaffold, drug delivery and textiles.1,2 Many of these areas are directly or indirectly affecting the environment. Plastic packaging is one of the greatest contributors to plastic pollution, for its shortest life-span. Plastics in the form of film and bottles are used as packaging material for many applications. The majority of these plastic wastes is sent to landfills or disposed of into the environment and only less than 10% has been recycled properly. Because plastic is not biodegradable, every piece of plastic ever made is still on this earth. This drives the research toward better bio-based materials. Many bio-composites are formed by using bio-based matrices and reinforcements which are biocompatible and biodegradable. Polylactic acid (PLA), polyglycolic acid (PGA), polycaprolactone (PCL) and polyhydroxyalkanoates (PHA) are some of the biodegradable polymer matrix materials. Bio-based reinforcements include cellulose and chitosan.3,4 The addition of a filler into a polymer matrix can improve the mechanical, barrier, thermal, electrical and conductive properties of the matrix. When polymer and filler of different polarities are combined it creates an inter-phase polarity difference, causing phase separation. This phase separation between polymer and reinforcement can be minimized by adding a compatibilizer, or by doing chemical treatment or corona treatment on the filler particles.
PLA is the most extensively studied biodegradable polymer because of its reasonable strength, high stiffness, good processability and generation of no harmful gases upon incineration.1,2 PLA is a thermoplastic aliphatic polyester which is produced from renewable resources such as starch or corn, through a fermentation process. PLA has been used in many applications to meet biocompatibility and biodegradability requirements such as drug carriers, medical purpose, textile, food packaging, tissue engineering and biological scaffolds. Major limitations for PLA are poor water resistance and oxygen barrier properties, rigidity and low impact resistance at room temperature and low melt strength. For food packaging purposes PLA films are avoided due to poor barrier properties and rigidity. These drawbacks of PLA can be overcome to an extend, by blending/compounding with other polymers, plasticizer and reinforcement fillers, hence broadening the range of PLA for commercial applications.
Cellulose is an excellent candidate for bio-based reinforcement for improving the properties of PLA based matrices. The mechanical performance of composites is expected to depend on the following factors: adhesion between the PLA matrix and cellulosic reinforcements, stress transfer efficiency of the interface, volume fraction of the fibers, aspect ratio of the reinforcements, fiber orientation and the degree of crystallinity of the matrix. 5 The tensile strength and modulus of the composite can be improved with a high aspect ratio of reinforcement even in the case when the adhesion is poor. 6
The addition of cellulose into PLA has been shown to improve barrier properties, mechanical properties, water vapor transmission resistance and thermal properties of PLA.3,4 Micro crystalline cellulose (MCC) and cellulose nanocrystals (CNC) are the two forms of cellulose that can be used as reinforcements. MCC finds application in industries such as pharmaceutical, food and beverages, personal care, paints and coatings due to properties such as significant compressibility, efficient binding ability, internal porosity and biodegradability. In the nanocomposite area, high strength elastomeric nanocomposite was successfully prepared in a polyurethane matrix with the incorporation of microcrystalline cellulose as bio filler. Apart from improved strength and stiffness of composite material as compared to pure polyurethane, the prepared nanocomposites showed increased strain to failure. These improvements are believed to be due to good interaction, by both covalent and hydrogen bonds, between the polyurethane and the MCC. 7
CNCs have higher aspect ratio, good mechanical properties, low toxicity, high specific strength, modulus, low density, renewable in nature and are cost effective.4,8 CNC has been used as a nanofiller in polymer nanocomposites for applications such as scaffold for tissue engineering, drug delivery, transparent film, super-capacitors, organic solar cell, furniture industries and automobiles.9–12
Various types of nanoparticles with varying size, shape and functionalities have been introduced and incorporated within PLA. These nanoparticles could be listed as layered nanosilicates,13–15 nanosilica,16,17 single wall and multi wall carbon nanotube,18,19 graphene20,21 and titanium dioxide. 22 However, most of these nanofillers may not be nontoxic and/or biodegradable. In this context, the use of fully biodegradable, renewable and nontoxic nanofillers to produce PLA based “green composites” or “biocomposites” has become of great interest to researchers. Owing to its abundance in the nature, nontoxic feature, and biocompatibility, cellulose has been recognized as one of the biofiller candidates to develop PLA composites for such applications as food packaging and biomedical. Although superior properties could be obtained in PLA nanocellulose composites, the development of these nanocomposites with well-dispersed nanocellulose is still a serious challenge. This is majorly due to the poor dispersion of cellulose nanoparticles which restricts the production of nanocomposites. This is also due to the high hydrophilicity of cellulose nanoparticles with strong hydrogen bonding among particles. 23 Grafting of PLA chains on the surface of nanocelluloses has also been explored to enhance the compatibility between the nanocellulose and PLA. 24 Kamal and Khoshkava 25 studied the rheological, mechanical and crystallization properties of PLA/CNC nanocomposites and found that the well-dispersed CNC nanofiller in PLA composite system can promote thermomechanical properties of PLA composite in both the glassy and rubbery regions.
In the present work PLA was selected as the matrix material and MCC and CNC as reinforcements. PLA is hydrophobic and non-polar in nature even though it contains polar ester linkage compared to cellulose. Cellulose is hydrophilic and polar in nature and contains hydroxyl (−OH) group. The ester links of PLA enable interactions with (−OH) groups of cellulose by forming hydrogen bonds. The interfacial interaction between PLA and cellulose can be improved by adding polyethylene glycol through hydrogen bonding, with the PEG act as a plasticizer also. The lower the molecular weight of the PEG higher the plasticizing effect. Polyethylene glycol with lower molecular weight have a large number of hydroxyl groups per mole as compared to the higher molecular weight ones. A low molecular weight of polyethylene glycol enables a high plasticizing effect. In addition, poly ethylene glycol in liquid form can help in the uniform dispersion of the cellulose.
Experimental techniques
Materials and methods
PLA (3251) was purchased from Nature Works LLC, USA with a weight average molecular weight (Mw) of 5.5 × 10⁴ g/mol and polydispersity index of 1.62. Polyethylene glycol (PEG 600) with a number average molecular weight (Mn) of 600 and polydispersity index of 1.04 was purchased from Loba Chemie Pvt. Ltd, India. Microcrystalline cellulose was procured from Himedia Laboratories Pvt. Ltd, India.
Synthesis of cellulose nanocrystal
Cellulose nanocrystals were prepared from the MCC via an ultrasound treatment (with dual frequencies of 25 and 75 kHz) by using probe sonicator, Kinglab instruments pvt ltd, Chennai, (model: Klpro-250, Capacity: 250 ml) for 1 h at room temperature. The prepared material particle size was analyzed by using dynamic light scattering (DLS).
Bio-nanocomposite fabrication
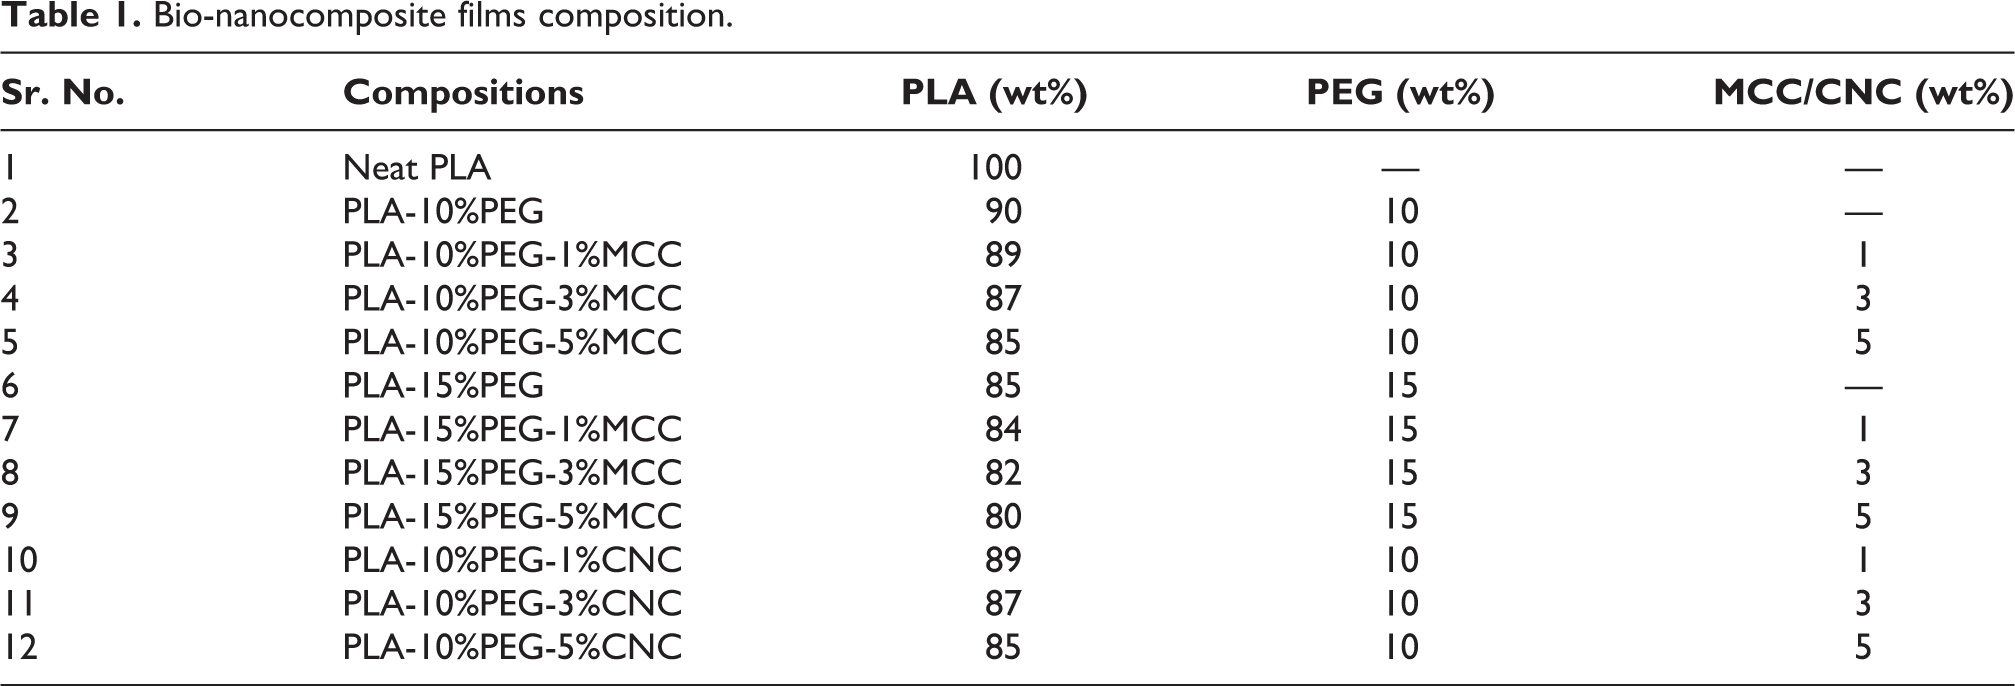
PLA based nanocomposite films with different compositions of plasticizer and filler were prepared by a solution casting method (Table 1). The PLA was added into chloroform and stirred for 30 min at 45°C to form the PLA solution and two samples of PLA solutions were prepared. In two samples of PLA solutions, 10 wt% and 15 wt% PEG (600) were added in individual PLA solutions and stirred for 30 min at 45°C. Simultaneously 1, 3 and 5 wt% of MCC and CNC were dissolved separately in chloroform for 1 h at 45°C. Afterward, 10 and 15 wt% PLA-PEG solutions were added into each MCC and CNC solutions and stirred for 1 h at 45°C. Finally, the resultant solution was transferred onto a Petri dish and oven dried at a temperature of 60-65°C for 8 h, forming films of 2 mm thickness.
Bio-nanocomposite films composition.
Characterizations
DSC analysis
Thermal properties were established by differential scanning calorimetry (DSC) using a SDT Q600, TA Instrument. All samples were heated from −50°C to 225°C at a rate of 10°C/min under inert nitrogen medium. The glass transition temperature (Tg), melting temperature (Tm), crystallization temperature (Tc), melting enthalpy (

where
Thermogravimetric analysis (TGA)
The TGA gives information about the thermal stability of the sample. Thermogravimetric analysis (TGA) was carried out using SDT Q600, TA Instrument Inc, Delaware, USA. The samples were heated under an inert nitrogen environment from room temperature to 800°C at 10°C/min. Polymers were ultimately consumed by reaction with oxygen to form H2O, CO, or CO2 in atmospheric condition. Such behavior was not possible with polymers that formed a substantial amount of carbonaceous char during decomposition in nitrogen atmospheres.
Fourier transform infrared spectroscopy (FTIR)
FTIR analyses were used to study the different functional groups on the MCC, MCC-PEG, CNC-PEG and PLA based composites. Thermo Scientific iS 10 spectrometer was used. Measurements were done in the spectral range from 4000-500cm−1 at a resolution of 0.9 cm−1.
X-ray diffraction (XRD)
X-ray diffraction was carried out using Rigaku, Ultima IV instrument at a scan rate of 0.02 degree/sec with a step size of 0.02 degree for 2θ values in the range 10 to 80° using CuKα (1.54 Å´) radiation in the Braggs-Brentano geometry. The crystallite sizes were calculated by using the Scherrer equation for the MCC and CNC.

where λ is the radiation wavelength (1.54 Å´),
Dynamic light scattering (DLS)
The particle size distribution for the MCC and CNC, dispersed in water were obtained from a Zeta nanosizer (Malvern ZEN360). DLS makes use of Brownian motion of the suspended particles to measure their size distribution.
Field emission scanning electron microscopy (FE-SEM)
Particle morphology and size of MCC and CNC were studied by using a Sigma HV Carl Zeiss field emission scanning electron microscope with a field emission gun operating at 10 kV. The chloroform dissolved MCC and CNC solution drop was placed on the surface of the carbon substrate and oven dried at 65°C for 8 h and then sputtered with gold particles. Prepared this sample was used for FE-SEM analysis. In FE-SEM, MCC was observed at magnification of 5000× and CNC was observed at magnification of 10000×.
Results and discussion
DSC analysis
It is seen that crystallinity of PLA based composite has been increased in comparison to neat PLA as investigated by DSC analysis. Two different compositions of plasticizer 10 and 15 wt% PEG were used to understand its effects on the degree of crystallinity, melting temperature (Tm), glass transition temperature (Tg) and specific melting enthalpy (ΔHm).26–32
The DSC analysis showed that (Table 2, Figure 1(a) and (b)) degree of crystallinity, Tg and Tm of neat PLA and 37.9%, 57.2°C and 168.6°C, respectively. The glass transition temperatures of the modified materials were decreased after adding 10 wt% and 15 wt% of plasticizer. The plasticizer gives more flexibility since it increases the mobility of the polymer chains; in addition it slightly changed the crystallinity as compared to neat PLA. The addition of 1 wt% MCC into PLA-PEG (10 wt%) and PLA-PEG (15 wt%) resulted in crystallinity of 38.9% and 43.0%, with also decrease in Tg value compared to PLA/PEG composition. It indicates that MCC acts as foreign particle, due to the presence of foreign particles it helps to enhance the nucleation growth in the matrix. Plasticizer helped to improve the intermolecular interaction between the PLA and MCC. However, when the amount of MCC (3 wt%, 5 wt%) were incorporated into PLA-PEG(10 wt%) and PLA-PEG(15 wt%) it started decreasing crystallinity to 38.8%, 30.6% and 36.3%, 33.1%, respectively with increased Tg values compared to 1% MCC composition, which might have caused due to MCC agglomeration.
Thermal properties of PLA based composite by DSC test.


DSC curves of PLA based composites (MCC) in (a) heating and (b) cooling mode and those of (c) neat PEG (heating and cooling) and (d) neat MCC (heating) and neat CNC (heating).
In another observation, for PEG 15 wt% in PLA-1 wt%, 3 wt%, 5 wt% of MCC from (Figure 1(a) and (b)), it shows phase separation by indicating an extra endothermic peak in heating curve in the range of 11-15°C which belongs to melting range of PEG, however extra peak was not observed in 10 wt% of PEG.33,34 It shows that extra endothermic peak leads for phase separation in heating curve and also extra exothermic peak was observed around 0°C in cooling curve it belongs to freezing point of PEG indicates the phase separation. It indicates the presence of more concentration of PEG which affects the dispersion of PEG in PLA and MCC composition. This extra endothermic and exothermic peak position resembles a neat PEG endothermic and exothermic peak position (Figure 1(c) and (d)).
It was observed that the addition of CNC into PLA-PEG 10 wt% caused phase separation, and it indicates that the presence number of hydroxyl group (−OH) depends on particle size and affects intermolecular hydrogen bonding in the system and leads to phase separation (Figure 2). The PLA-PEG (10 wt%)/(1, 3, 5) wt% MCC showed no phase separation, but CNC based composites showed phase separation.
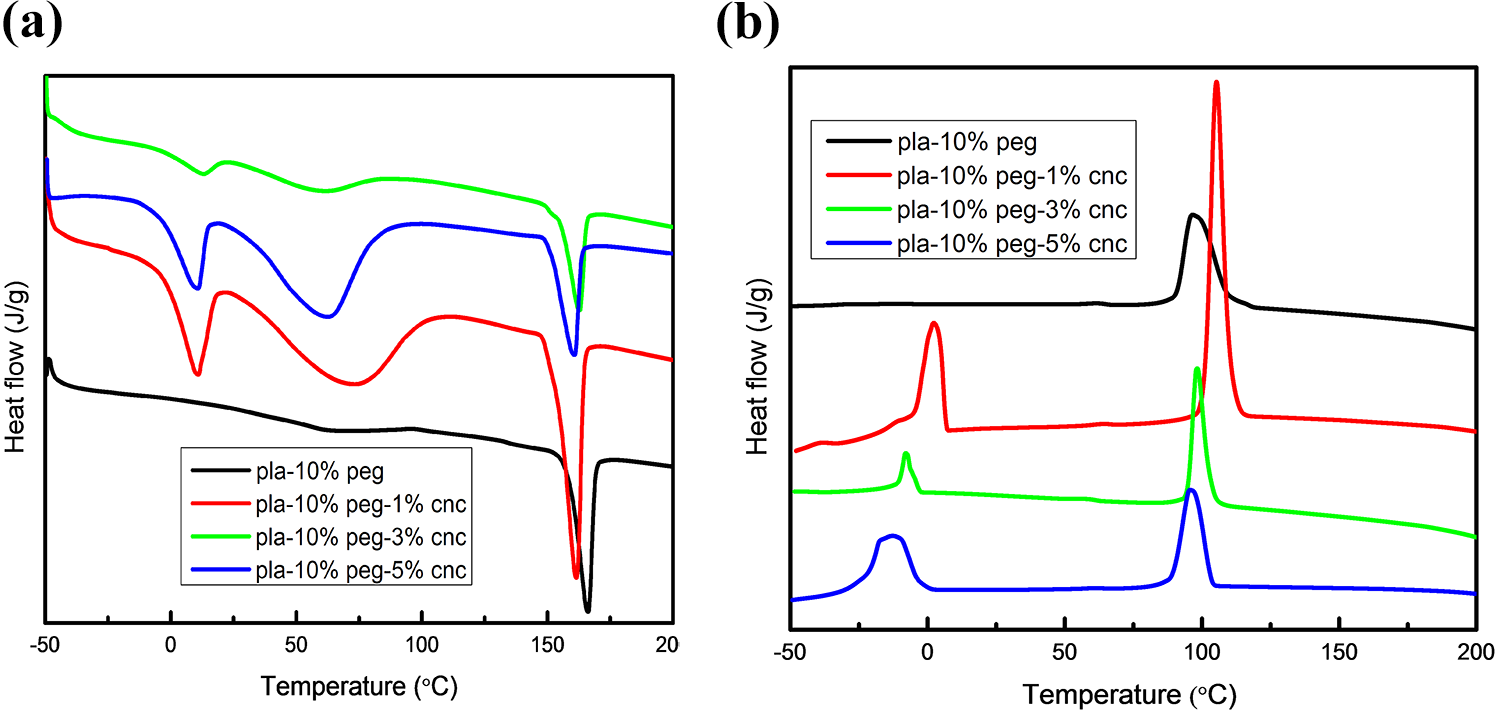
DSC curves of PLA based composites (CNC) in (a) heating and (b) cooling mode.
TGA analysis
Figure 3 shows the thermal degradation of MCC and PLA based composites as obtained from TGA and DTG analysis. Only one decomposition stage was observed for the neat PLA and PLA based composites from the TGA analysis. For all the samples initial weight loss was observed for the temperature range of 200°C to 280°C. The maximum degradation temperature of the neat PLA was at 365°C. PLA starts decomposing at ∼323°C. Upon addition of PEG (10 wt%) and PEG(15 wt%) as plasticizer into PLA, the decomposition onset was shifted to a lower temperature range of ∼244°C and 238°C, respectively. The addition of 1 wt%, 3 wt% and 5 wt% MCC with PLA-PEG 10 wt% and PLA-PEG 15 wt% resulted in decomposition onset temperatures of ∼262°C, 264°C, 250°C and 246°C, 247°C, 243°C, respectively. Thus, the thermal stability of neat PLA was better compared to the PLA based composites. The inferior thermal properties of the PLA based composites can be due to the poor thermal stability of PEG which was added to improve the flexibility of the PLA and for better dispersion of PLA matrix and MCC/CNC reinforcement. Thus, the addition of 1, 3 wt% of MCC into PLA-PEG (10, 15 wt%) increased the thermal stability of the composites compared to PLA/PEG composition but it was less than that of neat PLA. The addition of 5 wt% MCC into PLA-PEG (10, 15 wt%) further reduced the thermal stability. This may be due to the agglomeration and poor dispersion of MCC in the matrix, which accelerated the outward diffusion of volatile decomposition products. The uneven dispersion of MCC in the matrix may also have resulted in easy propagation of oxygen into the matrix.35–39

TGA and DTG curves for PLA based composites (MCC).
The TGA/DTG analysis for the CNC based composite indicated that degradation was shifted to a lower temperature range as compared to the MCC based composite (Figure 4(a)). Addition of 1, 3 and 5 wt% CNC into PLA-PEG (10 wt%) the degradation onset temperatures were at 232.2°C, 226.2°C and 220.3°C, respectively (Table 3). The reduction in size of the cellulose particles would result in higher surface area per unit volume, leading to higher heat transfer rate. 40 This high heat transfer rate reduces the apparent degradation temperature of the nanocomposites. The TG and DTG curves of neat CNC indicate that CNC degrades at lower temperature in comparison with MCC (Figure 4(b)).This decrease can be attributed to either the increase in the surface area, fragmentation or decrease in crystallinity caused by the ultrasonic process used for synthesis of CNC. 41
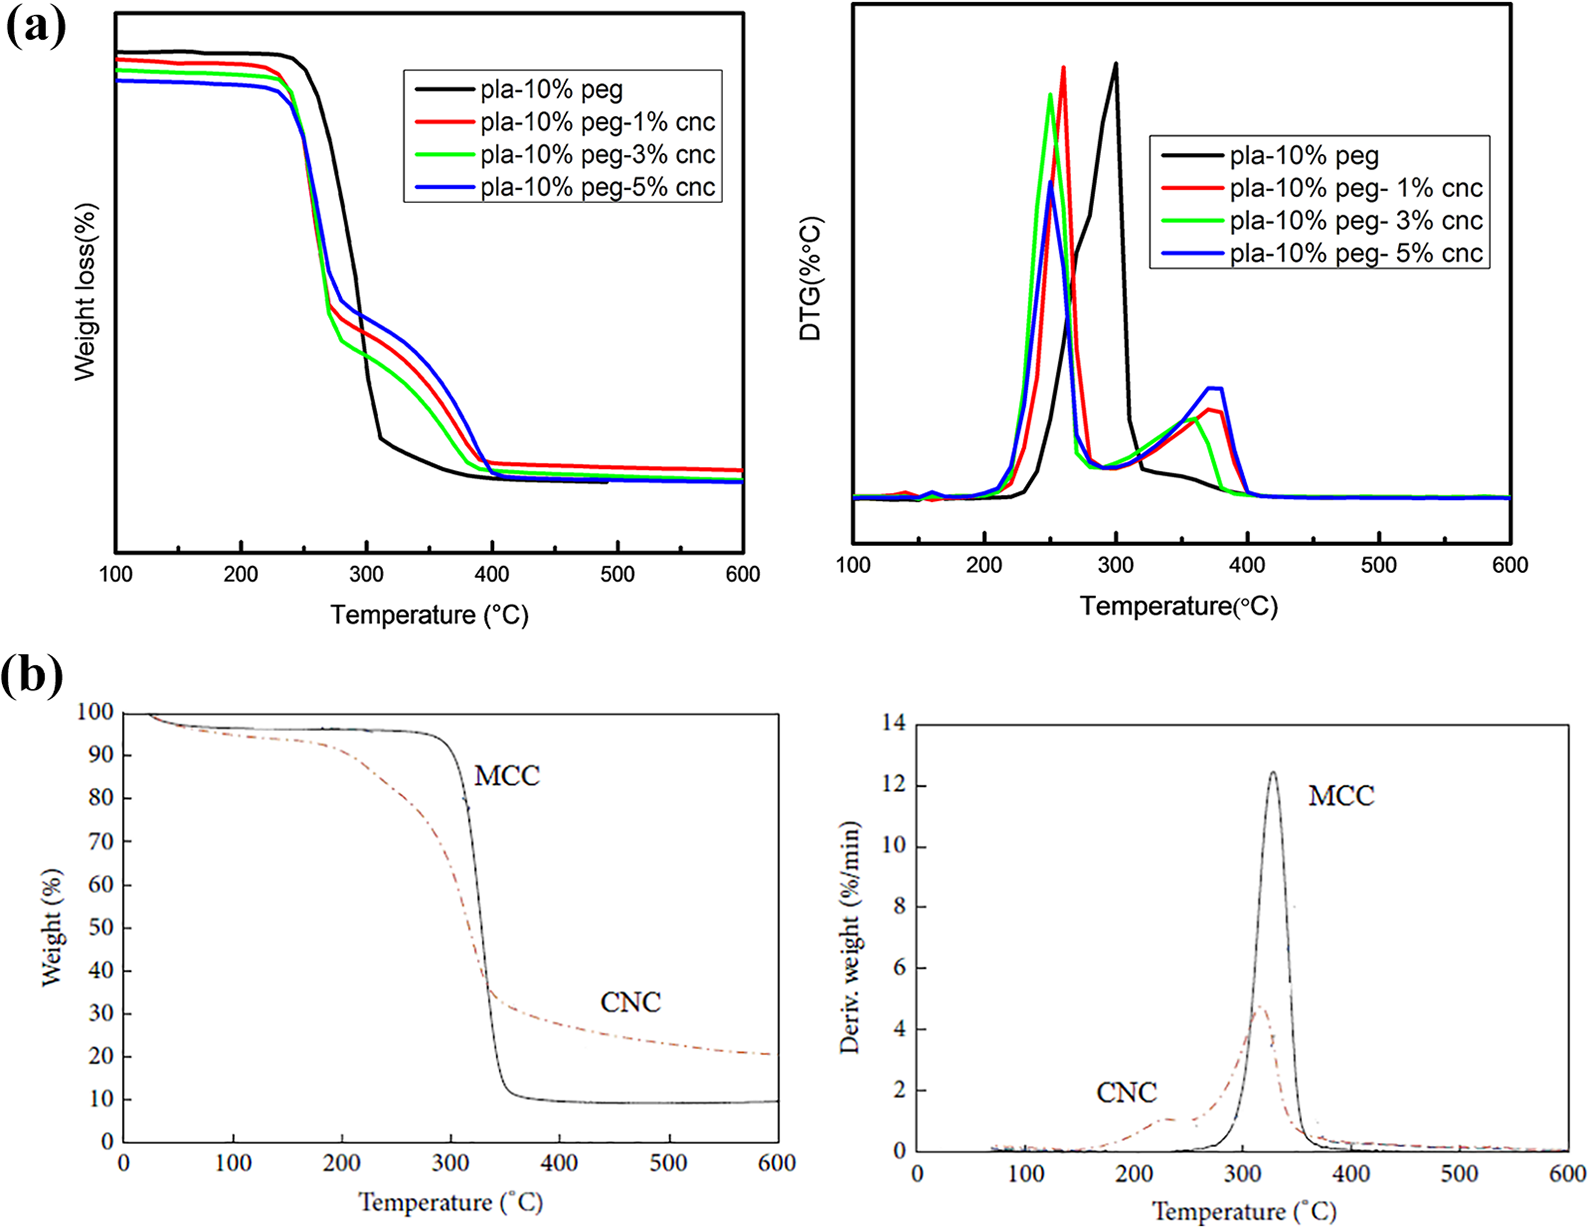
TGA and DTG curves for (a) PLA based composites (CNC) and (b) neat MCC and CNC.
Thermodynamic parameters of PLA based composites.

Kinetic study of degradation
In the present study the kinetic variables of decompositions for PLA, PLA-PEG blend and PLA based composites were established by using the mathematical method proposed by Coats-Redfern.42–47 The kinetic parameters were calculated using equation of:


Coats-Redfern graphical analysis for PLA based composites (MCC).

Coats-Redfern graphical analysis for PLA based composites (CNC).
The activation energy for degradation and the kinetic parameters are given in Table 3 which shows that incorporation of 10 and 15% PEG into PLA reduces the activation energy compared to neat PLA, indicating PEG favors degradation. The addition of 1, 3 and 5 wt% of MCC to PLA-PEG (10 wt%, 15 wt%) resulted in an increase in an activation energy compared to the respective PLA/PEG blend. This indicates that MCC increases the resistance to thermal degradation .
With the addition of 1, 3 and 5 wt% of CNC to the PLA-PEG (10 wt%) the activation energy was reduced due to the smaller particle size results in more surface area and higher heat transfer in the system.
The change of enthalpy (

where, E = Activation energy, R = 8.314 JK−1 mol−1 the universal gas constant, Tg (Tg is the glass transition temperature) is replaced by Tp (Tp is the differential peak degradation temperature of DTG curve) which gives the information about total thermal degradation.
The change of entropy (

where A = Pre-exponential factor; h = Planck’s constant, kB
The change of Gibbs free energy (

where, (
XRD
Crystallite size measurements were made for MCC and CNC based composites by using Scherrer equation which gives value for MCC and CNC in the range of 3.9 nm (for the plane of 200). There was no significant change in crystallite size of MCC and CNC. XRD patterns for MCC and PLA based composites were evaluated by using X-ray diffraction. In Figure 7(a) MCC shows three main peaks, at 15.26°, 22.18° and 34.10° corresponding to crystallographic planes 110, 200 and 004 respectively. The peak for neat PLA occurred at 16.37° and 18.72°. These two peaks appeared in all samples and they reflect the PLA crystalline structure in all of the PLA based composites. PLA has a semicrystalline structure. After blending with PEG, there were no significant changes in the peaks, which indicates that the PEG did not affect the crystalline structure of PLA. The Peak at =22.18° of MCC was absent in PLA based nanocomposite of 1 and 3 wt% MCC loading; it indicates that the amount of filler was insufficient to show the peak. Incorporation of 5 wt% MCC into PLA-PEG (10 wt%) and PLA-PEG (15 wt%) shows peak at 22.18° which is related to MCC contribution (Figure 7(b)). In addition of CNC into PLA based composites there were no significant changes observed in terms of crystal lattice parameters and crystallite size, similar to the addition of MCC.

X-ray diffraction pattern: (a) MCC and CNC and (b) PLA based nanocomposites with (MCC) and (CNC).
FTIR analysis
Figure 8(a) shows the FTIR spectra of MCC and CNC. The spectral bands for MCC and CNC at 3346 cm−1 (–OH stretching), 2901 cm−1 (C–H stretching) symmetric and asymmetric vibration of CH2 group, 1640 cm−1 (frequency of deformation vibration of CH2 and CH groups are located), 1430 cm−1 (asymmetric CH2 bending and wagging), 1371 cm−1 (the C–H bond), 1318 cm−1 (CH bending mode), 1281 cm−1 (the C–O stretching mode of ester group), 1164 cm−1 (C–C ring stretching bond), 1112 cm−1 (the C–O–C ether bond), 1051 cm−1 (the C–O–C stretching vibration). 4 The spectral bands of CNC at 3346 cm−1 are broader than MCC band indicating the more hydroxyl groups (–OH) presence in the CNC particle.

FTIR spectra of (a) neat MCC (a) and neat CNC (b) and (b) PLA based composites with MCC and CNC.
Figure 8(b) the main peaks for neat PLA were obtained at 2910 and 1747 cm−1. The Presence of peak at 1747 cm−1 for neat PLA indicates that presence of C=O group and peak at 2910 cm−1 for presence of –CH groups. The peak is absent in the region of 3100-3500 cm−1, it indicates that amount of free hydroxyl group (–OH) was insufficient to reflect peak in that region for PLA/PEG (10 wt%), PLA/PEG (10 wt%)/MCC (1, 3, 5 wt%) and PLA/PEG (15 wt%)/MCC (1, 3 wt%). But for PLA-PEG (15 wt%) and PLA/PEG (15 wt%)/MCC (5 wt%) composition shows peak in the region of 3100-3500 cm−1 which indicates the presence of a more free (–OH) group.
From Figure 8(b) incorporation of (1, 3, 5 wt%) of CNC into PLA-PEG (10 wt%) shows peak in the range of 3100 to 3500 cm−1 which indicates presence of more free hydroxyl group (–OH) in the samples.
From Figure 8(b), it is clear that free hydroxyl group (–OH) band intensity increases with increasing PEG concentration in comparison of PLA/10% PEG and PLA/15% PEG composition.
Morphology
Dynamic light scattering
The particle size of the MCC and CNC was analyzed by dynamic light scattering method. MCC were dissolved in 5% (w/v) deionized water. The particle size diameter obtained was ∼254 nm (Figure 9). To synthesize the CNC, the MCC was dissolved in deionized water and sonicated for 1 h at room temperature for reducing particle size as well as proper dispersion. From Figure 9, it was observed that CNC particles size diameter in the range of 5 nm. Results of particle analysis were compared with FE-SEM images and finally concluded the particle size specifications.
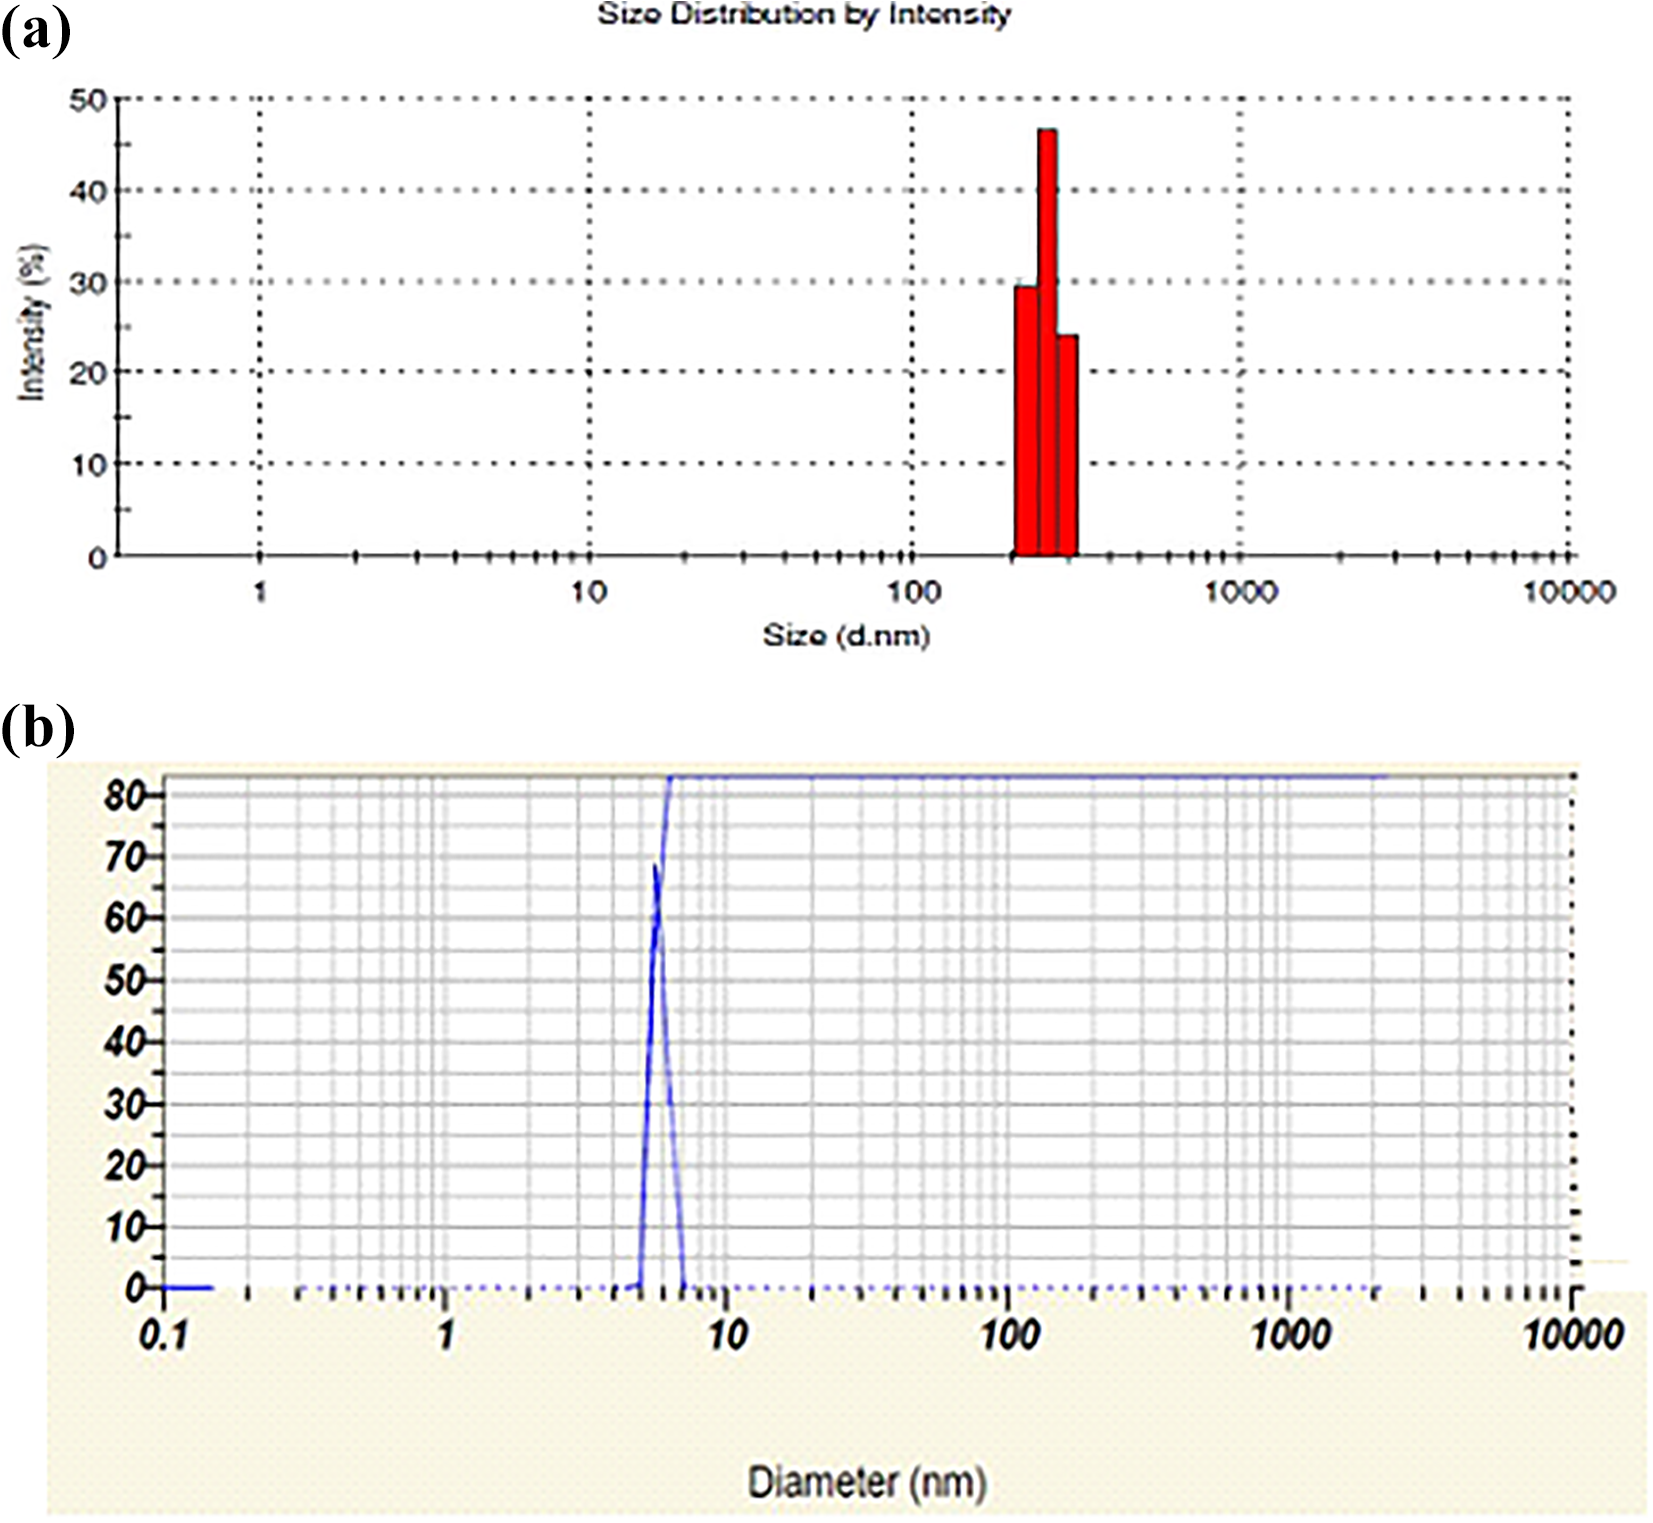
Particle size analyzer: (a) MCC sample and (b) CNC sample.
FE-SEM analysis
The MCC particles were characterized by using FE-SEM analysis (Figure 10). The FE-SEM analysis reveals that the morphology of MCC particles were rod shaped and average length of MCC particle was 600 nm and CNC particles were rod shaped with an average length of 400 nm.

FE-SEM images of (a) microcrystalline cellulose and (b) cellulose nanocrystal.
Conclusions
PLA based composites were fabricated by a solution method with MCC/CNC and PEG as reinforcement and plasticizer to improve the thermal properties and flexibility of PLA material, respectively. Incorporation of PEG as a plasticizer in PLA was shown to reduce the thermal stability from the thermal analysis. After adding MCC, an improvement in thermal stability of the PLA/PEG-MCC composite was indicated by the TGA studies but the stability was less than neat PLA. The PEG wt% and filler (MCC/CNC) particle size were seen to affect the miscibility of the nanocomposite system. PLA/PEG (10%)-MCC showed better miscibility than PLA/PEG (15%)-MCC. This was concluded from the DSC analysis giving an extra endothermic peak in the temperature range of 11-12°C in heating mode and an extra exothermic peak at temperature of ∼0°C in cooling mode for PLA/PEG (15%)-MCC composition. It indicates that more concentration of PEG resulted in more free hydroxyl group (–OH) within the system which affected the miscibility. In another study it was observed that the addition of CNC into PLA/(10 wt%) led to phase separation which is indicated in DSC study. This miscibility problem may be due to number of free hydroxyl groups (–OH) varying with filler particles size which leads to phase separation existing between PLA, PEG and CNC.
The DSC study showed the wt% of MCC affected the degree of PLA crystallinity by acting as nucleating agents. For 1 wt% MCC the crystallinity increased but for 3 and 5 wt% loading crystallinity decreased, attributions to the agglomeration of the filler particles. Addition of 1, 3, and 5 wt% of CNC into PLA/(10 wt%) PEG caused crystallinity % to decrease, which indicated a reduction in particles size of the cellulose was not favorable for increasing the crystallinity %. The TGA study showed the PLA was more thermally stable compared to the PLA based composite. The Kinetics degradation parameters obtained from the Coats-Redfern equation indicated that the PLA has a higher activation energy compared to the PLA based composites. The thermodynamics parameters for the degradation process were calculated and compared for the various samples. In addition, XRD analysis showed the presence of MCC/CNC did not affect the lattice parameters of the PLA crystal structure. FTIR spectroscopy revealed an increase of free hydroxyl groups (–OH) with increasing PEG amount, and the effect was more in PEG (15 wt%), seen in the broadened peak in the range of 3100-3500 cm−1 compared to PEG (10 wt%).
Footnotes
Declaration of conflicting interests
The author(s) declared no potential conflicts of interest with respect to the research, authorship, and/or publication of this article.
Funding
The author(s) received no financial support for the research, authorship, and/or publication of this article.