
Abstract
This work has been developed for a comparative purpose concerning the processing and respective mechanical performance of CFRP composites processed by resin transfer molding (RTM) and compression molding (CM) techniques. Thermal and viscosimetric tests before processing certified the optimal parameter procedure. Both composites were submitted to short-beam shear tests and through microscopy to determine failure mechanisms. CM specimens presented a decrease of 27% in shear strength caused by the presence of macro porosity that induced crack initiation and connection of different delamination plies, causing the speeding up of crack propagation and jump of the interlaminar layer. The low capillary effect and higher viscous force were responsible for macro porosity, inducing heterogeneous impregnation in CM and to the direction reduce in mechanical behavior. On the other hand, more homogeneous impregnation in RTM specimens was responsible for the absence of macro porosity, ensuring higher values of shear strength and lower void volume fraction.
Keywords
Introduction
Polymer composites used as structural and semi-structural materials have been increased and gained popularity since the ‘70s, replacing traditional materials previously used in aeronautic industries, mainly metals as steel and aluminum, innovating their competences on demand for high fuel, efficiency and lightness.1,2 In aircraft yield, one of the most used combinations of composites are carbon fiber reinforced polymer (CFRP). Although its higher cost compared with metals, this junction allows better mechanical performance and, at the same time, a component mass reduction. Besides, the presence of an interface with excellent adhesion between matrix and reinforcement is fundamental to the resistance to external loads applied on the part.3,4
As crucial as high-performance of matrix and reinforcement, the process plays a role influence on material mechanical behavior.5,6 Resin transfer molding (RTM) allows the manufacturing of versatile structures carried out in a closed system. RTM process presents advanced designs, appropriate surface finish, excellent dimensional tolerance and good impregnation of the matrix with low viscosity across fibrous reinforcement, which can take significant time to occur and is governed mainly by the reinforcement permeability and resin rheology.7–10 Compression molding (CM) is carried out by simultaneous application of heat and pressure in a mold already filled by the matrix and reinforcement, presenting a reasonable control of each component’s volumetric fraction and possibility of large-scale manufacturing in restricted applications. 11 The infusion process is interest due to the use of raw materials as dry fabric and liquid resin, which can lead to economic savings when compared to prepregs methods, as it requires stocking in a fridge and lead to higher costs process as the autoclave, for instance.9,12
Porosity is the primary defect that can occur in composites on account of partial impregnation, which may result in poor performance due to the non-effective load transfer between matrix and reinforcement. Its acceptance for structural application is usually around 2%, and it can be generated by air trapped in the system before or during manufacturing or when there is a macro-impregnation occurring before micro-impregnation, that is, the spaces between tows are filled but not the spaces between tow filaments.13–16 Several authors testify that higher void content conducts to a decrease in the mechanical performance of the part.17–19
One of the significant mechanical performance limitations of laminated composites is in delamination behavior due to the absence of fiber in the thickness direction. 20 The short-beam test could be used to evaluate shear behavior, mainly in the interlayer interface. However, it has limitations concerning establishing shear-stress-strain curves since, during the test, the sample may have significant bending stresses and not necessarily pure shear characterized by a mostly horizontal crack in the direction of the sample’s thickness. This test method of ASTM D2344 can be used as a quality control test of adhesion between fiber and matrix.21,22
In this qualitative context, several works have been carried out to deepen the viability of this test. Da Silva et al., 23 for example, varied the parameters of their tests such as the chemical treatment of natural fibers and also their lengths and observed their behavior in composites tested by Short-beam strength (SBS). Besides, the span-to-thickness ratio was varied, as shown by Christiansen et al. 24 study. Both studies reported that the higher the span: thickness ratio, the lower the SBS value. As a consequence, the curves will not tend to a steep peak, but a plateau with extended displacements, characterizing failures not only by pure shear but also a combination of bending due to traction and compression stresses in the sample, showing cracks running vertically (intralayer) and not only horizontal mid-in-plane as in interlaminar shear.22,25 Thus, the load versus displacement curve of the SBS test can be misinterpreted due to the load loss before the maximum load caused by failures such as crushing or compression, generating a sharp cracking noise and a peak in the curve that can show a sudden fall of 30% of load, one of the three ways to end the test according to ASTM D2344/D2344M-161.21,26
Despite the drawbacks of the SBS test, its effectiveness is suitable for assessing the quality of adhesion between the constituents and characterizing their failures. Therefore, to ensure a proper evaluation of the composites’ behavior, the SBS testing and the microscopic analysis were done to ratify the discussion of the failure type existing in the specimen. This work aims to verify and compare two composites manufactured by two different techniques, observing the presence of voids and their influence on the crack path and connecting these observations to the mechanical behavior.
Experimental procedure
Materials
Two laminates were produced, one by RTM and one by CM. Each laminate was consisted of eight layers of carbon Fiber Hexcel IM7 GP NCF biaxial, 410 g/m2, positioned at a quadriaxial architecture orientation defined by the classical laminate theory [0/90/(±45)2/90/0]s. The quantity of resin was calculated to give the theoretical fiber volume fraction of 70%. The resin was Bicomponent epoxy DER 331 and Curezol 2E4MZ hardener with proportion 100:2.
Methodology
Determining cure cycle
Differential scanning calorimetry (DSC) was performed in TA Instruments equipment, SII Nanotechnology, model Q20, series DSC 6220. The samples were heated from 25°C to 300°C, at a heating rate of 10°C min−1, and held there for 3 min, then cooled to 0°C at 10°C min−1 and re-heated to 300°C.
Figure 1(a) to (c) represents the curves used to determine the temperature and time required to construct the cure cycle. The curve of first heating in dynamic DSC (Figure 1(a)) enabled the choice of temperatures to determine cure by doing isothermal DSC (Figure 1(b)), which temperatures were chosen in the beginning, middle, and top of the exothermic curve of polymerization (indicated as I, II and III). No significant differences in cure time among the three isotherms was noted, hence 125°C was chosen as the cure temperature since lower temperatures allow save-cost by lower energy consumption.
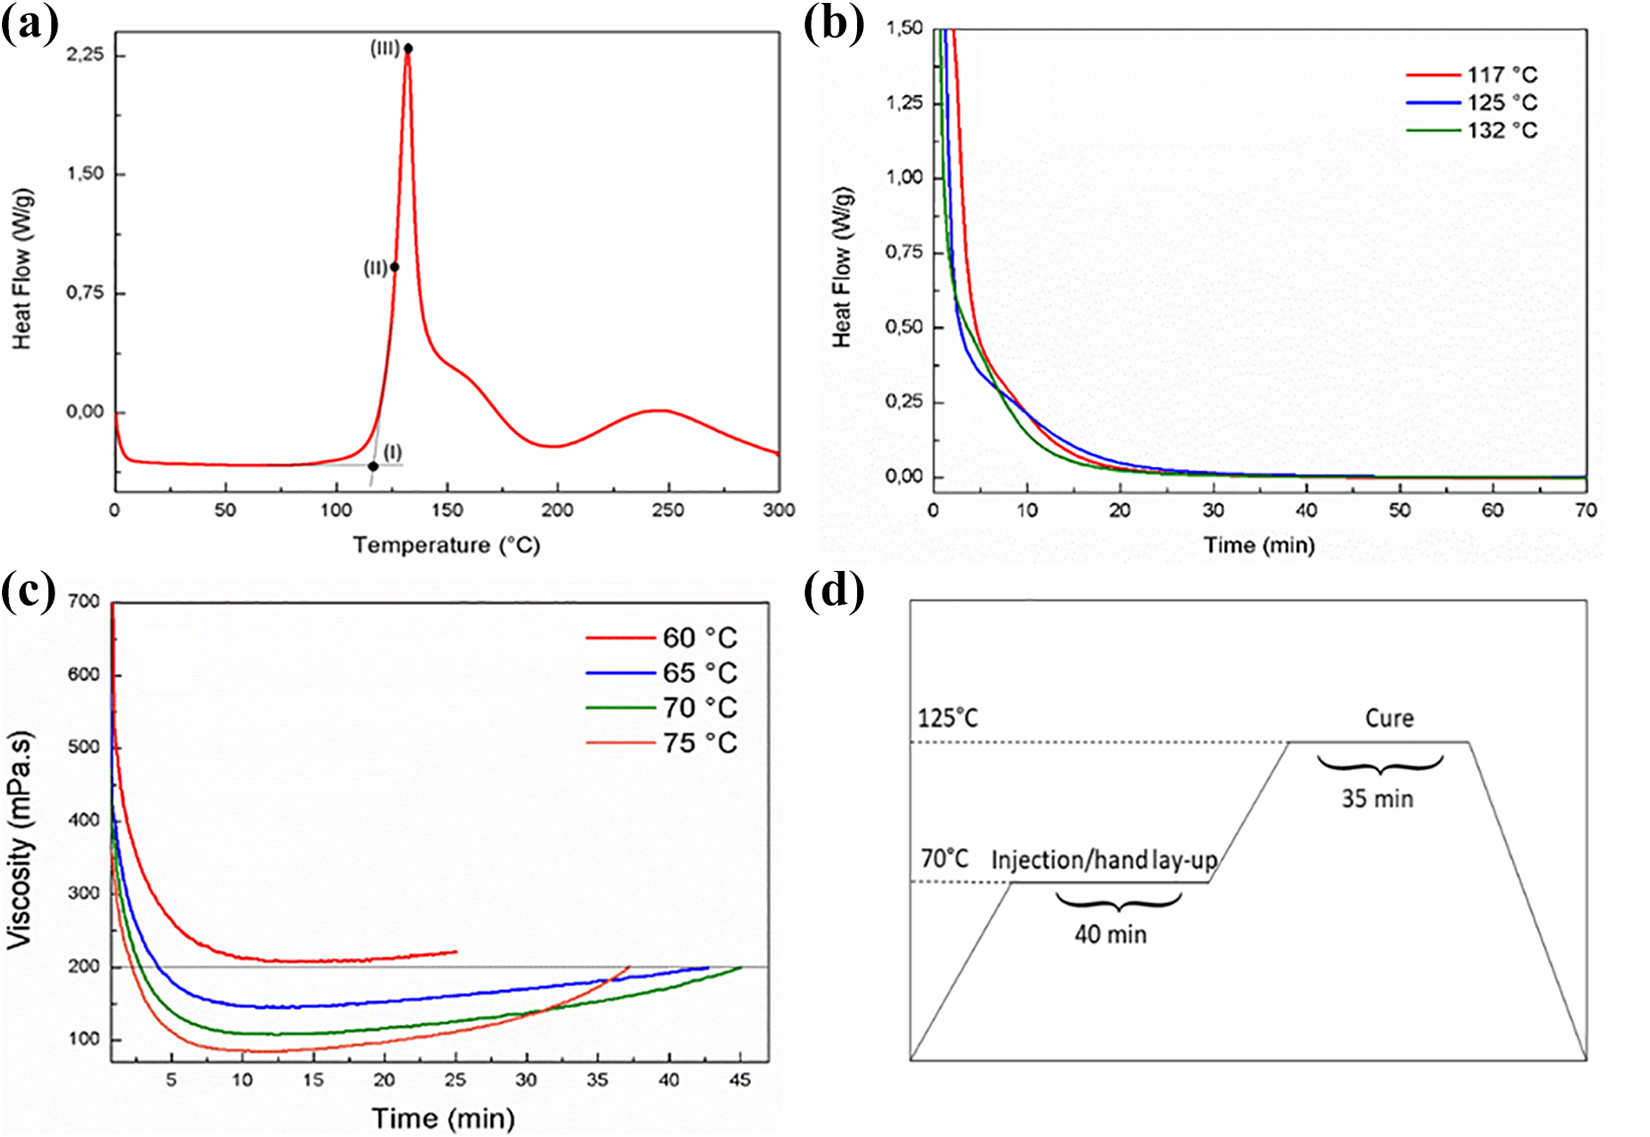
(a) Dynamic DSC—first heating; (b) isothermic DSC; (c) viscosimetry; (d) cure cycle.
To determine the appropriate viscosity for infusion, Brooksfield Viscosimeter equipment model DV-II + PRO-RV stem SC4-27 was used with 200 rpm. Each sample of approximately 10 mL was submitted to programmed temperatures at 60°C, 65°C, 70°C and 75°C, chosen from dynamic DSC, before the beginning of polymerization (stage I, according to Figure 1(a)). Figure 1(c) shows the curves for each temperature and, in order to maintain viscosity lower than 200 mPa·s for as long as possible, 70°C was then the temperature chosen for infusion in RTM and hand lay-up in CM. The cure cycle for processing is represented in Figure 1(d), where the first plateau of 70°C during 40 min was for injection, which guaranteed low viscosity for enough time to impregnate the fibers and, the second plateau of 125°C during 35 min ensured total reaction of the component, following literature procedure. 27
Processing
Resin transfer molding: The process was carried out by inserting the preform with a pre-established shape and orientation into the steel mold, which areal dimensions were 300 mm × 420 mm. The mold was then previously treated with Polydesm 55 release agent, and after closure, a vacuum of 0.5 mBar was applied. Lastly, the resin was injected using Radius 2100 cc RTM injector system with a pressure of 2.5 Bar. The inside thickness of the mold was 3 mm.
Compression molding: The equipment used was Carver’s CMG 100H-15-C press with dimensions 300 mm × 300 mm and a maximum compression force of 100 tons. The mold was previously treated with the release agent Polydesm 55. The reinforcement was positioned with the appropriate orientations previously impregnated by the bicomponent matrix by hand-layup. The upper and bottom mold was then closed, and a pressure of 1 ton was applied to assure that it does not exceed maximal thickness of 3 mm for comparison study.
Characterization
Ultrasound testing: After the consolidation of composite plates, process impregnation quality was verified by ultrasound acoustic inspection in OmniScan MX2, OLYMPUS® equipment. C-scan map was treated by TomoView® software, developed by OLYMPUS®, in order to obtain information on the impregnation homogeneity and manufacturing defects such as resin-rich regions, voids, and fiber misalignment.
Mechanical testing: The Short-beam strength test was performed on eight specimens for each process with span-to thickness ratio (s:t) of 4:1. The procedure was performed in Shimadzu AG-X, according to ASTM D234422,28 at 0.05 mm min−1 and load cell of 5 kN.
Microscopy: Three samples of each processing were cut in 15 × 3 × 3 mm, inlaid in bakelite, sanded, and polished for microscopic observation through the Zeiss Axio Imager 72 m microscope at 100× magnification and treated by ImageJ® software. The sandpaper’s mashes were # 400, # 600, # 1200, # 1500 and #2000, with water-lubricated, and for polishing: Diamat tissues from Allied with 9, 6 and 1 µm diamond suspensions, and 0.05 µm of alumina to finish. In both processes, the load was from 8 to 15 N and rotation of 100/100 rpm.
Results and discussion
Ultrasound test
Figure 2(a) and (b) shows the results generated by ultrasound tests from RTM and CM laminate, respectively. The color gradient scale represents weave attenuation and respective defect contents along the laminate thickness. The red color (100%) symbolizes the maximum attenuation of wave incidents through the laminate and, consequently, a higher possibility of defects occurrence. On the other hand, white color (0%) means no-wave deviation, in other words, the complete return of waves emitted by the system.

C-scan attenuation maps: (a) RTM; (b) CM.
Higher homogeneity in impregnation is noted for the RTM composite mainly at the beginning of the injection area, highlighted with a red arrow. The red staining areas occurred visually with lower incidence in RTM compared with CM. Practically the entire CM laminate showed higher attenuation, mostly at the end of the plate, which could be attributed to porosity, fiber misalignment and/or resin-rich regions. The more significant attenuation or impregnation discontinuity is indicative of defect, and it is responsible for decreasing the mechanical behavior. 29 In this case, the efficiency of hand lay-up impregnation by CM was lower than the impregnation flow by RTM, which could be associated with controllable resin flow and vacuum applied during impregnation, ensuring the elimination of air trapped in preform and volatiles formed during cure reaction of the matrix in RTM.
Another essential statement to these different degrees of impregnation is associated with the capillary effect: superficial tension of carbon fiber created a capillary force. The capillary effect is shown in Figure 3, which is possible to observe at the surface of CM laminate the macro porosity formation presented in intertown of fibers (Figure 3(b)). Due to pressured injection and vacuum applied in RTM, resin velocity was higher than in CM and led to a faster resin flow inside fiber tows, where the capillary force is dominating, so it induced the formation of intratow micro voids. On the other hand, viscous force predominant in CM led to fast flow inside tow filaments inducing intertown macro voids.13,30–32
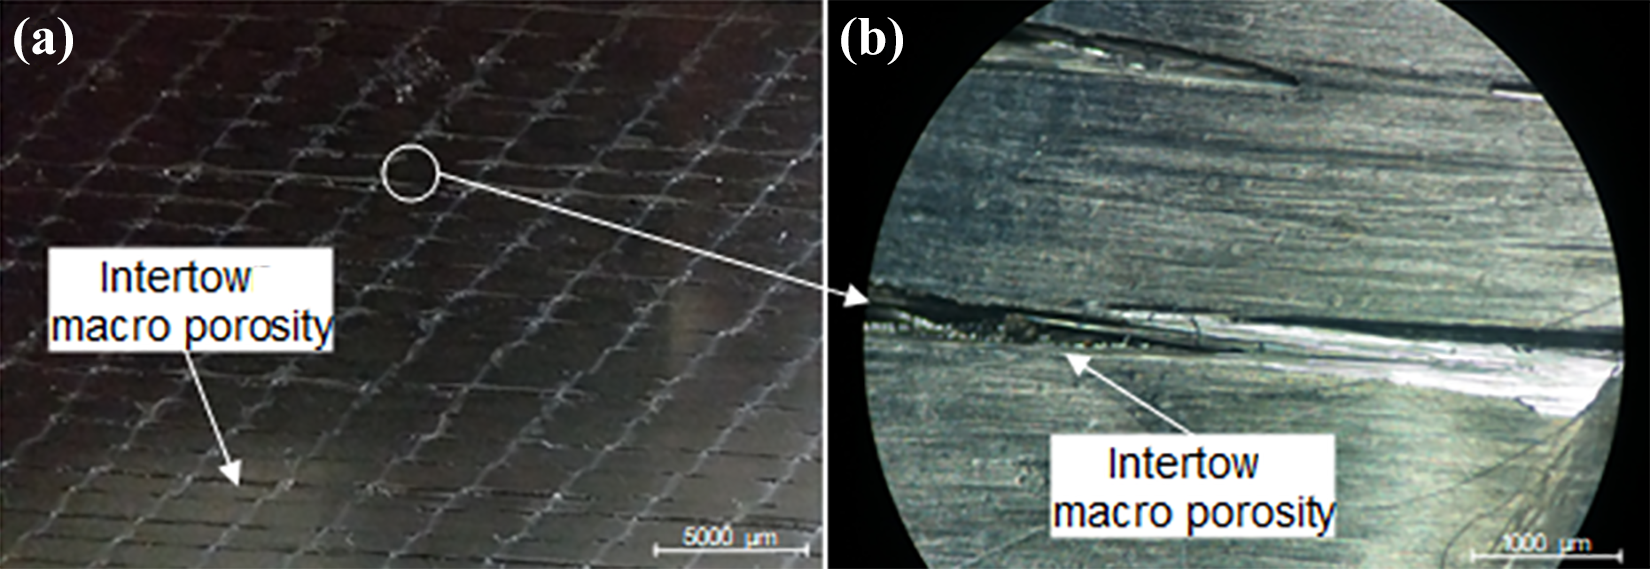
Capillary effect on the surface of CM laminate: (a) macro view and (b) intertow porosity highlight.
Short-beam strength
After the ultrasonic test, short-beam strength test was performed (Figure 4). Visually, it could be seen cracks located between layers on both RTM and CM samples as indicated with a white arrow, but it cannot be concluded that the stress state inside them was pure shear. In reason of the low ratio span-to-thickness followed by ASTM D2344 28 and higher stress concentration on the surface loading area, specimens can bend due to compressive and tensile stresses, enabling the appearance of vertical or intralayer cracks and slippage between parallel layers.33,34 The transversal distribution of tension across the samples cannot be ignored, hence the microscopic evaluation of cracks must support the discussion of this topic.

Specimen during the short-beam strength test.
Figure 5 shows the curves of load × displacement. After a sudden drop on load, the test was stopped, and each curve’s peak exhibits the maximum force supported by specimens before their sharp cracking sound. This decline of load occurred because the forces distribution from the matrix to the reinforcement was damaged in the fragile interface between two components resulting from shear stress, but this does not exclude the possibility of bending stresses acting on the samples since on Figure 4 it can be seen compressed (named C) and tensioned (indicated as T) areas indicated with the red arrows.

Curves of ILSS for (a) RTM and (b) CM.
The average short-beam strength values of the 16 specimens tested, as well as their standard deviation and coefficient of variance are shown in Table 1. As expected from impregnation quality on the ultrasound test, RTM processing was more effective in strength results, which had the same magnitude as those found in the literature, 31 also confirmed by higher peaks of load inn Figure 5. The average of axial strength supported by the samples of CM is smaller than those of RTM, and consequently, its value of σ is also smaller, differing of 10 MPa, which corresponds to a decrease of about 27% in mechanical property. The standard deviations for both processes are not very high compared with the magnitude of σ, therefore, the coefficient of variation represents the influence of results dispersion on the average values, enabling to ensure in this case that RTM data of short-beam strength is more homogeneous and shows more confidence than CM.35,36
Average values obtained after short-beam testing.

* SD—Standard deviation; CV—Coefficient of variation.
After the failure, fractography of samples was carried out, shown in Figures 6 and 7, which represent specimen transverse surface processed by RTM and CM. The images confirmed there was failure between plies of the composite, but not interlaminar shear at the midplane of the beam, in fact, besides horizontal cracks characterized as delamination, there were some points which crack propagated in 45° direction, therefore the type of failure noted cannot be considered as pure shear.
Surface of RTM specimen after mechanical test.

Surface of CM specimen after mechanical test.
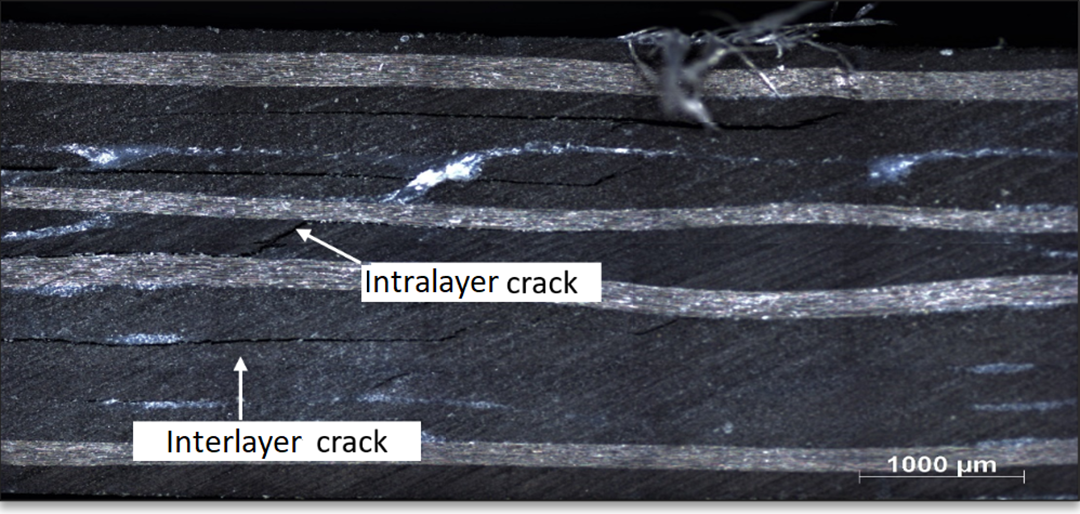
Especially for the CM process, the presence of macro porosity (Figure 8) as well as the void content of five times more than in RTM shown in Table 2 changed the crack propagation path and weakened the mechanical behavior. Furthermore, the results of C-scan map confirmed the discussion made in ultrasound results, where, according to Mouritz, 5 higher attenuation could be associate to lower mechanical properties. All of these factors corroborated to the lower strength of samples processed by CM when stress was applied, which exhibited a smaller maximum load on curves in Figure 5. Larger and distincts porosities shapes are influenced by the reinforcement position and shear crack jump during the mechanical test.

Transverse section from a specimen processed by CM.
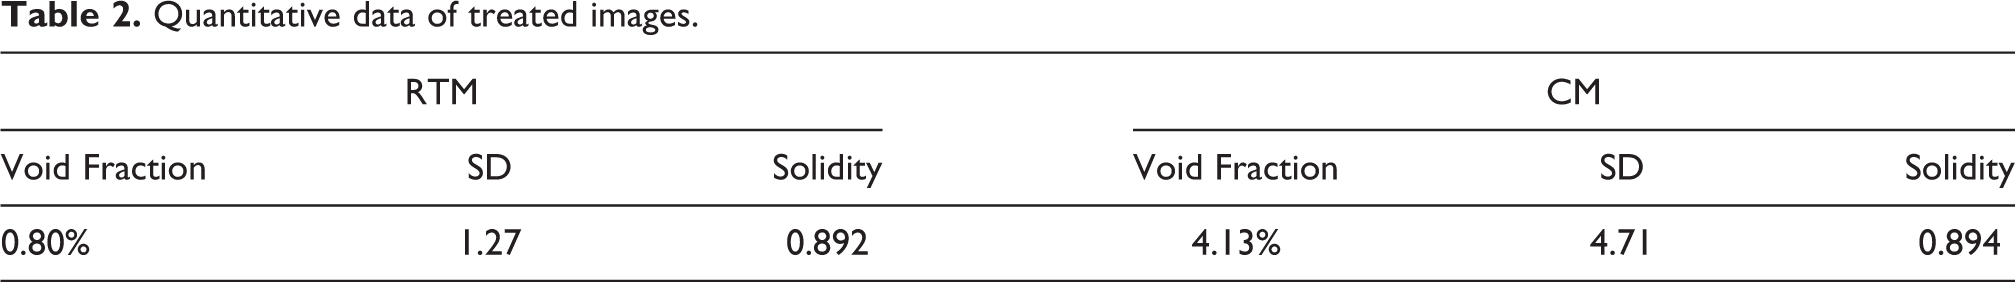
Quantitative data of treated images.
Voids act as a stress concentrator and facilitates cracking initiation and growth, decreasing substantially short-beam strength of the composite. Also, porosity induced “jumps” of planes where the crack is propagating, causing vertical cracks, which creates a connection between other shears, resulting in lower mechanical properties. 37 It is also noted some irregularities of the layers for both processes which could have been generated from the lamination process that caused problems of conformation, and it tends to have a more significant quantity of voids closer to these irregular layers due to the tortuosity of the resin through the fabric, and the impregnation becomes more difficult.
Porosity
With the software ImageJ, a surface map of the specimen was shared into 318 images’ sections and 100× ampliation for each part in order to investigate qualitatively and quantitatively the microstructure of the composite transversal faces. Before treat all sections, the entire picture of an untested sample presented in Figure 8 clearly shows the macroporosity through the thickness of CM composite. This image confirms that CM composite suffered less intension of capillary effect and more of viscous force, resulting in intertow voids due to the higher flow inside filaments. 38
The treatment of images was performed as shown in Figure 9. For quantitative analysis, each section of the image map, as shown in Figure 9(a), was treated by applying a threshold tool to highlight porosity, displaying the red color according to Figure 9(b). Thanks to this treatment, the whole area (matrix and reinforcement) were then eliminated, except for these voids, shown in Figure 9(c). Finally, each pore was quantified and given a number identification according to Figure 9(d).

Treatment of images in CM sample.
Void fraction and morphology in Table 2 are results obtained by reproducing the same step for all 636 images from both composites. According to the general theorem of stereology, void area fraction can be equated to void volume fraction, 37 and for the solidity value, which ranges from 0 to 1, the pore is considered as a circle when the measurement of circularity is closer to 1. Voids with solidity lower than 1 indicates cylindrical, elliptical, among other voids shape, which for porosity diameter was applied the average of minimal and maximal diameter, using Ferret method. 29
According to Table 2, the RTM composite presents 0.80% of VVF and, for CM, 4.13%. Hence, CM presented five times the presence of stress concentrators, compared with RTM. This statement confirms the decrease in interlaminar shear strength, highlighting RTM processing as a feasible given its processing quality (less porosity). The vacuum used in RTM may have been a differential in the void control during the entire process since it has the function of eliminating the volatiles resulting from the polymerization reaction as well as removing supposed air bubbles stuck in the system ensuring homogeneity in impregnation with a low void content.
The proximity of 1 in solidity shown the geometric shape of the found pores is mostly circular. Moreover, it was possible to measure diameters distribution represented by the histogram of pore size dispersion in frequency (%) in Figure 10. Compared with CM diameter distribution, RTM presented no significant porosity larger than 50 µm and resulted in less frequency on the rest of diameters, since this process showed five times of less porosity fraction compared with CM results.

Histogram of pore size dispersion for RTM and CM.
RTM and CM composites presented their porosity diameter concentrated until 50 µm, considered as small voids. 39 Diameter values greater than 50 µm were also found, mainly in the CM composite due to macro porosity. More significant porosity (75 to 230 µm) have lower frequency than smaller ones (8 to 50 µm), however larger size porosity demonstrated a great influence on interlaminar shear.
Conclusions
Both processes showed significant differences concerning to void volume fraction and mechanical behavior. RTM proved to be more efficient in all tests, being the most appropriate technique, exhibiting greater homogeneity in impregnation and ensuring fewer defects along the laminate. The presence of viscous force (results from impregnation velocity) and vacuum absence were crucial aspects for macro porosity formation between tows in CM laminates. Higher values of VVF and pore diameter were the reasons for the faster crack initiation and growth; besides, macro porosity could be responsible for crack jumps between different plies, causing intralayer cracks. Nevertheless, the curves of load versus displacement characterize shear stress and delamination failures, the images of the transversal section showed that other types of stresses on the samples could have acted, like bending or crushing. The use of this test was efficient to compare the quality adhesion between the components on the CFRP composites.
As a result of void formation, mechanical performance short-beam strength from RTM presented 27% of higher resistance when compared with CM, as a response of higher porosity and pore diameter for the second process, in which mechanical behavior follows linear decrease for each increment of porosity. RTM presented a satisfactory interface regulating stress distribution, the essence of macroscopic between layers and the path in which interlaminar shear failure is less prone to occur. There is a need for changes in the CM process to improve the results as the insertion of a vacuum bag, which could help eliminate some bubbles entrapped in the system by squeezing it.
Footnotes
Acknowledgments
The authors acknowledge the funding support of Governmental Agency for Research of São Paulo State/Brazil (FAPESP) and the São Paulo State University “Julio de Mesquita Filho” (UNESP).
Declaration of conflicting interests
The author(s) declared no potential conflicts of interest with respect to the research, authorship, and/or publication of this article.
Funding
The author(s) disclosed receipt of the following financial support for the research, authorship, and/or publication of this article: This work was financially supported by the Governmental Agency for Research of São Paulo State/Brazil (FAPESP) (process number 2016/07899-7 and 2017/10606-4) and the São Paulo State University “Julio de Mesquita Filho” (UNESP).