
Abstract
In the present study, dielectric and microwave absorbing properties of barium titanate (BaTiO3) and strontium ferrite (SrFe12O19) filled thermoplastic polyurethane composites were investigated. The variations of the dielectric parameters of the BaTiO3 filled composite samples with filler concentration were also modeled and simulated by the power-law model to predict dielectric coefficients of the samples for higher filler concentrations. Comparing the prediction of the Power-law model and experimental measured dielectric values indicate that the Power-law model predicts dielectric parameters of the composite with acceptable accuracy. Microwave absorption analyses of the composite samples showed that SrFe12O19 is more effective than BaTiO3 on the enhancement of microwave absorption capability of TPU. The hybrid composite samples that contained both SrFe12O19 and BaTiO3 were also prepared, and their microwave absorption performance was evaluated. It was observed that much lower RL values than that of the composite samples, which were filled SrFe12O19 or BaTiO3 could be obtained by the hybrid composites. However, absorption bandwidth of them was narrower than counterparts that contained the same amount of SrFe12O19.

Introduction
Recently, electronic products (e.g., mobile phones, personal computers and GPS) and RADAR (RAdio Detection and Ranging) systems are used for many civilian and military purposes. The increase regarding the use of these electronic products has caused many serious problems, such as electromagnetic (EM) radiation pollution and increased detectability of the plane, missile and generator. Given the serious problems encountered, the development of a material that can absorb electromagnetic waves and reduces electromagnetic radiation has attracted more attention among the researchers.
In general, a material that can absorb the energy of electromagnetic wave and minimize scattering of electromagnetic wave from its surface is called as microwave absorbing material (MAM). 1 MAMs have been used widely in many civil and military applications due to its high functionality. One of the most significant application areas of these materials is electromagnetic interferences (EMI) shielding. 2 Many of the electronic devices produce EM wave during their work and leakage of these waves into the external environment may bring about a disruptive effect for both itself and the surrounding devices. These disruptive waves are defined as electromagnetic interferences (EMI) in literature. 2 In the production process of many types of electronic equipment, they are enclosed or coated by MAMs to protect from disturbing external waves and to prevent the leakage of the own signals. Another significant application area of the MAMs is RADAR stealth technology.3,4 In general, the effectiveness of a RADAR system depends on primarily how much of the electromagnetic energy is return to the RADAR system, and this is described by the term of radar cross-section (RCS) of the target. In RADAR stealth technology, the object that is desired to hide from RADAR systems is coated by MAMs. Hence, the scattering of the electromagnetic wave from its surface is minimized, and detectability (or RCS) of the object is minimized. 3
Depending on the application area, various factors, such as thickness, effective absorption bandwidth, the absorption efficiency in a single frequency, density, cost, processability and applicability, can be effective in selecting materials to develop a MAM.3,5 For example, for an ideal MAM to be used in RADAR stealth applications, moderate absorption performance (<−10 dB) in wider frequency region, minimum plate/coating thickness and lower density are required, whereas higher absorption efficiency in a narrower frequency range and low cost can be more critical for a MAM to be used in an electronic device.
In practice, most of MAMs are prepared by the dispersion of one or more types of the metal (e.g., nickel),6,7 magnetic,8-10 carbon11-14 or dielectric fillers15,16 in polymer phases. Carbon nanotubes,17-19 graphite derivatives (e.g., graphene, graphite, expanded graphite)20,21 and carbon nanofiber 22 as carbon filler; various ferrite derivatives (e.g., magnetite, 23 barium ferrite,24,25 strontium ferrite 26 ) as magnetic fillers; barium titanate16,27 and titanium dioxide 28 as the dielectric filler are the most commonly used materials in the development of polymeric composite based MAM.
Polymer composites, including different types of magnetic particles, can deliver high absorption performance at relatively high filler contents. 29 However, high density, low processability and loss in absorption performance with time due to oxidation of metallic components, are the major disadvantages for the polymer composites. One of most commonly used ferrite derivatives is the magnetically hard hexagonal “M” ferrites, that has the general formula of MFe12O19 where the M designates Ba, Sr or Pb. Particularly strontium ferrite (SrFe12O19), which is an important ferromagnetic oxide, is preferred widely in microwave absorption applications due to its high corrosion resistance, high resistivity, high saturation magnetization and excellent chemical stability. 25
On the other hand, polymer composites that are prepared by dielectric fillers provide easy processability, low price and good absorption performance in the certain frequency region; however, their main disadvantage is narrow absorption bandwidth. Barium titanate (BaTiO3) with perovskite structure is the most used dielectric filler to design the capacitor, opto-electronic devices and polymer composite based MAMs due to their higher permittivity, good ferroelectric properties and propagation constant. 16 Considerable sustained efforts have been made to obtain wider absorption bandwidth by BaTiO3 filled polymer composites in the literature, such as doping BaTiO3 particles with different materials 30 and optimization of thickness of composite plate for the target frequency range.
In this study, thermoplastic polyurethane (TPU) based single layer composite sheets were prepared using BaTiO3 and SrFe12O19. Permittivity and permeability values with real and imaginary parts and microwave absorption performance of the composites were examined according to sample composition and applied frequency. A growing number of scientific studies is present in the relevant literature, which investigated microwave absorption properties of the BaTiO3 or SrFe19O4 filled polymer composites. However, to our knowledge, to date, in the literature, there is not any comprehensive research about simultaneous use of BaTiO3 and SrFe19O4 in a polymer composite that enable to lower reflection loss value at X-band frequency. In addition, for the first time, variation of the dielectric values of the BaTiO3 filled polymer composites with the amount of filler was modeled and simulated with high accuracy by Power-law model, which is used for modeling of rheological and electrical properties of polymer composites.
Experimental
Materials
In the preparation of the composite samples, commercial-grade polyester-based TPU (Desmopan® 3380) was used as a polymer matrix; analytical grade tetrahydrofuran (THF) was used as a solvent and also BaTiO3 (Sigma-Aldrich, 338842) and SrFe19O4 (Sigma-Aldrich, 633836) were used as fillers.
Sample preparation
The composite samples were prepared using the solution mixing method. In the preparation process, firstly, a certain amount of the filler was dispersed into THF (15 ml) and stirred with a magnetic stirrer for 6 h. Then, 3 g of TPU was also dissolved in 15 ml THF in another flask, and filler suspension was gradually added into the TPU solution. Finally, this mixture was stirred for 24 h by a magnetic stirrer with 600 rpm at ambient condition and then poured into two glass petri dishes. The dishes were left at ambient temperature and 80°C for 24 h and 3 days to evaporate the solvent. Sample notations and compositions are defined in Table 1. The filler amounts in the table were given as phr (part of filler per hundred of polymer). In the table, the verification sample (BaTiO3-300) that was prepared to verify the results of the modeling and simulation effort of the dielectric parameters also was given, however, microwave absorption performance of this sample was not evaluated. In the preparation of microwave measurement samples, firstly, the thin films were obtained using the solution mixing method. Then, a few pieces of the same sample were laminated to each other at 90°C by the compressing molding technique to obtain a self-standing plate with a thickness of ∼2 mm. Finally, the O-ring shaped test specimens with an outer diameter of 7 mm and the inner diameter of 3 mm were cut from the plate by a manual cutting press machine.
Sample codes and contents.

* This sample was prepared to verify the simulation of dielectric values of BaTiO3 series samples. Microwave absorption performance of BaTiO3-300 were not evaluated.
Measurements
Scattering parameters (S11, S12, S21 and S22) of the samples were determined by a coaxial airline sample holder (Keysight 85055AR03) equipped vector network analyzer (VNA, Keysight Fieldfox N9926A) in the frequency range 8.0–12.5. The real and imaginary part of the complex permittivity and permeability values of the samples were calculated using models that are based on the Nicholson Ross Weir (NRW) method and given in software of the measurement system (N1500–001 material measurement software).31-33 Before the measurements, firstly, full two-port calibration was performed to provide any loss due to the sample holder and other equipment. Then, dielectric coefficients of the Teflon and air were measured and compared with the literature values. 34 After obtaining similar values in line with the literature, the measurements of the samples were carried out.
Results and discussion
Dielectric properties of the samples containing a single type of filler
In the transmission line theory, the reflection and attenuation characteristics of the material are determined mainly by the frequency of applied EM wave, the thickness of the material, relative complex permittivity (ε*) and magnetic permeability (μ*) values. Although the thickness of polymeric composite based materials can be tuned precisely by different processing methods, permittivity and permeability values of these materials are the results of many structural parameters, such as electrical/magnetic properties of filler and polymer phase, dispersion quality of filler and interaction between the polymer phases and filler. The complex permittivity, which is an indicative parameter to define the behavior of the material exposed to an electric field, is given as ε* = ε′ − jε″ where ε′ and ε″ represent stored and dissipated (or lost) electrical energy. Similarly, complex permeability that is also defined as the measure of the ability to support the formation of a magnetic field within itself given as μ* = μ′ − j μ″ where μ′ and μ″ is related to the stored and dissipated magnetic energy.
Figure 1(a–b) shows the variations in ε′ and ε″ values of TPU and BaTiO3 filled composite samples in the frequency range of 8–12.5 GHz. Real (μ′) and imaginary part (μ″) of the complex permeability of the samples were taken as 1 and 0 in the entire of measurement range and not represented in Figure 1 due to the non-magnetic nature of TPU and BaTiO3.

Variation of (a) real and (b) imaginary part of the dielectric permittivity with applied frequency for BaTiO3-series samples.
In Figure 1, it is seen that ε′ values of neat TPU showed a constant value of ∼2.8 over the X-band while ε″ value showed small fluctuations between the 0.1–0.4 over the same frequency range and both of the ε′ and ε″ values are enhanced with increasing content of BaTiO3. The ε′ values of BaTiO3-20, BaTiO3-40, BaTiO3-80 and BaTiO3-120 were determined as 3.9, 5.8, 7.5 and 8.5, which are corresponding to 1.86, 2.76, 3.57, 4.04 times higher than that of neat TPU respectively at 10.03 GHz. It is also seen that ε″ values of the samples for 10.03 GHz enhanced 3.01, 3.6, 9.83 and 13.76 times according to that of neat TPU by addition of 20, 40, 80 and 120 phr of BaTiO3, respectively. According to electromagnetic theory, dielectric losses in a material are the result of the different mechanism, such as natural resonance, dipole-dipole interactions, polarization and relaxation of charge carriers, the polarization of polarons and bipolarons in the composite structures. 35 Among them, dipole-dipole interaction (polarization and relaxation) can be supposed as one of the primary loss mechanism for the BaTiO3 filled polymer composite.36,37 In this mechanism, the dielectric filler and interface between the filler and polymer matrix are polarized when an electromagnetic wave is applied to the sample. Thus, the energy of the EM wave can be stored in the composite structure. On the other hand, the stored energy in dielectric filler and filler/polymer interface is lost as heat by the relaxation of polarized structures when the applied electromagnetic wave is removed. Accordingly, as expected, increasing the BaTiO3 content in the composite caused a smaller distance between inclusions that led to more effective dipole interactions, higher charge storage capability (ε′) and dielectric loss (ε″) in the composite system.
To investigate the potential effects of filler concentration on dielectric parameters more clearly, variations of ε′ and ε″ values with filler concentration were summarized in Figure 2(a–b) for the frequency of 10.03 GHz that was very close to the center frequency of X-band. As expected, it was observed that both ε′ and ε″ values increased with filler concentration, but it was interesting to find out that the increasing trend changed at the filler concentration of 40 phr. Such that ε′ values of the composites increased exponentially up to filler concentration of 40 phr, while it increased logarithmically above this filler concentration. Similarly, ε″ values also showed two different logarithmic increasing trends at the lower and higher filler concentration of 40 phr. Both of the figures that present the variation of the two dielectric constants with filler concentration can be used to investigate the causes of change in the increasing trend. However, only ε′ values was used to investigate the potential effects of filler concentration in this study because ε″ values showed considerable frequency-dependent character as indicated in Figure 1(b) particularly for the TPU and the composite samples containing a lower amount of filler.

Variation of (a) real and (b) imaginary part of the dielectric permittivity with amount of filler for BaTiO3-series samples.
Considering the relative improvements in ε′, it was observed that the most significant increase in relative ε′ values could be achieved at 40 phr of filler concentration, and this increase was gradually decreased above this filler concentration. This behavior of the ε′ values could be attributed to physically and/or dielectrically percolation of the BaTiO3 particles about 40 phr. Theoretically, physical percolation threshold is defined as the formation of a three-dimensional network by fillers 38 and it can be assumed that agglomeration of the fillers became more effective above this critical filler concentration, such that increasing rate of filler/polymer interface area in that polarization and relaxation movements occurred decreased for unit addition of BaTiO3 particles. To investigate the increasing trend more quantitatively and predict the behavior of dielectric parameters with BaTiO3 content, according to physical percolation theory, the ε′ and ε″ values were modeled.
In the relevant literature, many models are reported to define the relationship between the dielectric parameters of the composites and the filler content.39,40 However, almost all of the models predict the dielectric coefficients of the composite increase exponentially with dielectric filler content. Therefore, in contrast to many studies in the literature,39-41 in this study, power-law model that was based on percolation theory was applied to experimental ε′/ε″-filler concentration graphs to define the relationship of ε′ and ε″ with filler concentration. The power-law model has been widely used in the literature to define the behavior of rheological or electrical properties of the polymer composite and determine electrical or rheological percolation thresholds.42,43 The modified formula of the power-law model for dielectric coefficient can be given as

where ϕ, ϕc and t are volume fraction of the filler, the percolation threshold and exponent factor, respectively. In addition, A and B were coefficients which are related to ε′ and ε″, respectively. As can be understood from the equation, the model can be used for higher filler concentration than percolation thresholds. Accordingly, the calculated parameters of the power-law equation and the consistency of the modeling results were given in the modeling section of Figure 3(a–b). Figure 3 illustrates that the power-law model successfully fitted the experimental data for both ε′ and ε″ values. It is also noted that the exponent factor (t) which varied between 1.3–3 according to physically percolation threshold 42 was so lower than expected. This may arise from the fact that the electromagnetic wave did not require the physical contact of BaTiO3 particles to propagate in the composite medium and can polarize the polymer phase at a lower filler concentration.

Modeling and simulation of the (a) real and (b) imaginary part of the dielectric permittivity for BaTiO3-series samples.
Simulation of the curves was performed to predict the variations in ε′ and ε″ values with filler concentration up to 300 phr (75% wt.) using previously obtained model parameters. A control sample whose BaTiO3 concentration was 300 phr was also prepared, and its dielectric coefficients were determined experimentally to verify the prediction of the used simulation technique. Dielectric parameters of the control sample were determined experimentally as ε′ = 9.75 and ε″ = 4.62. The predictions and experimental measured dielectric parameters of the control sample were given in the simulation sections in Figure 3(a–b). The results indicated that the dielectric values of the control sample could be predicted with acceptable accuracy by simulation of the power-law model.
The complex permittivity and permeability values of SrFe series samples are depicted in Figure 4(a–d). The variation of the ε′ values in Figure 4(a) indicated that all of the composite samples showed a bit of lower ε′ values than that of TPU in the same frequency due to the non-capacitance property of SrFe and the disruptions in the polarizability of polymer phases.14 In Figure 4(b), it is seen that ε″ values of the SrFe-20 and SrFe-40 were almost the same with that of TPU, while SrFe-80 and SrFe-120 had higher ε″ values than TPU. In addition, ε″ values of TPU, SrFe-20, and SrFe-40 showed almost independent behavior from frequency, while ε″ values of SrFe-80 and SrFe-120 decreased with frequency, the SrFe-80 had almost same ε″ values with TPU in the frequency range of 11.5–12.5 GHz. In the literature, decreasing of permittivity values with the frequency has been attributed to the inability of the vibration movements in the material to respond increasing frequency.44,45 The parameter ε″ was used to calculate the electrical conductivity (σ) or ac-conductivity value of materials under alternating current according to the following equation; Variation of (a) ε′ (b) ε″ (c) μ′ and (d) μ″ values with applied frequency for SrFe-series samples.

where f is the frequency and ε0 is the permittivity value of free space or vacuum permittivity (8.854 × 10⁻¹² F/m). In general, it can be supposed that strontium ferrites have a bit of higher electrical conductivity than most of the polymers whose conductivity is about 10−12 S/cm. 46 In this concept, an increasing trend of ε″ values with filler concentration could be attributed to higher ac-conductivity (or ε″) values of strontium ferrite powder. As shown in Figure 4(c–d), the µ′ values of the composites increased with filler concentration, as expected due to the magnetic nature of SrFe. The µ′ values of the SrFe-20, SrFe-40, SrFe-80 and SrFe-120 for 10.03 GHz were determined as 1.27, 1.8, 2.20 and 2.75 respectively. Similarly, the µ″ values of the composites also increased with filler concentration, and the µ″ values of the SrFe-20, SrFe-40, SrFe-80 and SrFe-120 for 10.03 GHz were determined as 0.25, 0.84, 1.15 and 1.35, respectively. The µ″ is often used to indicate the magnetic loss properties of materials and it is determined by magnetic hysteresis, eddy current effect, domain-wall resonance, exchange resonance and natural resonance.36,47,48 Considering the weakly applied magnetization field during the electromagnetic measurement, magnetic hysteresis may be neglected. The eddy current effect can also be ignored due to the low conductivity of magnetic materials. The domain-wall resonance was reported to take place in the MHz range and can be excluded. Thus, it can be said that the magnetic loss of the SrFe series composite is mainly arising from the exchange resonance and natural resonance.
Reflection loss (RL) analyses of the samples containing a single type of filler
The microwave absorption capability of the samples was evaluated using the Reflection Loss (RL) parameter within the frequency range of 8–12.5 GHz. RL that expressed in decibel (dB) unit is a logarithmic quantity and used to define the amount of dissipated energy of electromagnetic wave inside the material. The RL values of the samples were calculated according to equation 3, which is based on the impedance values of free space and air-material interface.49,50

In the equation Z0 is the impedance value of free space (≈377 Ω) and Zi is the input impedance at the air-material interface and it is calculated as equation 449,50;

where t is the thickness of the specimen, ηk is the intrinsic wave impedance, ZL is the load impedance of a perfect electric conductor (ZL = 0), and β is a parameter about the propagation of EM wave. The parameter β is expressed as49,50;

where µ0 and µr are the vacuum and relative permeability values, respectively. In general, a material with RL values below the −10 dB whose means that it can absorb 90% of the wave energy, can be supposed as microwave (or radar) absorbent material, while it is regarded as an excellent absorber when its RL value is lower than −30 dB. Another crucial parameter about the determine performance of MAMs is effective absorption frequency range (EAFR) which means that the frequency range in which RL values are lower than −10 dB. In scientific studies and industrial applications, the EAFR that covers the entire target frequency range and the lowest possible RL values are desired for an ideal MAM.
On the other hand, according to equation 3–5, both of these performance parameters were determined by permittivity, permeability and thickness of the sample and frequency of the applied electromagnetic wave. Therefore, sample thickness also should be considered, besides the permittivity and permeability values, to determine the best performance condition of the sample at the target frequency. Thus, variations in the RL values of the BaTiO3 filled composite samples with changing of sample thickness and applied frequency were given as a counter map in Figure 5. In Figure 5, it is seen that the microwave absorption capability of the samples increased with BaTiO3 content, as expected. For example, the sample of BaTiO3-20 and BaTiO3-40 did not have considerable RL values (<−10 dB) in the thickness range of 0.5–5 mm, while RL values lower than −10 dB could be obtained by BaTiO3-80 and BaTiO3-120 in the thickness range of 2.5–4 mm. The minimum reflection losses (RLmin) of BaTiO3-80 and BaTiO3-120 were determined as −15.78 and −28.25 dB at 12.44 GHz for the thickness of 2.45 and 2.3 mm, respectively. The broadest EAFR was also determined as 10.08–12.5 (2.42) GHz and 8.93–12.5 (3.57) GHz for the sample of BaTiO3-80 and BaTiO3-120 with the thickness of 2.78 and 2.68 mm, respectively.

Counter map of BaTiO3-series samples.
Counter map of the SrFe series samples was also given in Figure 6. In Figure 6, it is seen that RL values could be improved with magnetic SrFe content and sample thickness. In addition, there were no lower RL values than −10 dB for the sample of SrFe-20 in the thickness range of 0.5–5 mm, while SrFe-40 with higher thickness than 4.5 mm, showed lower RL values than −10 dB in the frequency range of 9.2–12.5.
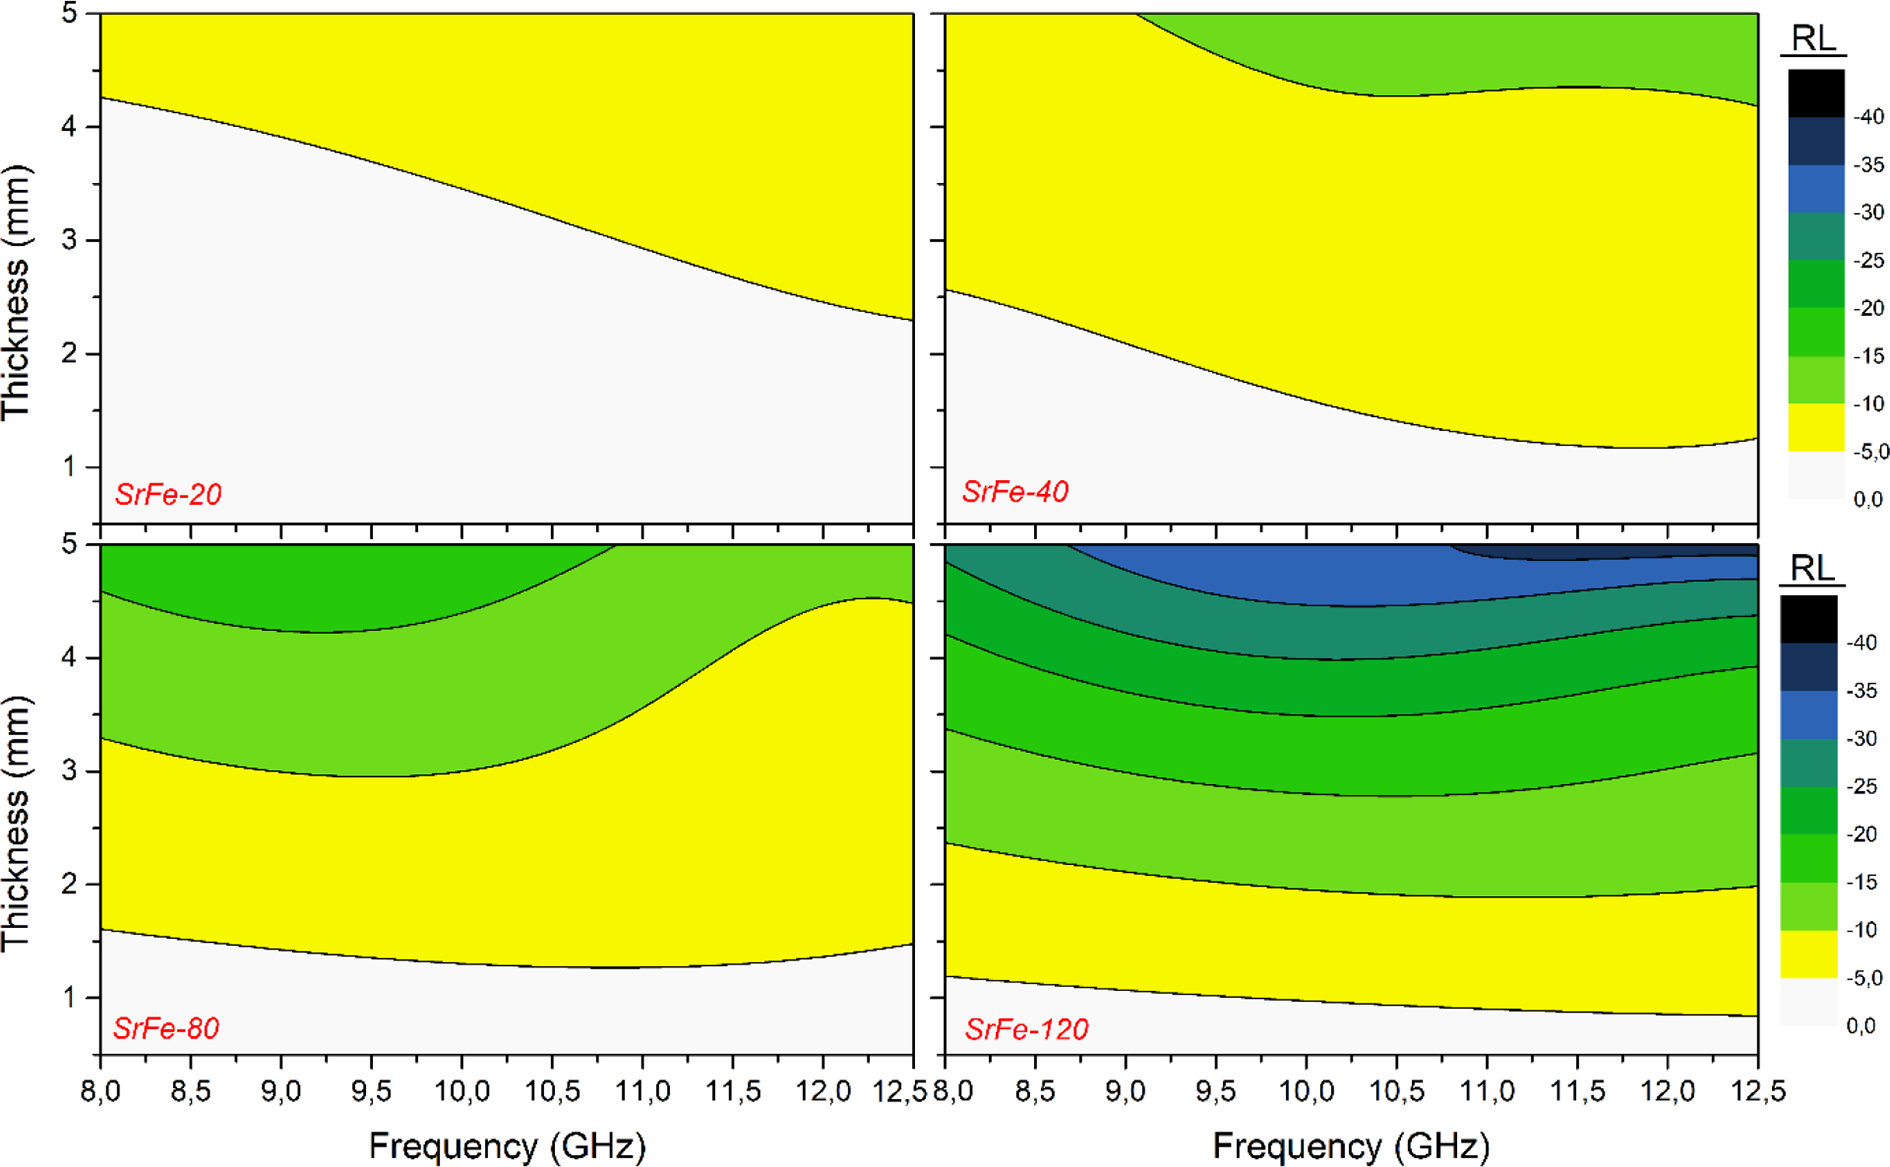
Counter map of SrFe-series samples.
Furthermore, lower RL values than −10 dB could be obtained in the all measurement range by SrFe-40 and SrFe-80 with the minimum sample thickness of 4.5 and 2.3 mm, respectively. As presented in Figure 6, RLmin values of the SrFe-20, SrFe-40, SrFe-80 and SrFe-120 with the thickness of 5 mm were determined as 8.7 dB (@12.5 GHz), −11.48 dB (@12.5 GHz), 19.44 dB (@9.19 GHz) and −37.39 dB (@11.6 GHz), respectively.
Dielectric properties of hybrid composite samples
The permittivity and permeability values of hybrid composite samples were depicted in Figure 7(a–d). In Figure 7, permittivity and permeability values of some composite samples that contained one type of filler was also given to compare the effects of the dual filler phase. In addition, µ′ and µ″ values of the samples had no magnetic properties, such as TPU and BaTiO3 series samples, were given as 1 and 0 respectively in the entire of the measurement range.
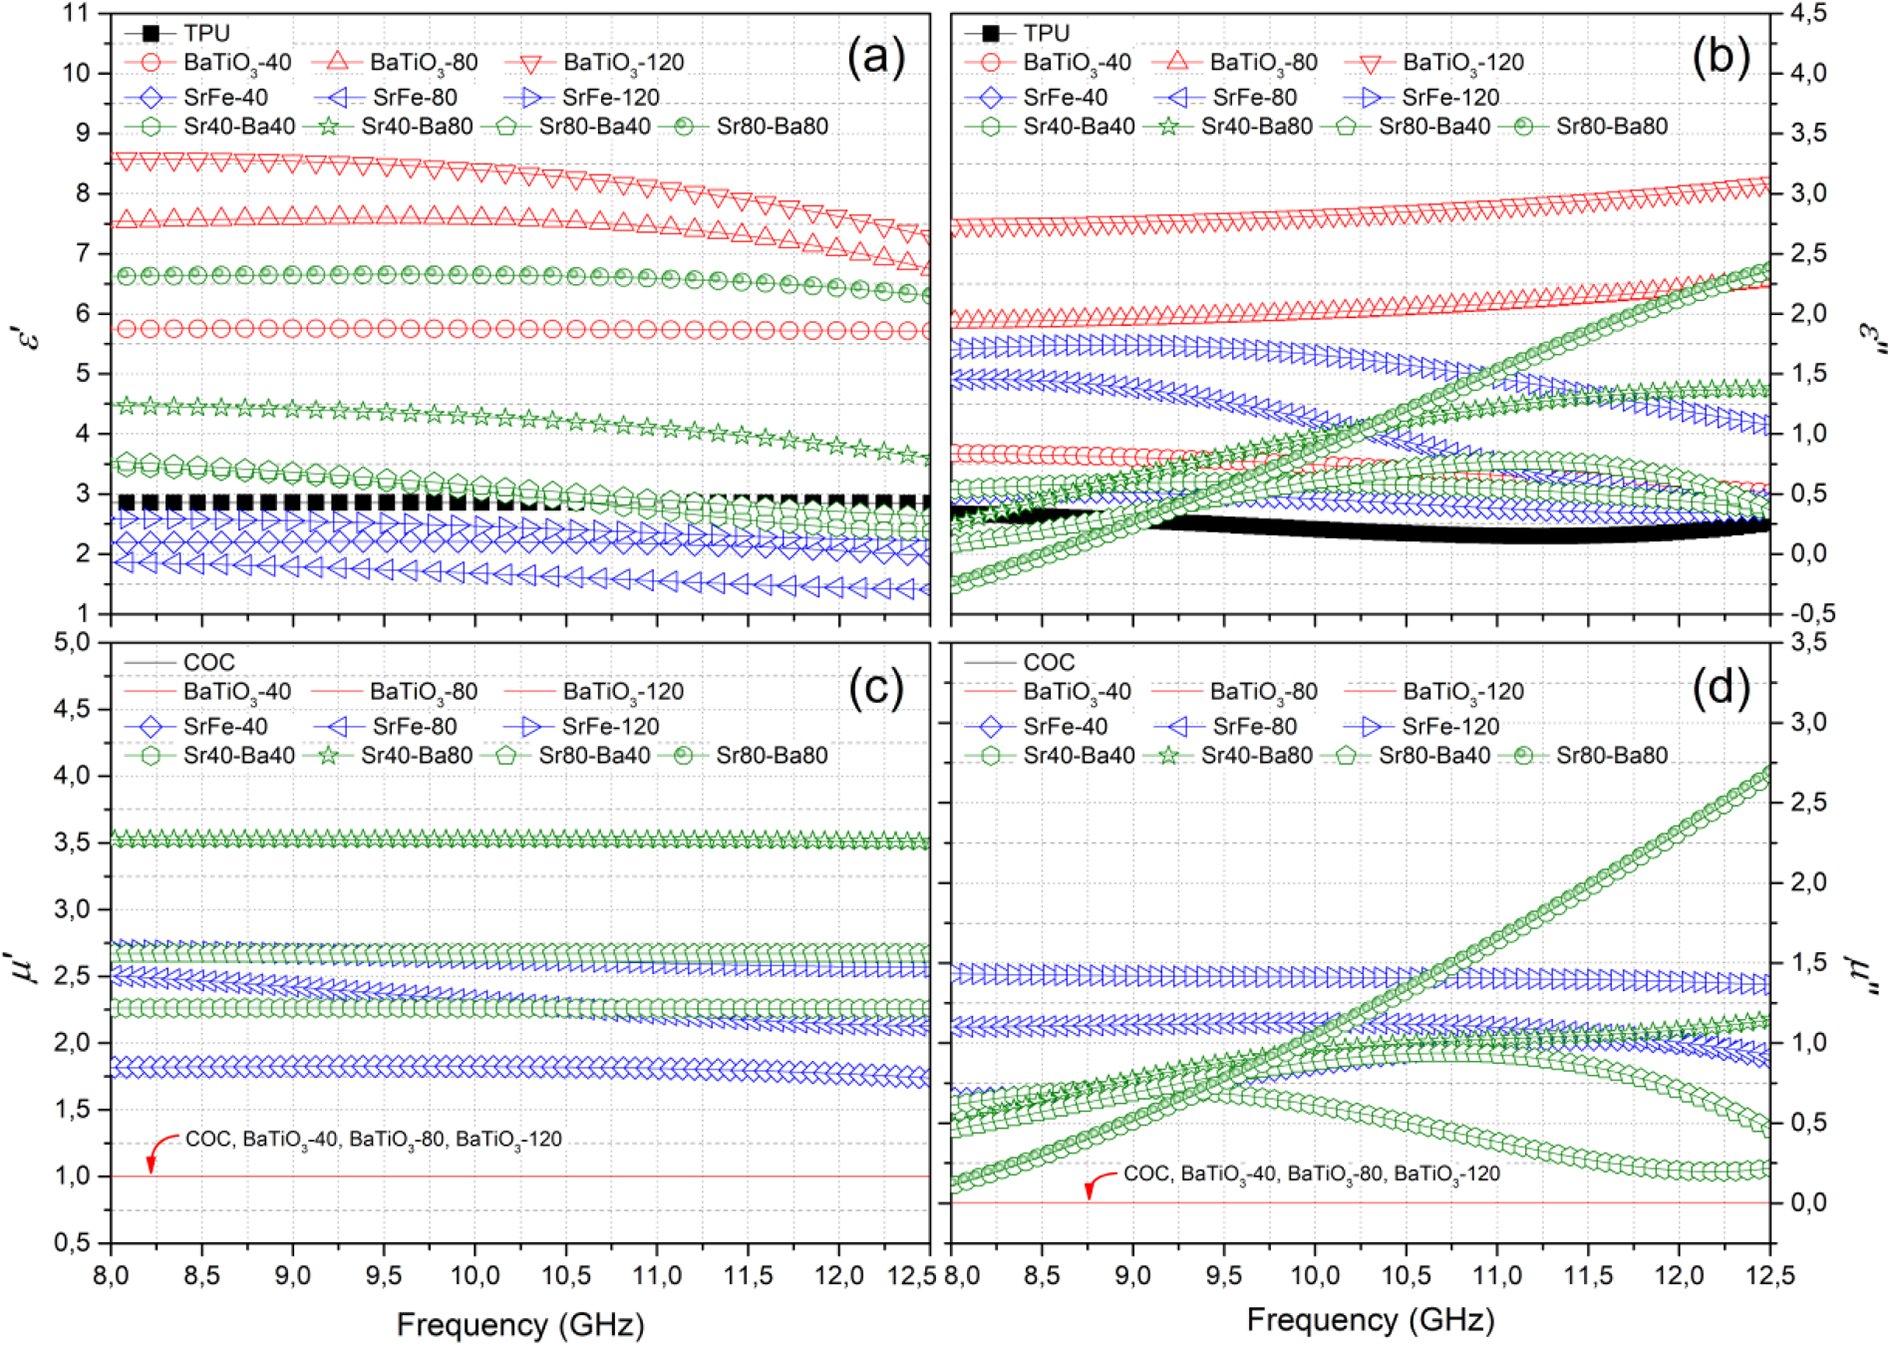
Variation of (a) ε′ (b) ε″ (c) μ′ and (d) μ″ values with applied frequency for hybrid composite samples.
As presented in Figure 7(a), ε′ values of composite samples were ordered as
In Figure 7(c), it is seen that µ′ values of composites were also ordered as
Finally, in Figure 7(d), it is seen that µ″ values of SrFe series samples showed independent behavior from frequency, while that of hybrid samples fluctuations with frequency. It is also interesting that the µ″ values of hybrid composite samples that contained 20 and 40 phr of BaTiO3 showed a decreasing tendency with frequency, while hybrid composite samples that contained 80 and 120 phr of them had an increasing trend with frequency. From the results reported above, it could be concluded that the use of BaTiO3 and SrFe in single filler phases, simultaneously, caused a synergistic effect on the improvement of µ″ values at higher frequency region in case of BaTiO3 concentration was higher than 40 phr. Since BaTiO3 had no magnetic properties, it is thought that the changes in the permeability values were also due to the microstructural changes in the composite structure as previously reported.
Reflection loss (RL) analyses of hybrid composite samples
Variation in the RL values of the hybrid composite samples with frequency and sample thickness were presented in Figure 8 as a counter map. In Figure 8, it is seen that the sample of Sr40-Ba40 did not have a considerable absorption capability in all of the measurement range. However, SrFe-40 had lower RL values than −10 dB in the same range in Figure 6. Similarly, it is seen that the sample of Sr80-Ba40 showed poorer absorption performance than SrFe80. Such that, RLmin and EAFR of Sr80-Ba40 are determined as −9.59–12.44 (2.85) GHz and 16.38 (@11.4 GHz) while to that of SrFe80 were determined as 8.5–12.5 (4) GHz and 19.44 dB (@9.19 GHz), respectively. The results indicated that use of SrFe and BaTiO3 in a single composite sample deteriorated the absorption performance when BaTiO3 concentration was 40 phr.

Counter map of the hybrid series samples.
On the other hand, RLmin of Sr40-Ba80 and Sr80-Ba80 were determined as −29.45 dB (@12.44 GHz and for the thickness of ∼5 mm) and −56 dB (@11.98 GHz and for the thickness of ∼3 mm). In addition, EAFR of the samples were determined as −8.80–12.5 (d = ∼5 mm) GHz and 9.65–12.5 GHz (d = ∼5 mm) for Sr40-Ba80 and Sr80-Ba80, respectively. Comparison of the performance parameters of the hybrid composite with counterparts that contained the same amount of SrFe indicated that incorporation of BaTiO3 at the higher than 40 phr enhanced RLmin value significantly. However, it was seen that it did not have a considerable positive effect on the EAFR, such that EAFR of SrFe-80 was wider than that of Sr80-Ba80. Obtained microwave absorption performance parameters of all composite samples were summarized in Table 2 to be more comparable.
Performance parameters of the samples.

d: sample thickness in mm.
Conclusion
In this study, dielectric and microwave absorbing properties of BaTiO3 and/or SrFe12O19 filled thermoplastic polyurethane composite were investigated using the coaxial airline method in the frequency range of 8.0–12.5 GHz. The permittivity, permeability and reflection loss analyses of the composite samples showed that both of the fillers were effective when filler concentration was higher than 40 phr. BaTiO3-20 and BaTiO3-40 had no considerable RL values (<−10 dB) in the thickness range of 0.5–5 mm, while RL values lower than −10 dB could be obtained by BaTiO3-80 and BaTiO3-120 in the thickness range of 2.5–4 mm. The RLmin and broadest EAFR were also determined as 28.25 dB and 8.93–12.5 (3.57) GHz for the sample of BaTiO3-120. On the other hand, lower RL values than −10 dB could be obtained in the all measurement range by SrFe-80 and SrFe-120 with the minimum sample thickness of 4.5 and 2.3 mm, respectively. Minimum obtained RL values of the SrFe-120 with a thickness of 5 mm were also determined as −37.39 dB (@11.6 GHz). Finally, hybrid composite samples that contained both SrFe12O19 and BaTiO3 at different concentrations were prepared to obtain higher absorption performance. Experimental results indicated that lower RL values could be obtained by hybrid composite samples with a lower thickness in case filler concentration of the BaTiO3 and SrFe12O19 were higher than 40 phr. RLmin of Sr80-Ba80 was determined as −56 dB (@11.98 GHz and for the thickness of ∼3 mm). However, reflection loss analysis of the hybrid composites also showed that simultaneous use of SrFe12O19 and BaTiO3 did not have any positive effects on the EAFR values.
Footnotes
Declaration of conflicting interests
The author(s) declared no potential conflicts of interest with respect to the research, authorship, and/or publication of this article.
Funding
The author(s) received no financial support for the research, authorship, and/or publication of this article.