
Abstract
Intercalated and exfoliated nanocomposites of insulating polymers poly methyl methacrylate and acrylonitrile butadiene styrene with organically modified montmorillonite (OMMT) was prepared by solution casting method. Formation of polymer nanocomposites was confirmed by X-Ray Diffraction. Fourier transform infrared spectroscopy confirmed the interaction between polymers and cations on the surface of OMMT layers. Dielectric properties of these nanocomposites were examined at room temperature in the frequency range of 100 Hz–1 MHz. The findings of dielectric measurements exhibited higher real and imaginary dielectric permittivity values for exfoliated nanocomposites and lesser real and imaginary dielectric permittivity values for intercalated nanocomposites as compared with pure polymers in the same frequency range. The increase in the permittivity values is attributed to Maxwell Wagner polarization in exfoliated nanocomposites because of increased interfacial area between polymer and the clay layers. Decrease in dielectric permittivity in intercalated polymer nanocomposites is attributed to restricted mobility of polymer chains due to nanoscopic confinement of the polymer with the silicate layers.
Introduction
Polymer montmorillonite nanocomposites exhibit outstanding properties as compared to pure polymers. 1 Polymer clay nanocomposites are prepared by mixing nanoscale clay particles with polymer. Different methods are used for this purpose which includes In-situ polymerization, melt intercalation and solution intercalation methods. 2- 4
There are two types of microstructures in polymer nanocomposites, intercalated and exfoliated. In an intercalated microstructure, extended polymer chains reside between the silicate layers that are typically separated by 10–40 Å. Intercalation results in well-ordered multilayered structure with alternating polymer/inorganic layers. In an exfoliated microstructure the silicate layers are randomly dispersed in a continuous polymer matrix. Well exfoliated/intercalated polymer nanocomposites have improved thermal stability, chemical stability, mechanical properties and solvent resistance. 5- 8 These high-performance properties of polymer/clay nanocomposites together with their dielectric properties can be most favorable in many high temperatures and high-pressure dielectric applications. It is, therefore, important to study the nanostructure of exfoliated and intercalated polymer/clay nanocomposites with reference to their dielectric behavior. In this work the interaction of industrial grade polymers with different weight percentage of organically modified clay has been studied with special reference to the effect nanostructure on the dielectric properties of polymer/clay nanocomposites.
Experimental details
Methods and materials
Two industrial grade polymers namely poly methyl methacrylate (PMMA) and acrylonitrile butadiene styrene (ABS) were used which were obtained in the form of pellets. The nano clay used was organically modified Southern Clay Product MMT 10A.
Sample preparation
For each polymer a set of polymer/clay nanocomposites was prepared with 0, 2, 5 and, 10% clay by weight. Appropriate weights of 10A clay were mixed with chloroform and stirred for about 1 h before adding the polymer into the mixture. Homogeneous mixing of the polymer and the clay was achieved by magnetic stirring for approximately 5 h. Films of polymer nanocomposites were obtained by drying the mixture in a vacuum oven at 60°C.
Measurements
Different techniques were used to study these samples which include X-ray diffraction (XRD), Fourier transform infrared spectroscopy (FTIR) and dielectric measurements. XRD patterns were obtained in the range of 2θ (2–20°) by using Panalytical X’ Pert PRO equipped with Cu Kα radiations (λ = 1.5406 Å), working voltage 40 kV and working current 30 mA. FTIR spectra were recorded on a Perkin-Elmer FT-IR spectrometer. Dielectric properties were examined Using Wayne Kerr LCR meter bridge (WK4275).
Results and discussion
X-ray structure of polymer/clay nanocomposites
Figure 1 gives the XRD data for PMMA and PMMA/OMMT nanocomposites. The results show that, PMMA/OMMT nanocomposites for 2 wt% OMMT and 5 wt% OMMT loading OMMT is exfoliated and dispersed randomly in PMMA matrix. But for PMMA/OMMT nanocomposite with 10 wt% OMMT loading PMMA intercalates into the silicate galleries by increasing d-spacing from 18.3 Å to 26.6 Å (difference = 8.3 Å). The increase in d-spacing is in good agreement with the values reported in literature. 9
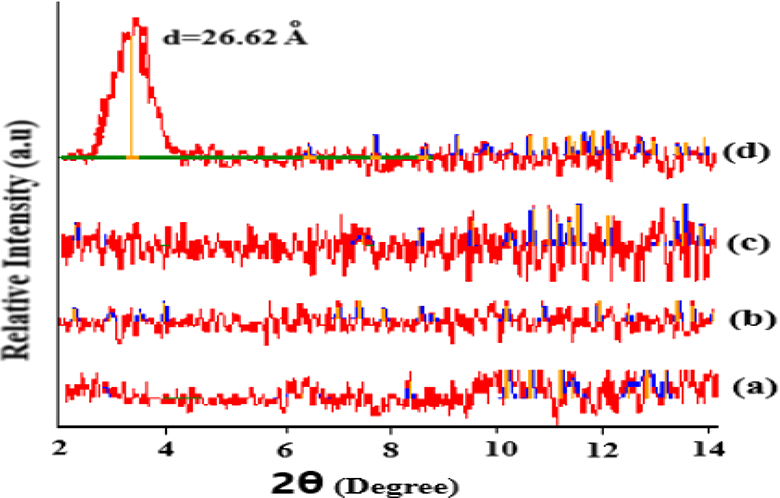
XRD pattern for (a) pure PMMA, (b) PMMA/2 wt% OMMT, (c) PMMA/5 wt% OMMT, and (d) PMMA/10 wt% OMMT nanocomposites.
Figure 2 shows XRD results for ABS and ABS/OMMT nanocomposites. These results show that in ABS/OMMT nanocomposite with 5 wt% of OMMT, ABS is intercalated between the silicate galleries by increasing d-spacing of silicate layers from 18.3 Å to 25.4 Å (difference 11.1 Å) and ABS/OMMT nanocomposites for 2 wt% OMMT loading, OMMT is exfoliated and dispersed randomly in ABS matrix.

XRD results for (a) pure ABS, (b) ABS/2 wt% OMMT and (c) ABS/5 wt% OMMT nanocomposites.
These results indicate the lower efficiency of OMMT dispersion with increasing OMMT content. When OMMT concentration in the nanocomposites increased from 1 to 10 wt%, the morphology of the nanocomposites changed from fully exfoliated to intercalated. According to Ray and coworkers 10 in their review, the d-spacings between the layers in nanocomposites depend on silicate loading. The higher the silicate content, the more difficult it is to obtain complete exfoliation.
FTIR spectroscopy of polymer/clay nanocomposites
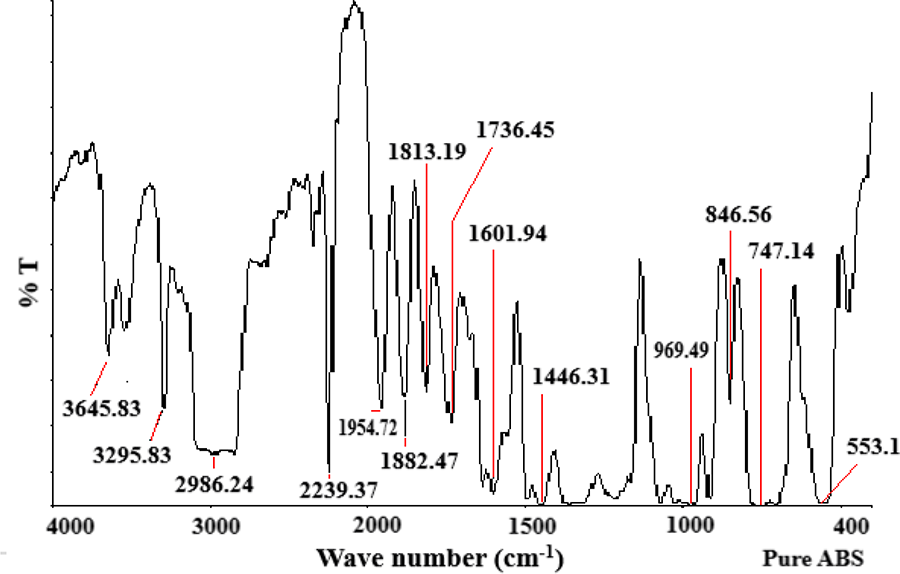
Figures 3 to 5 show FTIR results for PMMA and their nanocomposites with different weight percentages of OMMT loading. All the characteristic peaks of PMMA are found in FTIR spectra of PMMA. As it can be observed in Figure 3, pure PMMA has the carbonyl stretching mode at 1732 cm−1. 11 However, when PMMA is mixed with OMMT, the carbonyl stretching band is widened (Figures 4 and 5) and shifted to lower frequencies of 1714 cm−1 in case of 5 wt% of OMMT nanocomposites and to 1716 cm−1 for 10 wt% OMMT loading. This is indication of interaction, which is observed when carbonyl containing compounds are adsorbed with clay minerals. 12 This interaction may result either from direct bonding of C=O group of PMMA to the ammonium cations on clay surface or from the bonding of C=O group to ammonium cations through a water molecule bridge (i.e., a hydrogen bond). In the later case water acts as dielectric between carbonyl group and ammonium cations. In our case, since most of the cations in OMMT (10A) have been exchanged with N+ surfactant, the interaction is most likely due to the former effect i.e. because of direct bonding of PMMA carbonyl groups to the ammonium cations on the OMMT surface.

FTIR spectrum for pure PMMA.

FTIR spectrum for PMMA/OMMT (5 wt% OMMT) nanocomposite.

FTIR spectrum for PMMA/OMMT (10 wt% OMMT) nanocomposite.
Figures 6 to 8 give FTIR results for pure ABS and ABS nanocomposites with OMMT. All the characteristic peaks corresponding to the different groups in ABS are found in FTIR spectra of ABS. Pure ABS has a peak at 553 cm−1 which is broadened in ABS nanocomposite with 2 wt% OMMT and 5 wt% OMMT and shifts to 571 cm−1 (Al–O stretching) due to overlapping of the peak of OMMT in the same region which shows interaction of OMMT with ABS. Moreover, the area under the curve below 500 cm−1 is increased in Figures 7 and 8 (ABS/OMMT) as compared to Figure 6 (Pure ABS). This area contains characteristics peaks for OMMT. 13,14 This indicates that ABS/OMMT nanocomposites are formed.
FTIR spectrum for pure ABS.

FTIR spectrum for ABS/OMMT (2 wt% OMMT) nanocomposite.
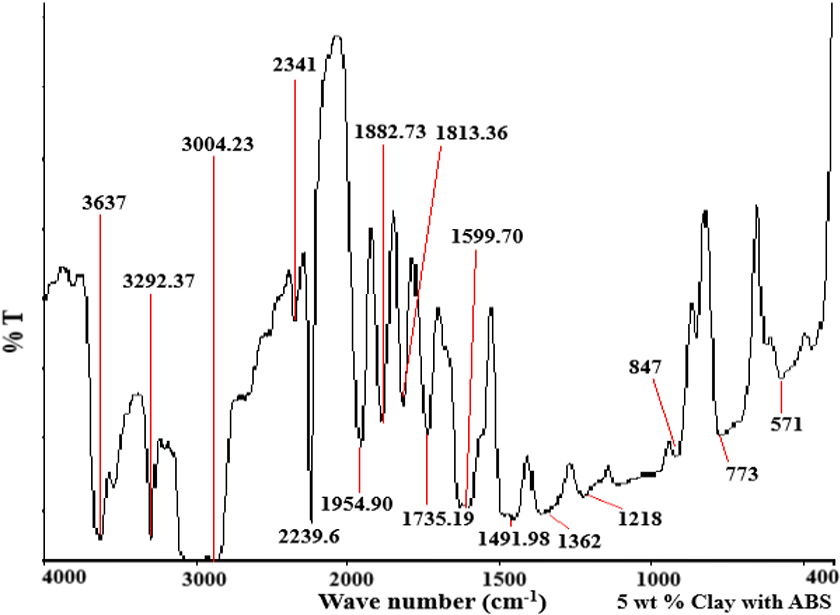
FTIR spectrum for ABS/OMMT (5 wt% OMMT) nanocomposite.
Dielectric results of polymer/clay nanocomposites
Dielectric properties of PMMA/OMMT and ABS/OMMT nanocomposites were examined using Wayne Kerr LCR meter bridge (WK4275) over frequency range of 100 Hz–1 MHz. Capacitance (C) and dissipation factor (D) were recorded simultaneously.
The dielectric constant (ε′) was calculated using the relation. ε′ = Cd/ε0A,
15
where “d” is thickness of sample pellet, “A” is the area of sample occupied between the plates of capacitor and
Figures 9 and 10 show frequency dependence of ε′ and ε″ at room temperature for different polymers and their nanocomposites. In all the cases, both ε′ and ε″ decrease with frequency without any discernible loss peak. Such a featureless increase in permittivity with the decrease of frequency at low frequencies has been observed in many materials containing free or bound charges. 16 At low frequencies, dipolar species or mobile charges present in the materials get enough time to give polarization in phase with the applied electric field which results in high dielectric constant values at low frequencies. At higher frequencies these polarizations can not remain in phase with the applied electric field which results in low dielectric constant values at higher frequencies. In case of insulating polymers which lack an appreciable number of mobile charges and have very low conductivity due to impurities, the frequency dependent dielectric permittivity is dominated by reorientation of molecular dipoles. 17
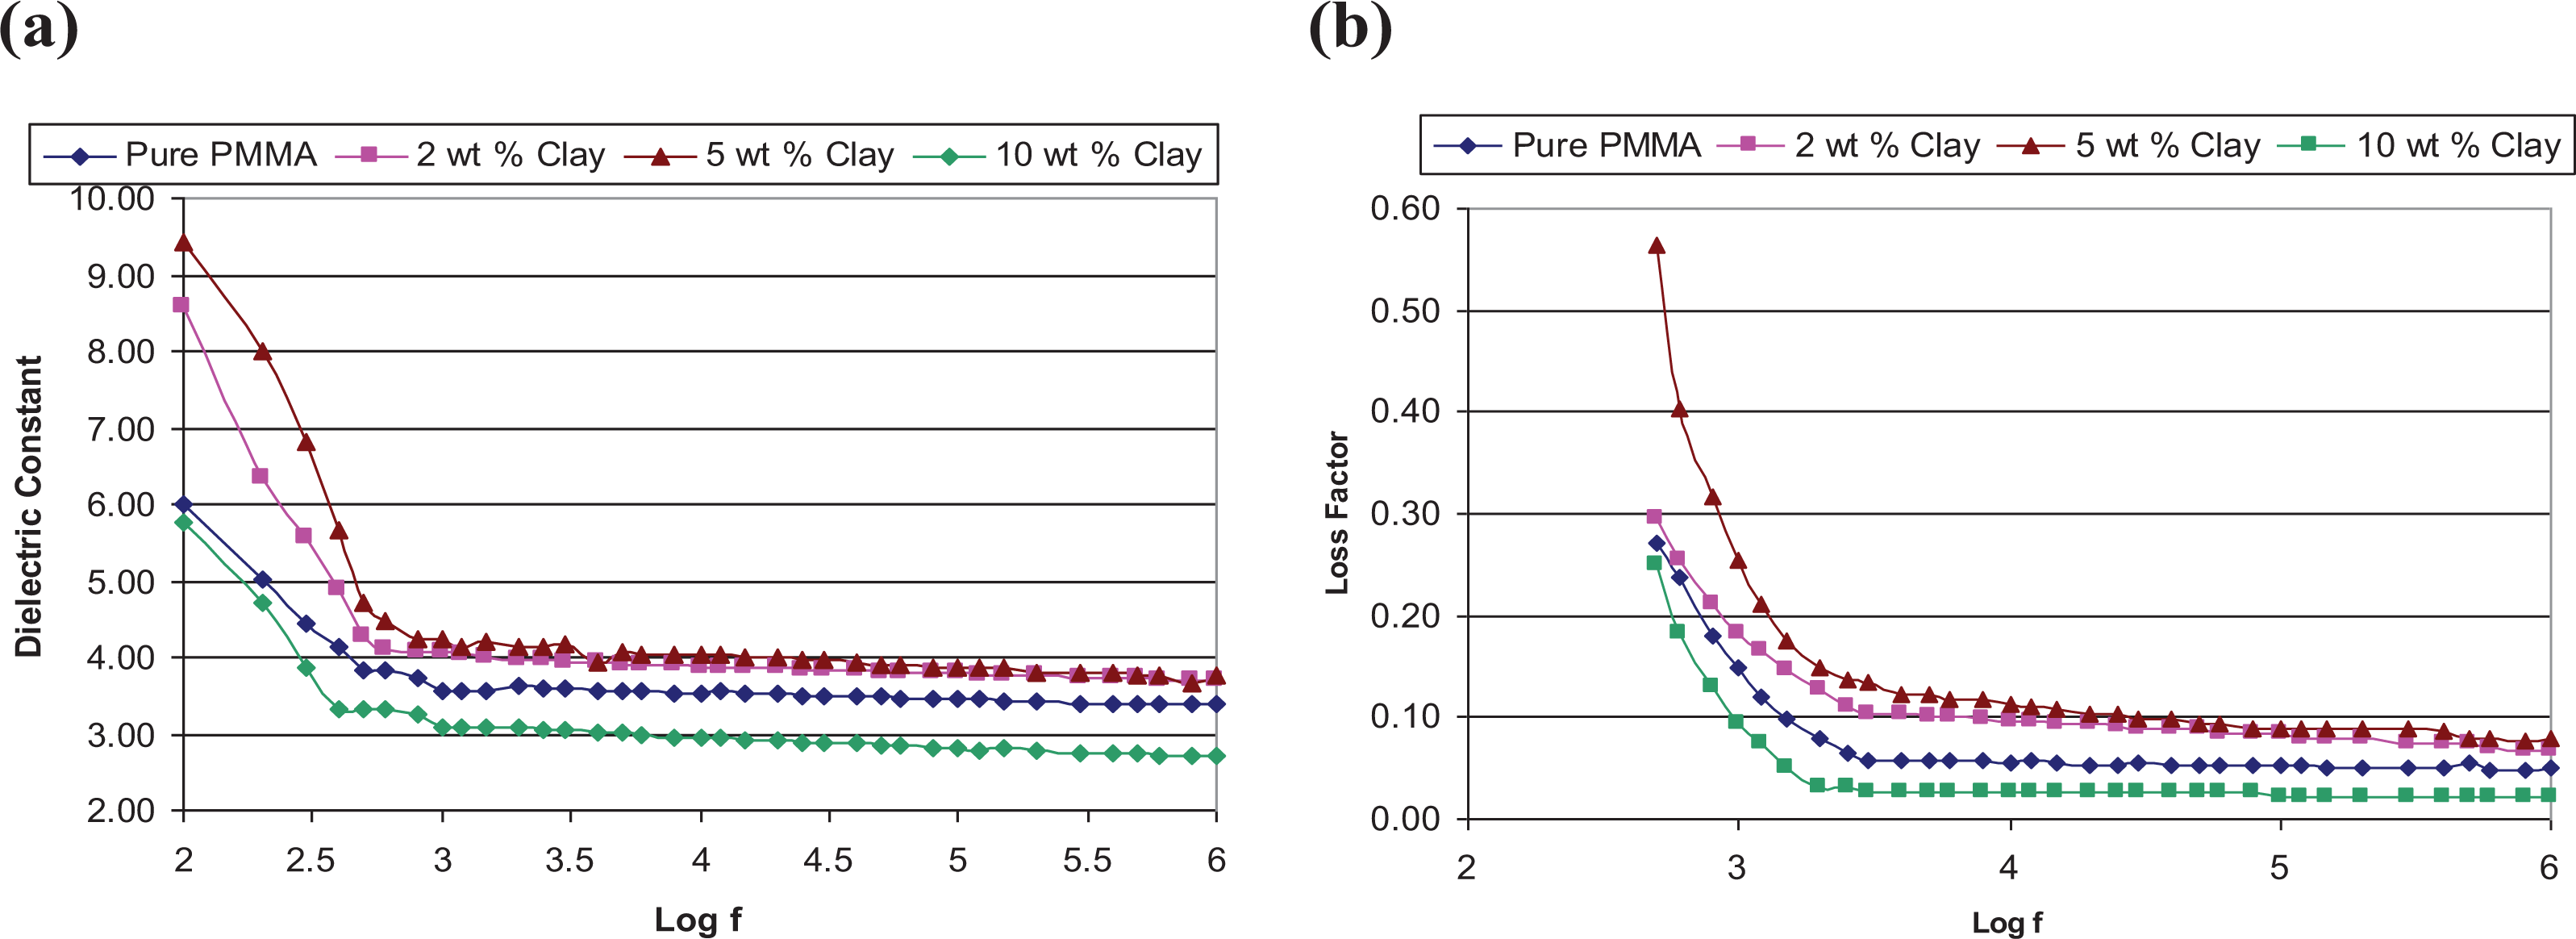
(a) Frequency response curve of PMMA/clay nanocomposites for real part of dielectric constant. (b) Frequency response curve of PMMA/clay nanocomposites for imaginary part of dielectric constant.

(a) Frequency response curve of ABS/OMMT nanocomposites for real part of dielectric constant. (b) Frequency response curve of ABS/OMMT nanocomposites for imaginary part of dielectric constant.
The observed low frequency dielectric dispersion in all the polymers may therefore be attributed to reorientation of sub-molecular polar species of the polymers. When we compare dielectric data of all the pristine polymers PMMA is found to have highest ε′ and ε″ values and ABS has lowest ε′ values at all frequencies. It may be noted that PMMA is a polar molecule and local re-orientational motion of its dipole associated with the ester group –COOCH3 around the C–C bond is a source of polarization in PMMA. Coupled side chain-main chain segmental motions are expected to give rise to dielectric dispersion at even lower frequencies. Owing to the presence of the hydrophilic ester groups, PMMA can absorb up to about 2% of its weight of water 18 which forms hydrogen bonded cluster around the ester groups. These water molecules have been found to provide plasticizing effect to the polymer and space charge around the ester groups 19 which may provide an additional source of polarization to the polymer. Lowest values of ε′ in ABS depict smallest resultant dipole moment associated with local mode reorientation of the backbone.
It is interesting to note that all exfoliated nanocomposite samples (i.e PMMA/OMMT with 2 wt% & 5 wt% and ABS/OMMT with 2 wt%) have dielectric constant and loss factor both greater than those of respective pure polymers in the whole frequency range of experiments (Figures 9 and 10). Similarly, all intercalated nanocomposites samples (i.e PMMA/OMMT with 10 wt% and ABS/OMMT with 5 wt% OMMT) have dielectric constant and loss factor lower than those of respective pure polymers. Moreover, for exfoliated nanocomposites, real and imaginary parts of dielectric constant are higher for higher clay content.
These results can be explained in terms of special microstructures formed in the nanocomposite films. In case of exfoliated polymer nanocomposites, the clay platelets are fully delaminated, exfoliated and dispersed in the polymer matrix and hence a large interfacial area is formed between the exfoliated OMMT and polymer matrix. Different conductivities in the two phase’s results in a large interfacial or space charge polarization of trapped charges at the interface in an applied electric field, an effect commonly termed as Maxwell Wagner polarization. 20,21 With the increase of OMMT content in exfoliated nanocomposites the interfacial area between the polymers and OMMT increases and hence the dielectric constant increases with the OMMT content in the exfoliated nanocomposites.
For the intercalated nanocomposites both real and imaginary parts of dielectric permittivity are low as compared to those observed in respective neat polymers due to restricted mobility of the polymer chains confined between OMMT layers.
Conclusions
Nanocomposites of insulating polymers (poly methyl methacrylate and acrylonitrile butadiene styrene) with varying amounts (up to 10 wt%) of organically modified montmorillonite (OMMT) were successfully synthesized. The dispersion degree of OMMT in polymer matrix was characterized by X-Ray diffraction analysis and found intercalation and exfoliation of OMMT in PMMA and ABS. Degree of dispersion decreased due to increasing OMMT contents in the nanocomposites. FTIR provides information about the chemical interaction between polymers and OMMT in the polymer nanocomposites. Dielectric properties of these nanocomposites examined in frequency range of 100 Hz–1 MHz exhibited higher dielectric constant and dielectric loss values for exfoliated nanocomposites as compared to pristine polymers which is attributed to Maxwell Wagner polarization in these nanocomposites as increased interfacial area between polymer and the clay layers. Lesser dielectric constant and dielectric loss values were observed for intercalated nanocomposites as compared with pure polymers under the same frequency range which is attributed to restricted mobility of polymer chains in the nanoscale galleries of OMMT.
Footnotes
Declaration of conflicting interests
The author(s) declared no potential conflicts of interest with respect to the research, authorship, and/or publication of this article.
Funding
The author(s) disclosed receipt of the following financial support for the research, authorship, and/or publication of this article: Bahauddin Zakariya University for financial support under research project grant No. DR&EL/D-740.