
Abstract
Failure criterion predictions often have substantial errors due to the complexity of failure mechanism or different material behaviors, especially composite failure. In this study, an example of delamination is employed to demonstrate the general failure criterion revision of composites. In the present research, the failure function can be raised to a higher order, and also be reduced to a lower one, by fitting the exponents of failure criterion. This method can be easily used to describe the observed, experimented, or computed data, particularly with no law or no rules. Further, the importance of this exponent revision is amplified when the failure surface becomes more complicated. The proposed approach is also to define and calculate the failure criteria of multiplying laminates.
Introduction
Aircraft safety has been enhanced over decades. According to current statistics, fatal accidents per commercial passenger mile traveled is considerably lower than other modes of transportation such as private automobiles and public buses, introduced by Matsumura et al. 1 However, once catastrophic failure occurs, nobody will survive. And therefore, further safety has been constantly demanded. One of the strong incentives to this requirement is sentimental and catastrophic nature of aviation accident and single failure is more likely to cause a severe consequence involving a number of fatalities. Another factor is represented by the fact that aviation has been playing a pioneering role of evolving engineering technology, such as introducing new design methodologies and new materials proposed by Mohaghegh, 2 resulting in being forced to handle uncertainties in the development as well as the service phase. Composite materials have used in many aerospace structures due to their high strength- and stiffness-to-weight ratios, lightweight, resistance to fatigue/corrosion, and flexibility in design, since the last century. This tendency, with resulting considerable enhancement in fuel economy and passenger comfort level, among other merits, is anticipated to continue well into the near future. To the best of our knowledge, in the structural design process of aircraft, appropriate failure-criterion characterization is vital to reduce such accidents. Generally speaking, composite structures undergo various damage modes, which make it difficult to define a specific failure criterion, described by Gunel and Kayran. 3 Fibrous composites exhibit a range of complex failure behaviors, introduced by Malusare and Fertig. 4 To predict failure of a laminate, there are several commonly accepted theories. They may be broadly classified into three groups, limit or noninteractive theories (maximum stress, maximum strain), interactive theories such as Tsai–Hill and Tsai–Wu, 5 and partially interactive theories. One of the most famous composite failure benchmarks, the World-Wide Failure Exercise (WWFE), lists five promising theories: Puck,6,7 Zinoviev,8,9 Tsai,10,11 Cuntze,12,13 and Bogetti14,15 for predicting failure in composites which employ the meso-modeling technique. After WWFE-II, released by Hinton and Kaddour, 16 determined the accuracy of current theories for predicting failure in polymer composite laminates under three-dimensional (3D) states of stress, WWFE-III proposed by Kaddour et al. 17 was launched to assess the capability of representative models to capture damage, in particular, matrix cracking and delamination, prior to failure. In a majority of cases, it is evident that these above theories, when fully developed and appropriately transformed, may have the capability of predicting the response of the entire composite structure even in the absence of laminate test data.
By far, the WWFE I, II, and III had been built up since 1992.
Representatives from all stages are depicted in Figure 1.

WWFEs.
However, the limitation of failure criteria is that they defined the failure criteria of the uniaxial coupon for material level and the multi-axial element, which dealt with the lower hierarchical allowable determination in the building-block test.
In this article, a new failure-criterion revision method is proposed. The article is organized as follows. The first part briefly introduces the background of this research and some experts’ work on composite failure criteria. The development of the failure criterion has been indicated in the second section. Then, in the third part, an example for a delamination failure analysis is given to show a 3D failure surface. Fourthly, the simulated data are used to revise a delamination failure criterion, followed by a conclusion in the last one. Also, this method may be applied on the remedy of failure criteria of the composite structures during the future test data or special failure modes. Furthermore, it is also used for failure criterion definition of multiply composites, when countless test data have been collected.
Development of the failure criterion
Firstly, the failure criterion of maximum stress or maximum strain is one of the simplest first-ply-failure criteria.

where σ is allowable tensile stress in the principal x (or y) direction of the material; σmax is maximum stress of the single ply among all plies; ε is allowable tensile strain in the principal x (or y) direction of the material; and εmax is maximum strain of the single ply among all plies.
And then, in 1971, Stephen W Tsai developed an operationally simple strength criterion for anisotropic materials from a scalar function of two strength tensors. And he showed the interaction term F12 as an independent but constrained strength component, which was an essential variable that made the strength tensor possible.
Tsai 18 also discussed the most failure criterion (equation (2)) in terms of stress components, based on Gol’denblat and Kopnov. 19

The quadratic criterion in a simplified form was

Among them, the interaction term Fxy was defined by

The quadratic failure envelope was an ellipsoid and was constrained geometrically by

Through the expression above, we could get an elliptical failure envelope for composites. However, when the same strength data of T300/5208 was used, the customized failure envelope in the strain space is shown in Figure 2, for a 0, 90, or ±45° laminate.

The customized failure envelope in the strain space.
After that, Tsai and Melo 20 indicated the failure envelope for a laminate with many ply orientations would be limited by the controlling ply in each orientation of the strain space, as shown in Figure 3. All failure envelopes were ellipses or off-axis ellipses.

Failure envelopes in strain space for (a) T700 C-Ply 55 and (b) IM7-977 [p/12] laminates.
Furthermore, Tsai and Melo 21 introduced biaxial failure stress envelope for an AS4/3501-6 [0/±45/90]s laminate, which was compared to experimental data.
However, Talreja 22 pointed out that failure theories for composite materials had been a subject of concern for almost half a century and numerous theories had been proposed over the years, but none of them had successfully predicted the full range of observed behavior. After critically reviewing some of the main theories in an effort to understand their deficiencies, rather than seeking their validity by comparison with test data, he examined the assumptions and analyzed the proposed theories. Certain remedies, such as multi-scale analysis of failure, analysis of constrained failure, and analysis of manufacturing defects, were proposed to the current approaches to achieve a failure analysis procedure with a potential to succeed in predicting the complex failure behavior of composite materials.
Furthermore, Talreja 23 proposed the hurdles in treating intralaminar cracks diverting into the lamina interfaces and the interconnection between these cracks resulting from growth in the interfaces. He also indicated that the load-bearing capacity of a laminate with this type of damage was yet to be determined reliably and current trends in treating this problem by the cohesive zone models were subject to uncertainty owing to the non-uniqueness of the material parameters (strength and fracture toughness) entering such models.
In the present work, the objective is to adjust the exponents of failure index (FI), some high-order terms in equation (2).
Analysis of composite delaminate failure
Delamination damage of the laminated composite is one of the most typical and important failure modes. Generally, the delamination is represented by an effective local separation between the different layers (i.e. loss of contact) which differs from a classical fracture mechanics. Here, dynamic calculations such as transient response analysis, acoustic–structural coupling analysis, and so on, permit to take into account the influence of dynamic effects. This means stress or strain changes with time or frequency through the identification of the values of the damage criteria.
A standard power law formulation on stress failure criteria of delamination was written by Gol’denblat and Kopnov, 19 and Huang. 24

where
Finite element model
The presence of the composite delamination causes some stress changes under a loudspeaker excitation. Through the delamination failure criteria, delamination elements may be detectable.
1. Finite element model
A beam was a hollow square pipe, with a dimension of 1-m long, 0.04-m wide, and 0.04-m high. A mass element of 0.1 kg was located at the acoustic excitation point. The beam and inside fluid coupling elements were modeled with eight-node uniform hexahedron solid elements, which are shown in Figure 4.

Distribution of fluid and structure elements.
There were two sets of models in the current analysis. One was a healthy structure, and the other had several damages with delamination, which was simulated by double nodes with the same location to simulate. For example, two elements (1 and 2) were used to express one of damages, three elements (3, 4, and 5) were employed to represent the other, which are illustrated in Figure 5.
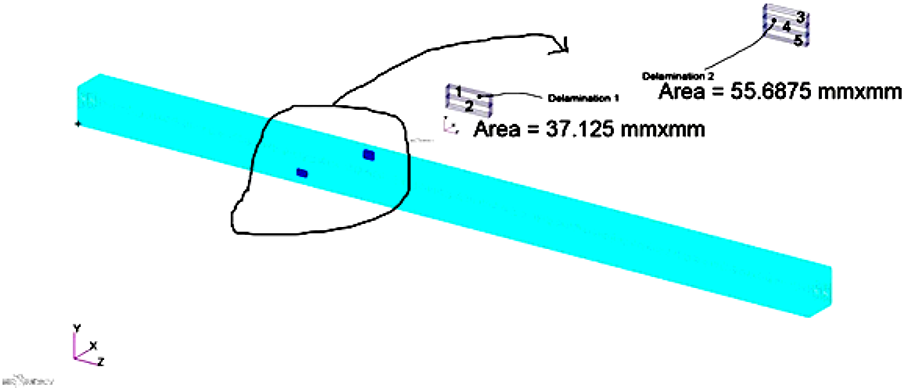
Illustration of two pieces of delamination.
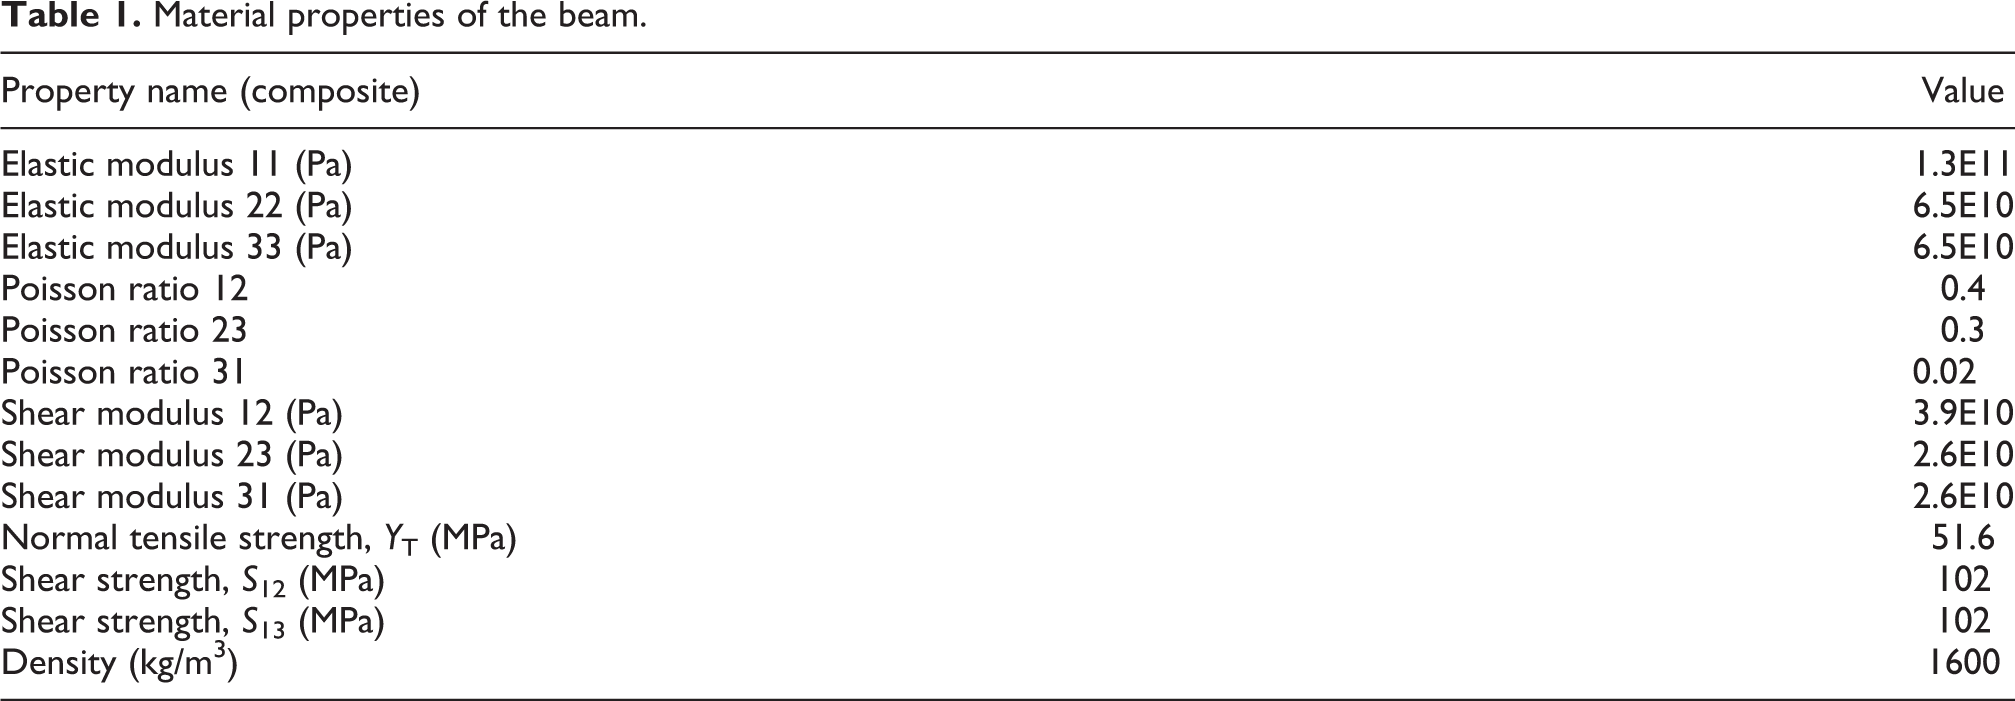
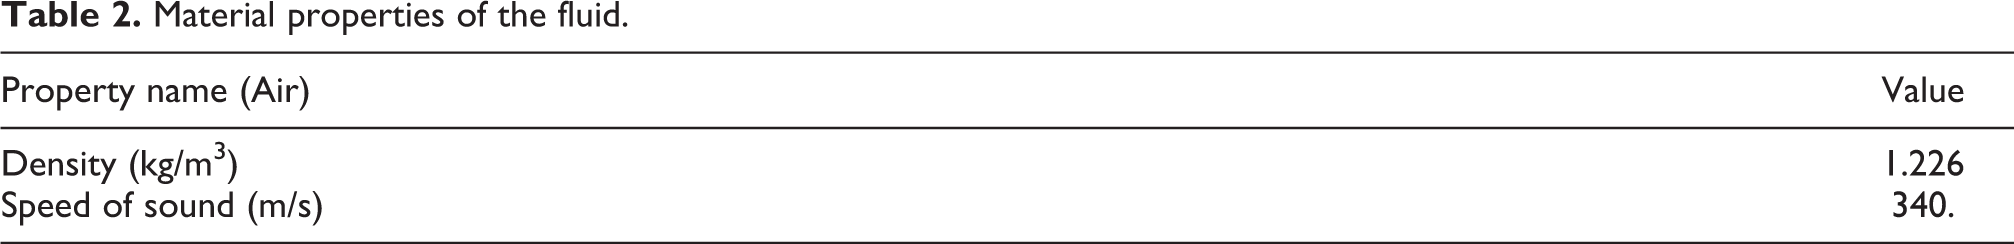
The laminated composite beam having a constant thickness (0.125 mm) of any individual layer was constructed of orthotropic carbon fiber plies in a [0/90/0/90]4 layup. The structure and fluid material properties are indicated in Tables 1 and 2. The composite ply orientation is shown in Figure 6.
Material properties of the beam.
Material properties of the fluid.

Material orientations of the beam.
2. Boundary conditions
The boundary conditions in the model were defined, with fully fixed nodes at one end of the beam and constrained fluid direction (Z) of fluid elements, and interior acoustic analysis of a speaker was excited by an acoustic load normal to the center at the other end. It is shown in Figure 7.

Boundary conditions of the beam.
In the present study, a loudspeaker or noise from machines was taken as an exciter. The frequency from 0 Hz to 3000 Hz was applied. Structural damping coefficient was 0.06. And a coupled fluid-structure analysis was carried out by MSC.Nastran.
Delaminate analysis method: Dynamics for structural–acoustic coupling
For acoustic medium, this structural–acoustic coupling problem is described in the following. For a unified structural–acoustic model, it can be expressed as

where Kss is the dynamic stiffness matrix of the structural system; KSF is the fluid-structure coupling matrix; BFS is the matrix obtained using various coefficients of the acoustic-elastic coupling. US and P are, respectively, the unknowns related to the structural components and acoustic vectors. AFF contains the acoustic mass and stiffness matrices. FSS is the vector related to the mechanical excitation force applied to the structure.
In this present study, through sound vibration, it was easy to get stress responses of the results with frequency changing. Before that, the damage areas in the laminated composite beam were defined, in terms of some pairs of duplicate nodes at the same position.
Results
Based on the maximum stress output of dynamics analysis from frequencies 1 Hz to 3000 Hz, FI_1 was calculated by equation (6), when m = n = k = 2. By use of the least-square method, the function related between A and FI_1, according to data in Table 3, was
Damage area versus FI.

FI: failure index.

FI_2 was obtained by equation (8).
From Table 3, the error is so large that the segment interpolation is used in Tables 4 and 5. The method is similar to Table 3. Taking the first four points to interpolate, the data are listed in Table 4.
Damage area versus FI.

FI: failure index.
Damage area versus FI.

FI: failure index.
The function related between A and FI_1, according to data in Table 4, was

When A ≤ 40 mm2, equation (9) is used.
Taking the last three points to interpolate, the data are listed in Table 5.
The function related between A and FI_1, according to data in Table 5, was

When A > 40 mm2, equation (10) is used.
Revision of composite delaminate failure criterion
Obviously, the interpolated points (delamination areas) in Table 3, FIs and some calculated stress could not satisfy equation (6), when m = n = k = 2. So, when more delaminated areas were set up, structural–acoustic coupling analysis was repeated as in the “Finite element model” section, and more results were obtained. In some points, FI = 1.0. In the other points, FI > 1.0 or FI < 1.0. Figure 8 clearly demonstrates the distribution of FI, for example, the failure zone is easily observed.

Distribution of FI.
When FI = 1, through X (σ3/YT), Y (τ13/S13), and Z (τ23/S23) coordinates of the black points (FI) in Figure 8, m , n , and k in equation (6) were defined to the unknown variables, and least-square method was also employed to form the failure surface. The failure-criterion function was fitted to

The average abstract error for interpolation is 2.38114. Comparison of the original ellipsoid and fitted surface is shown in Figure 9. According to equation (6), when m = m = k = 2, “original failure surface” was drawn, while “fitted failure surface” was plotted in terms of equation (11).
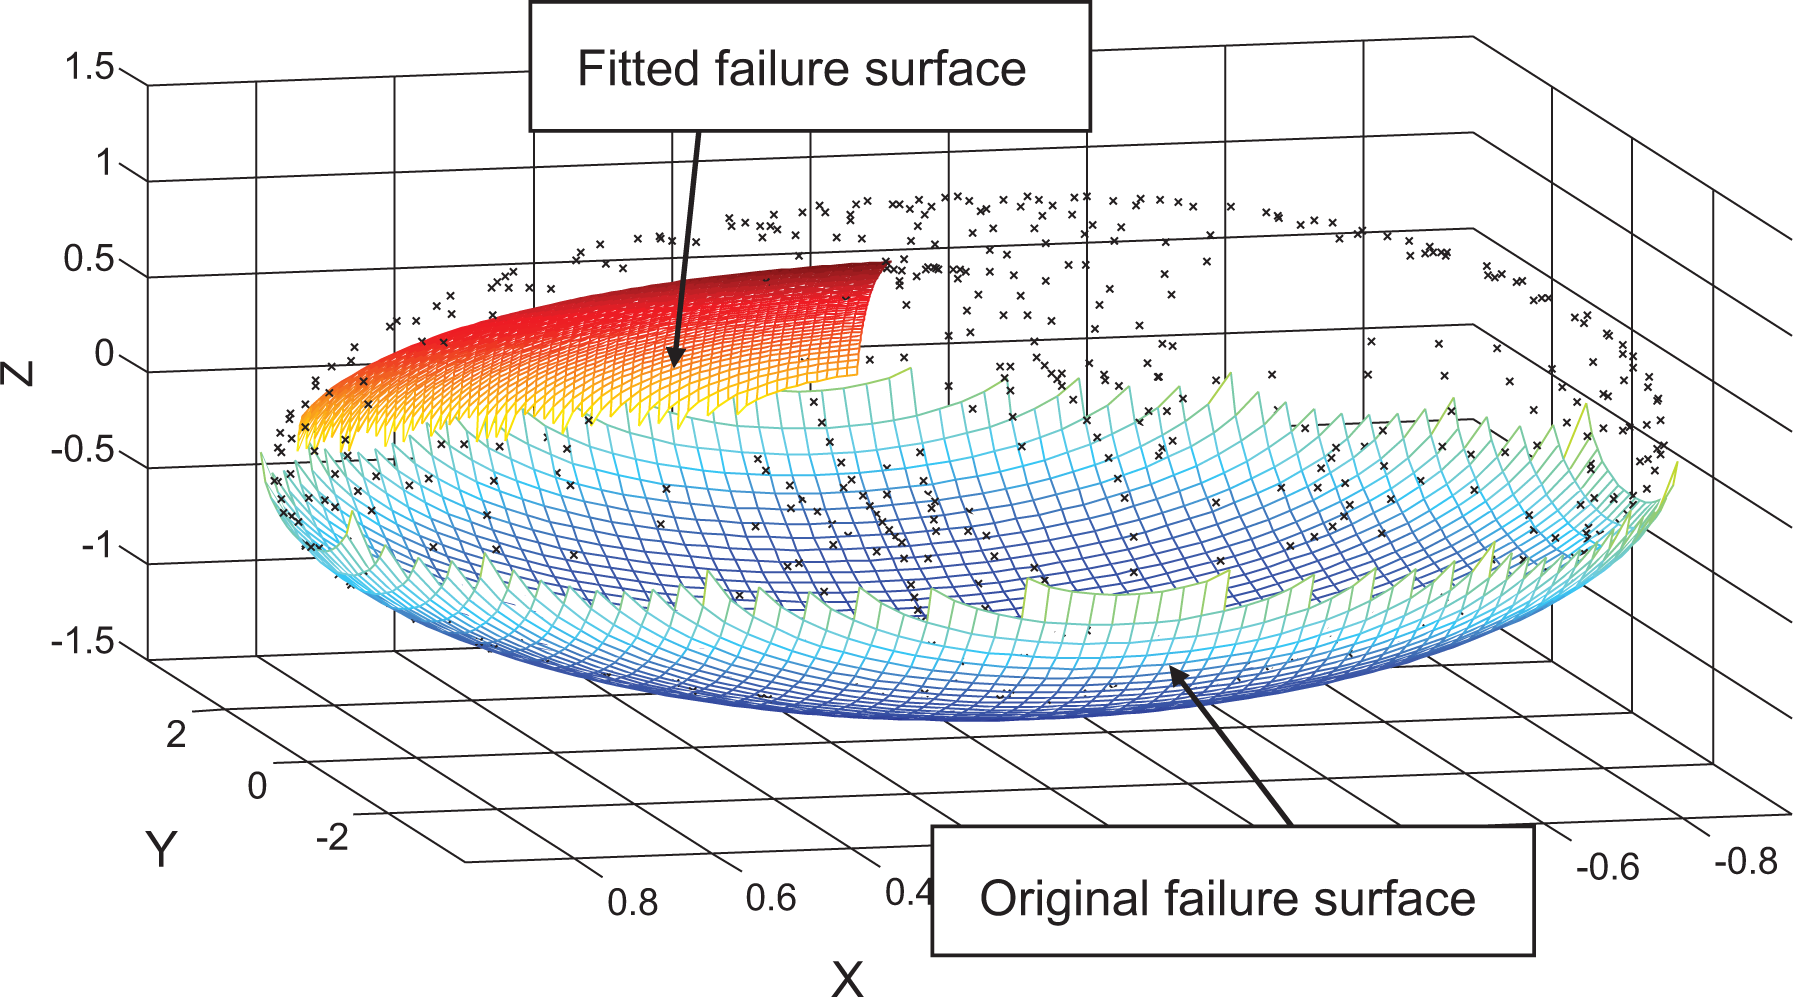
Original failure surface versus fitted failure surface.
After an error analysis of every original point in equation (11), weight coefficients were adjusted. The larger the coefficients are, the smaller the errors are. The weight coefficient for every point is listed as follows:
where WC i is the weight coefficient for every point; Er i is the error of FI in equation (11) for every point.
The new failure-criterion function was written by weighted least-square method to

At this time, the average abstract error was reduced to 1.73902. The new failure surface is presented in Figure 10.
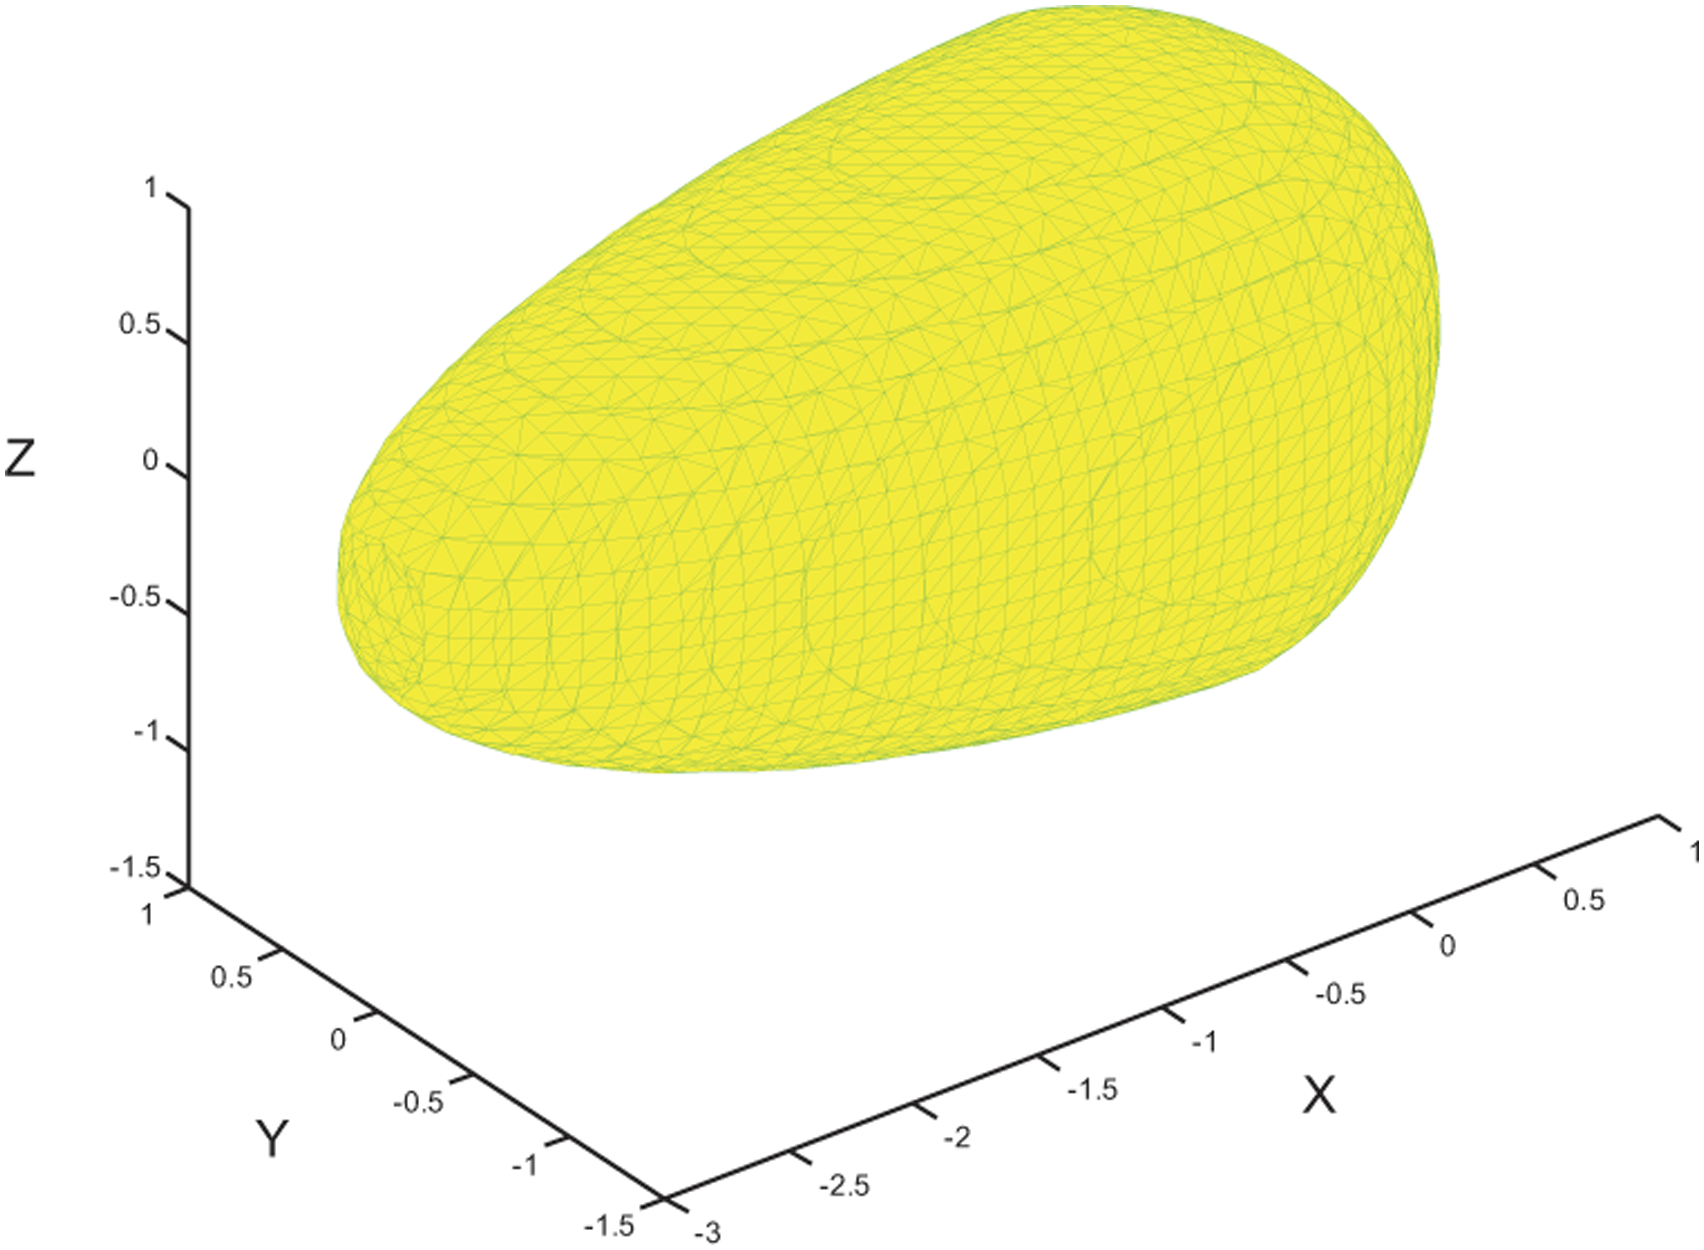
New failure surface.
Conclusions
Due to lack of experimental data, the present study had to use a simulation of delaminated results to show the revised procedure.
In the present study, an approach using an index change in traditional failure criterion with predictive damage capability is represented by the given example. The solution does not alter the major or minor axis of a failure surface, or change Fxy, but modifies the exponents of the failure criterion. This can enhance orders of failure functions, or cut down some of them, such as the example in equation (9).
Furthermore, it makes failure criterion more suitable for complicated failure modes in practical engineering. From interpolated errors, the first average abstract error is 2.38114 of equation (9). The second one is 1.73902 of equation (11), for fitting the exponents. As can be seen, the exponent revision reduces the error, 36.92%, by use of modified weight coefficients during interpolation. Through alterations, the error is gradually reduced, with increasing precision.
Final remarks
According to the different bearing capacity of composite laminates, the proportion of layers at different laying angles is different to lay laminates. In Pyramid Tests of composites, the proposed method is also to define and calculate the failure criteria of multiplying laminates, such as a composite layup ratio, 5:4:1or 6:3:1 at 0°/90°/±45°. And therefore, it can save time and money.
In addition, for beginners, firstly, find existing failure criteria based on available knowledge. Secondly, define it as an initial point. Lastly, reuse the fitting tool to form new and more realistic failure criteria.
Footnotes
Acknowledgments
The authors would like to thank the Beijing Aeronautical Science and Technology Research Institute of COMAC for supporting the development of this new technology for SHM. I would like to express my gratitude to all those who helped me during the writing of this article. My deepest gratitude goes to Dr Hu Zhendong for his constant encouragement and guidance. In the example of this article, composite delaminate calculation, he directed me to finish it, and it was used to health monitoring of the structure.
Declaration of conflicting interests
The author(s) declared no potential conflicts of interest with respect to the research, authorship, and/or publication of this article.
Funding
The author(s) received no financial support for the research, authorship, and/or publication of this article.