
Abstract
This investigation explores the possibility of developing a new class of particulate-filled polyester composites using waste marble dust as filler. The dusts collected from local construction sites are sieved to three different sizes (58, 110, and 155 μm). Polyester composites are fabricated with filler in different weight proportions (0, 8, 16, 24, 32, and 40 wt%). A Fourier transform infrared spectroscopy study is done to get an insight into the chemistry of composite formation. Scanning electron microscopy reveals the surface features of the filler as well as the composites. X-Ray diffraction tests are carried out on the raw filler and on the composites to ascertain the presence of hard phases. The experimental findings suggest that, while the tensile and flexural strengths of the composites marginally drop with the incorporation of marble dust, there is reasonable improvement in compressive strength, impact strength, and Shore hardness. The density and voids are also affected by the size and content of filler particles in the composite. Armed with lightweight, improved hardness, and impact strength, these polyester–marble composites are expected to find potential use in wear-related engineering applications.
Introduction
In spite of the overwhelming interest in nanocomposites, biomaterials, and natural fiber-reinforced composites, considerable research and development are being done on particulate-filled polymers, as these are widely used in all kinds of applications. In the past, fillers were added to the polymer primarily to decrease prices. However, the ever increasing technical and aesthetic requirements as well as soaring material and compounding costs require the utilization of all possible advantages of fillers.
Due to the high cost of conventional fillers like metal and ceramic powders, it is becoming essential to replace conventional ceramics in composites by other cheap and abundantly available waste materials either partially or completely without compromising the quality. Waste marble dust is one such material, which possesses the potential as a filler in polymeric matrices. Marble powder is produced in construction sites and from processing plants during the sawing and polishing of marble blocks where about 25% of the processed marble turns into powder form. Today, disposal of the marble powder is one of the environmental problems worldwide. One of the logical means for reduction of the waste marble powder is utilizing them in some meaningful applications. Some attempts have been made in the past to find and assess the possibilities of reusing waste marble powder in building and construction industries. Corinaldesi et al. have reported that 10% substitution of sand by the marble powder in the presence of a super plasticizing admixture provided maximum compressive strength at the same workability level. 1 The mechanical properties of concrete are enhanced and the percentage air content is decreased for up to 15% replacement of marble slurry in place of sand. 2 The addition of granite powder and marble powder enhanced the flexural and compressive strength of concrete significantly. 3 The enhancement of mechanical properties such as tensile, compressive, and flexural strengths along with a 15% reduction in water permeability of concrete is obtained by adding marble powder in it as a replacement of cement. 4 Similarly, to obtain optimum enhanced strength and durability of concrete, 40% marble powder can be added as a replacement of fine aggregates. 5 The addition of granite powder reduces the water absorption and plastic deformation index and increases the tensile strength of the roof tiles. 6 A combination of marble dust with imperial smelting furnace slag enhances the compressive strength of concrete by 20%. 7 Binici and Aksogan observed that the durability property of the concrete made with natural granular granite, silica sand, and powders of waste marble and basalt as fine aggregate was superior to the conventional control concrete. 8 The amount of marble dust up to 10% had a positive effect on the physical, chemical, and mechanical strength of the produced industrial brick. 9 Mechanical properties of the structural concrete with marble waste in the presence of plasticizer were improved considerably. 10 The use of waste marble in the conventional concrete as a binder or fine/coarse aggregate positively affected the properties of hardened concrete. 11 The recycling of waste marble dust is essential because it can negatively affect the environment due to its high chemical content. 12 Çinar and Kar revealed better hardness, impact strength, and thermal conductivity of the composites prepared with waste plastic and marble dusts. 13 The marble powder composites are also proposed to be used as dental replacements. 14 The tensile strength and hardness of the epoxy–marble composites are found to be superior to epoxy. 15 Borsellino et al. have also reported improvement in properties such as hardness, compressive strength, and corrosion resistance of the resin composites with the increase of marble powder up to 60%. 16 The peak stress, strain, and elastic properties of marble increase with temperature up to 400°C. 17
Literature review thus reveals that though the reuse of marble dust in building materials and concrete has already been established, its application as a filler material in polymeric matrices has remained a less studied area. In view of this, the present work explores the possibility of developing polyester composites filled with waste marble powder and of evaluating their physical, microstructural, and mechanical properties.
Experimental details
Materials
This investigation considers unsaturated isophthalic polyester resin as the matrix material along with its hardener methyl ethyl ketone peroxide and accelerator cobalt naphthenate. These two are added to the polyester resin at a proportion of 2% by weight each. Table 1 provides the physical and mechanical properties of polyester resin procured from A to Z Chemicals (Kolkata, West Bengal, India).
Properties of unsaturated polyester resin.

Waste marble dust (density 2.80 g cm−3) used as the particulate fillers in the present work are obtained from crushing waste marble pieces from a local construction site. A ball mill with a ball-to-material weight ratio of 1:10 is employed for the purpose. Then the dusts are sieved and separated into three different sizes, 58, 110, and 155 μm, respectively.
Composite fabrication
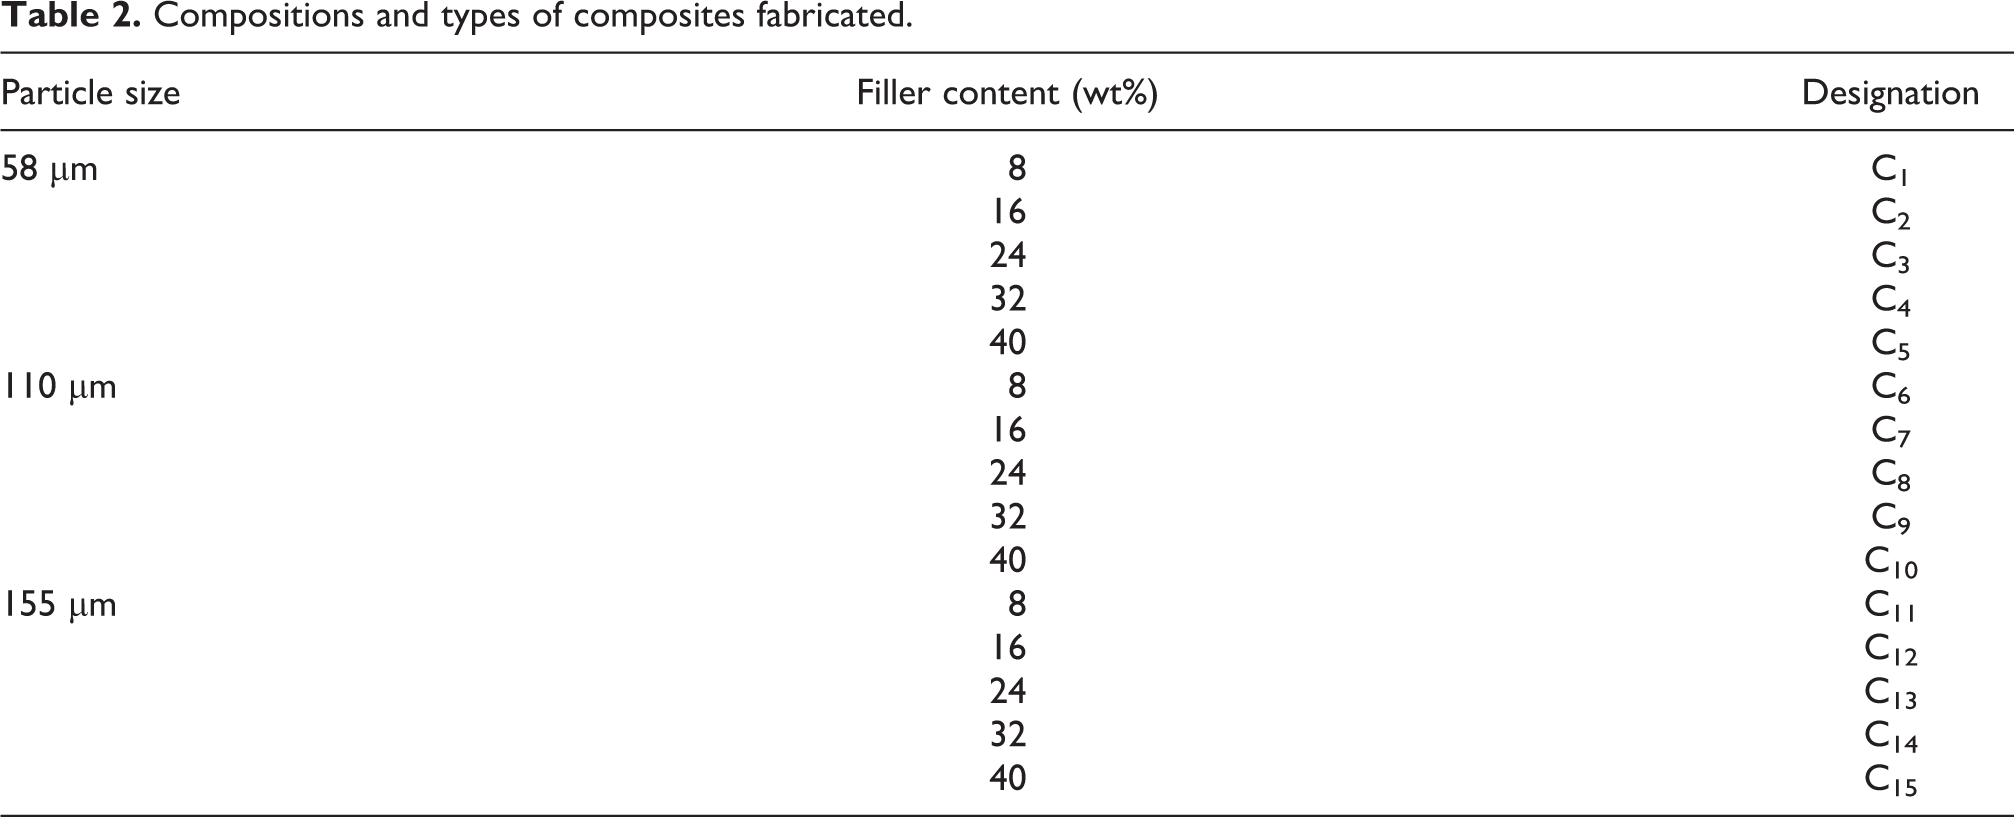
Using the conventional polymer solution casting technique, 15 sets of polyester composites are prepared with five different compositions for each filler size (58, 110, and 155 μm). First, the hardener and accelerator are added to the polyester at a proportion of 2% by weight each and then stirred properly. The filler in different proportions (8, 16, 24, 32, and 40 wt%) is then added to the polymer and stirred properly for 2–3 min before being poured into a wooden mold (250 × 150 × 4 mm3) and left at room temperature for 24 h for curing. A hardened polyester slab of similar dimensions is also prepared in the same way without any filler. The composite slabs are then removed from the mold, and specimens are cut per the required dimensions. Cylindrical specimens (12.5 mm diameter) are prepared using the glass tubes and then cut into required size for compression test. The designations of the composites with respect to the particle size and filler content are provided (Table 2).
Compositions and types of composites fabricated.
Characterization
Physical characterization
Density and porosity
The density of the composites is measured by the Archimedes principle using water as the medium. The density of all the three composites consists of equal wt% of filler from the different particle size (58, 110, and 155 μm) are measured and the average of each set of composites are considered as the density of the composite in the respective filler content. The porosity or volume fractions of void (V v) in the composites are calculated by using the rule of mixture as per the equations given below.

where the theoretical density

where W and ρ stands for weight and density, and m and f stands for matrix and filler, respectively.
Microstructural characterization
Scanning electron microscopy
The scanning electron microscopy (SEM) is used to study the morphology of the composite samples and of the raw marble dust. The dry samples are coated with a thin film of platinum to enhance the conductivity and then inserted into the test chamber of the JEOL JSM-6480LV SEM (Japan).
X-Ray diffraction
To know the phase and plane of the components present in the material, the X-ray diffraction test is conducted using the BRUKER D8 ADVANCE X-ray diffractometer (USA) in 2θ range from 0° to 100° with a scan rate of 2° min−1. The marble dust, polyester, and the composite powder are analyzed in this diffractometer.
Fourier transform infrared spectroscopy. Fourier transform infrared spectroscopy (FTIR) test is conducted using an IR spectroscope (IRPRESTIGE-21, 200VCE, India) on the raw marble powder and the marble–polyester composite powder to ascertain the functional groups present in the compound and the possible bond formation between the functional groups during the composite making.
Particle size analysis
Using a HORIBA LA-960 (Japan) laser scattering particle size distribution analyzer, the average particle sizes and distribution frequencies of three different lots of sieved fillers are determined. The diameter of the maximum percentage of particles in any particular lot is considered as the particle size of that powder sample.
Mechanical characterization
Tensile strength
Flat specimens from the fabricated composite sheets are cut into dimensions 175 × 25 × 4 mm3 according to the American Society for Testing and Materials (ASTM) D3039 standard for the evaluation of tensile properties. The test on the specimens is carried out using the dynamic universal testing machine (100 kN) with a crosshead speed of 1 mm min−1.
Flexural strength
A three-point bending test is conducted on the composite specimens to evaluate their flexural strength and the flexural modulus. The test is performed using a universal testing machine at room temperature with a crosshead speed of 1 mm min−1 and gauge length of 60 mm. The specimen size is 125 × 12.7 × 3.75 mm3 according to the ASTM D790 standard.
Compressive strength
To evaluate the strength of the composites in uniaxial compression, a test is carried out on the specimens by the INSTRON 8862 (USA) at room temperature with a crosshead speed of 0.5 mm min−1. The cylindrical samples of dimension 25 mm length and 12.5 mm diameter are used according to the ASTM D3410.
Impact strength
An IZOD impact tester (India) is used to evaluate the impact strength of the composites. The composite specimens are prepared with dimensions 64 × 12.7 × 3.2 mm3 according to the ASTM D256 standard.
Hardness test
The Shore D hardness of the composites is measured using a durometer DIN 53505 (India) according to the ASTM D2240 standard at room temperature. For the evaluation process, the needle of the durometer is made to penetrate into the composites by applying load on the hand lever. The reading on the pointer of the durometer when the needle is completely penetrated into the composite samples is taken as the Shore hardness number of the corresponding sample. The hardness of each sample is found by taking an average of five readings on each side of the sample.
Results and discussion
The physical, microstructural, and mechanical characterizations of the composites displayed a great variation of the composite properties with respect to the filler particle size and content. The results of different characterizations are given below.
Physical characterization
Density and porosity
The theoretical and measured densities of the composites are presented in Table 3. The volume fraction of voids is also given in Table 3. Figure 1 shows the densities in graphical form. From the tabulated data, it is seen that in all cases, the theoretical density is more than the measured density, and the difference between them is increasing with the filler content. This difference is a measure of the pores and voids present in the composite body. From Table 3, it is noted that the volume percentage of voids is 0.78 in the hardened neat polyester. As the filler is added to the matrix, the value of void fraction goes on increasing and is the highest for the composite with 40 wt% of filler. Thus, it is clear that the void fraction of any filler composite is strongly influenced by the amount of filler content.
Densities and void fraction of the composites.


Density variation with filler content.
Microstructural characterization
Scanning electron microscopy
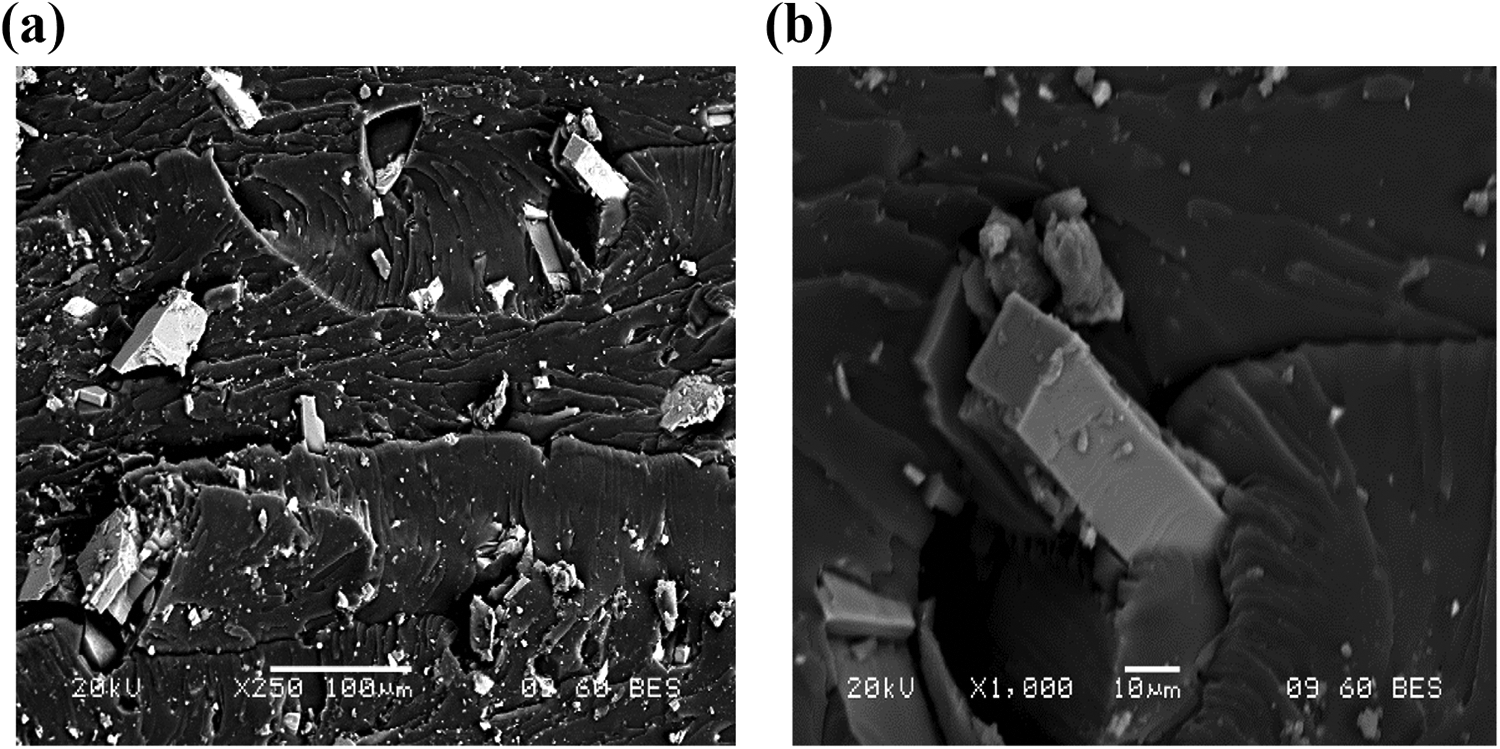
The SEM micrographs of raw marble dust (Figure 2(a)) and of polyester–marble composite (Figure 2(b)) are taken to get an insight into their morphological features. Figure 2(a) gives an idea about the size of the particles and exhibits the non-regularity in their shape. Figure 2(b) shows a typical surface morphology of the composite and illustrates the distribution of the filler particles within the matrix body along with the voids present in the composite.

(a and b) SEM micrograph of marble dust and composite surface.
Figure 3(a) and (b) are the energy-dispersive detector (EDS) diagrams of the marble dust and the composite, respectively. The test is conducted to know the constituents present and their wt% in the marble dust and in the composite.
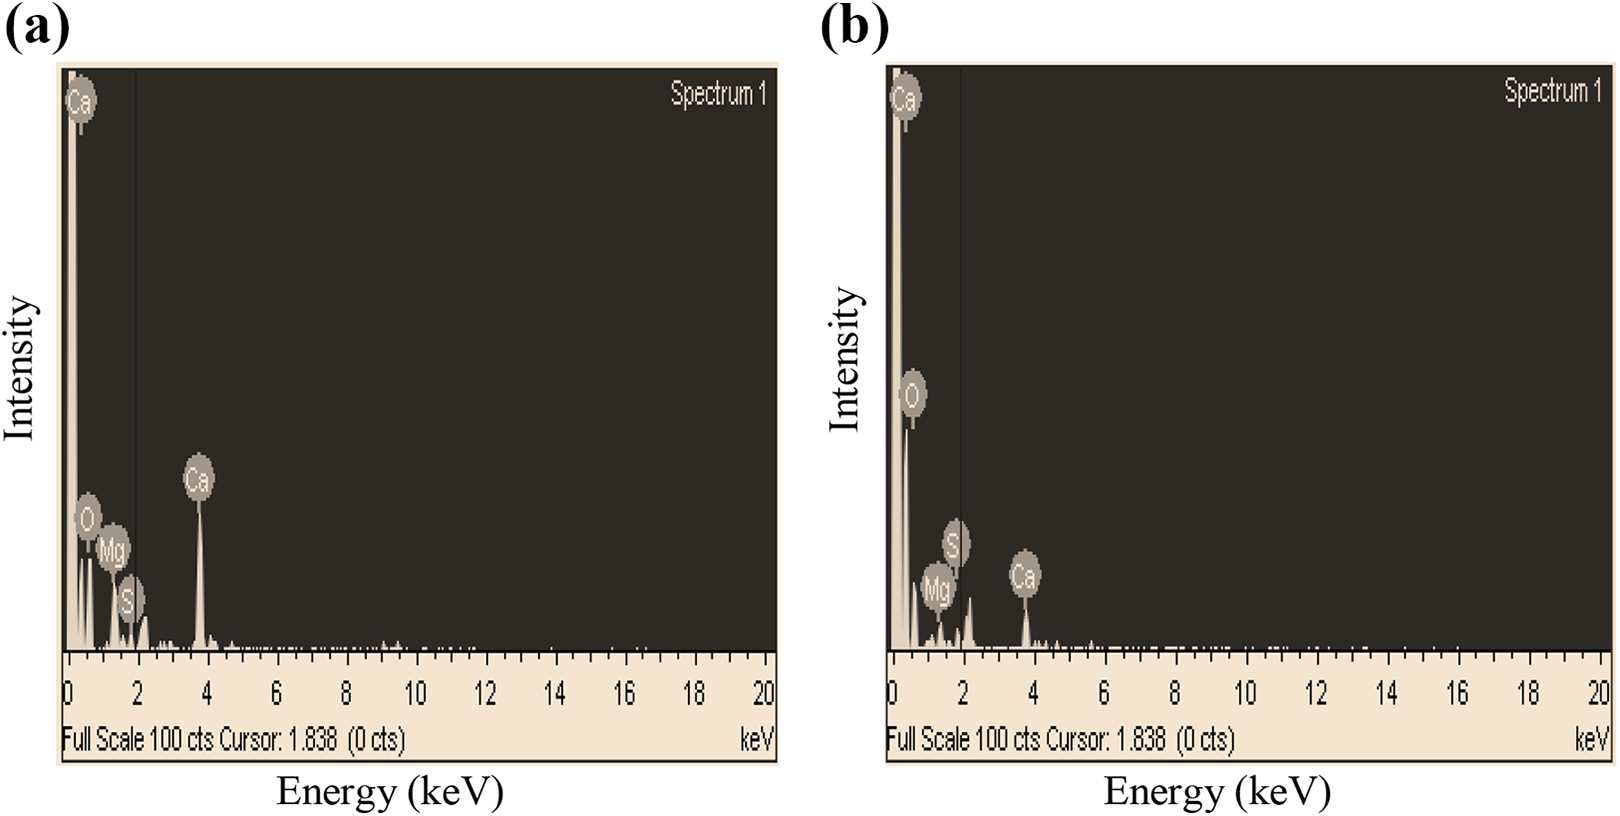
(a and b) EDS of marble dust and polyester–marble dust composite.
Chemical analysis of marble dust reveals the oxides of silicon, calcium, and magnesium as its major constituents. Elemental analysis is performed using EDS and the elemental peaks are obtained as shown in Figure 3(a) and (b) for raw marble and for polyester–marble composite, respectively. It is found that marble powder consists of calcium 23.68 wt% in the form of wollastonite, silicon 2.25 wt% in the form of silicon dioxide (SiO2), magnesium 8.65 wt% in the form of magnesium oxide (MgO), oxygen 53.54 wt% in the form of SiO2, and a little amount of carbon (12.28 wt%) in all the constituents and mostly in the form of calcium carbonate (CaCO3). Similarly, the composite contains almost the same constituents such as calcium 17.50%, silicon 6%, magnesium 7.93%, oxygen 52.33%, and carbon 16.24% by weight in it.
X-Ray diffraction
The data obtained in the X-ray diffraction test of the marble dust, polyester powder, and composite powder are plotted and shown in Figure 4.

X-ray diffraction of neat hardened polyester, marble dust, and composite powder.
From the diffractogram, it can be seen that the phases present in the marble dust are calcite (CaCO3), fluorite (CaF2), silica (SiO2), silicon oxide (SiO2), and sodium erbium fluoride. Calcite is present in most of the planes but shows major peaks at 34.2889°, 76.5139°, 77.5098°, and 92.5514° and relative to the planes of 012, 104, 113, and 201. Fluorite shows its major peak in 32.6004°, at plane 111. Silica and silicon oxide are showing their peaks together at the angles 59.4183°, 80.4419°, and 97.1930° and are present together at planes of 100, 101, and 112 relative to their peaks. Sodium erbium fluoride shows its peak at the angle of 32.6004° in the plane 200.
The X-ray diffraction curve of neat polyester ensures that it is amorphous in nature as there are no strong peaks present in the graph. There are some small peaks at a very low intensity, which shows the presence of a very little amount of chromium (Cr) at plane 211 and shows a very small peak at 76.1144° related to that plane. Silicon oxide (SiO2) is the major constituent associated with planes 101, 100, 112, and 110 and the relative peaks are present at 96.2111°, 59.1427°, 53.5526°, and 42.4975°. Calcite (CaCO3) is present mostly in the planes 104, 113, 202, and 018 and the peaks of calcite relative to the planes are at the angles 26.7044°, 50.7741°, 66.5157°, and 91.7891°. Silica (SiO2) shows its peak at 96.2111° only relative to the plane 101.
The compounds present in the polyester–marble dust composite as evident from the diffractogram are calcite (CaCO3), hematite (Fe2O3), silica (SiO2), and quartz (SiO2). The composite calcite shows its peaks at the angles 34.1870°, 75.2450°, 83.9991°, and 92.5980° and is present mostly in these planes as in marble dust. Hematite, which is a new compound present in the composite appeared in the planes 012, 214, and 300 mostly and the relative peaks are present at the angles 41.2996°, 48.1765°, and 57.9049°. As in the marble dust, both silica and quartz (silicon oxide) are present at the same planes 100 and 101, whereas their peaks are at the angles of 59.4256° and 70.7559° relative to the plane of appearance.
FTIR spectroscopy
In the evaluation process, the FTIR spectroscopy of raw marble dust and the composite powder is compared with the spectroscopy of raw potassium bromide and the comparison is plotted (Figure 5). It is clear that except a very few peaks, all the other peaks are the same in marble dust and composite powder. The presence of the alkene bond C–H is marked near the intensity of 3004 cm−1 in the composite powder. 18 A medium peak at 2883 cm−1 in both the samples indicates the presence of alkane by the methyl C–H stretch. 19 Calcite (CaCO3) confirms its presence in both the marble dust and the composite powder by a medium peak of C–O harmonic bond at 2535 cm−1. 18 The strong double bond of carbon and oxygen O=C=O at 2343 cm−1 is the indication of the presence of carbon dioxide (CO2) in marble powder. 20 Some amount of aldehyde present in both the samples, which show strong peaks of C=O at 1731 cm−1. 19 A medium peak at 1458 cm−1 indicates the presence of CH2 bend in the marble dust. 19 The C–O at 1270 cm−1 represents the alkyl aryl ether in both the samples. 19 Aliphatic fluoro compounds are present in both the samples as C–F stretching, indicated by the presence of peak at 1134 cm−1. 19 In the composite a strong peak at 1056 cm−1 represents amine as C–N stretching. 19 The presence of aromatic phosphate (POC stretch) is indicated by the peak at 879 cm−1. 18 A strong peak nearby 758 cm−1 is the indication of the presence of aliphatic chloro compounds (C–Cl stretch) in marble dust as well as in the composite. 19 In both the compounds, the presence of chlorine is found at the peak nearby 397 cm−1. 21 The hazy structure in between 1300 cm−1 to 1000 cm−1 indicates the C–C vibration. 19

FTIR spectroscopy of marble dust and composite powder.
Particle size analysis
The marble dusts are categorized as small, fine, and very fine after sieving. From the particle size analysis, the diameter of particles of very fine lot of marble dusts are found to be between 0.85 µm and 200 μm. But since 90% of them are at 58 μm, the average particle size of this lot is recorded as 58 μm. Similarly, the average particle size of marble dusts of fine and small lots is found as 110 and 155 μm, respectively.
Mechanical characterization
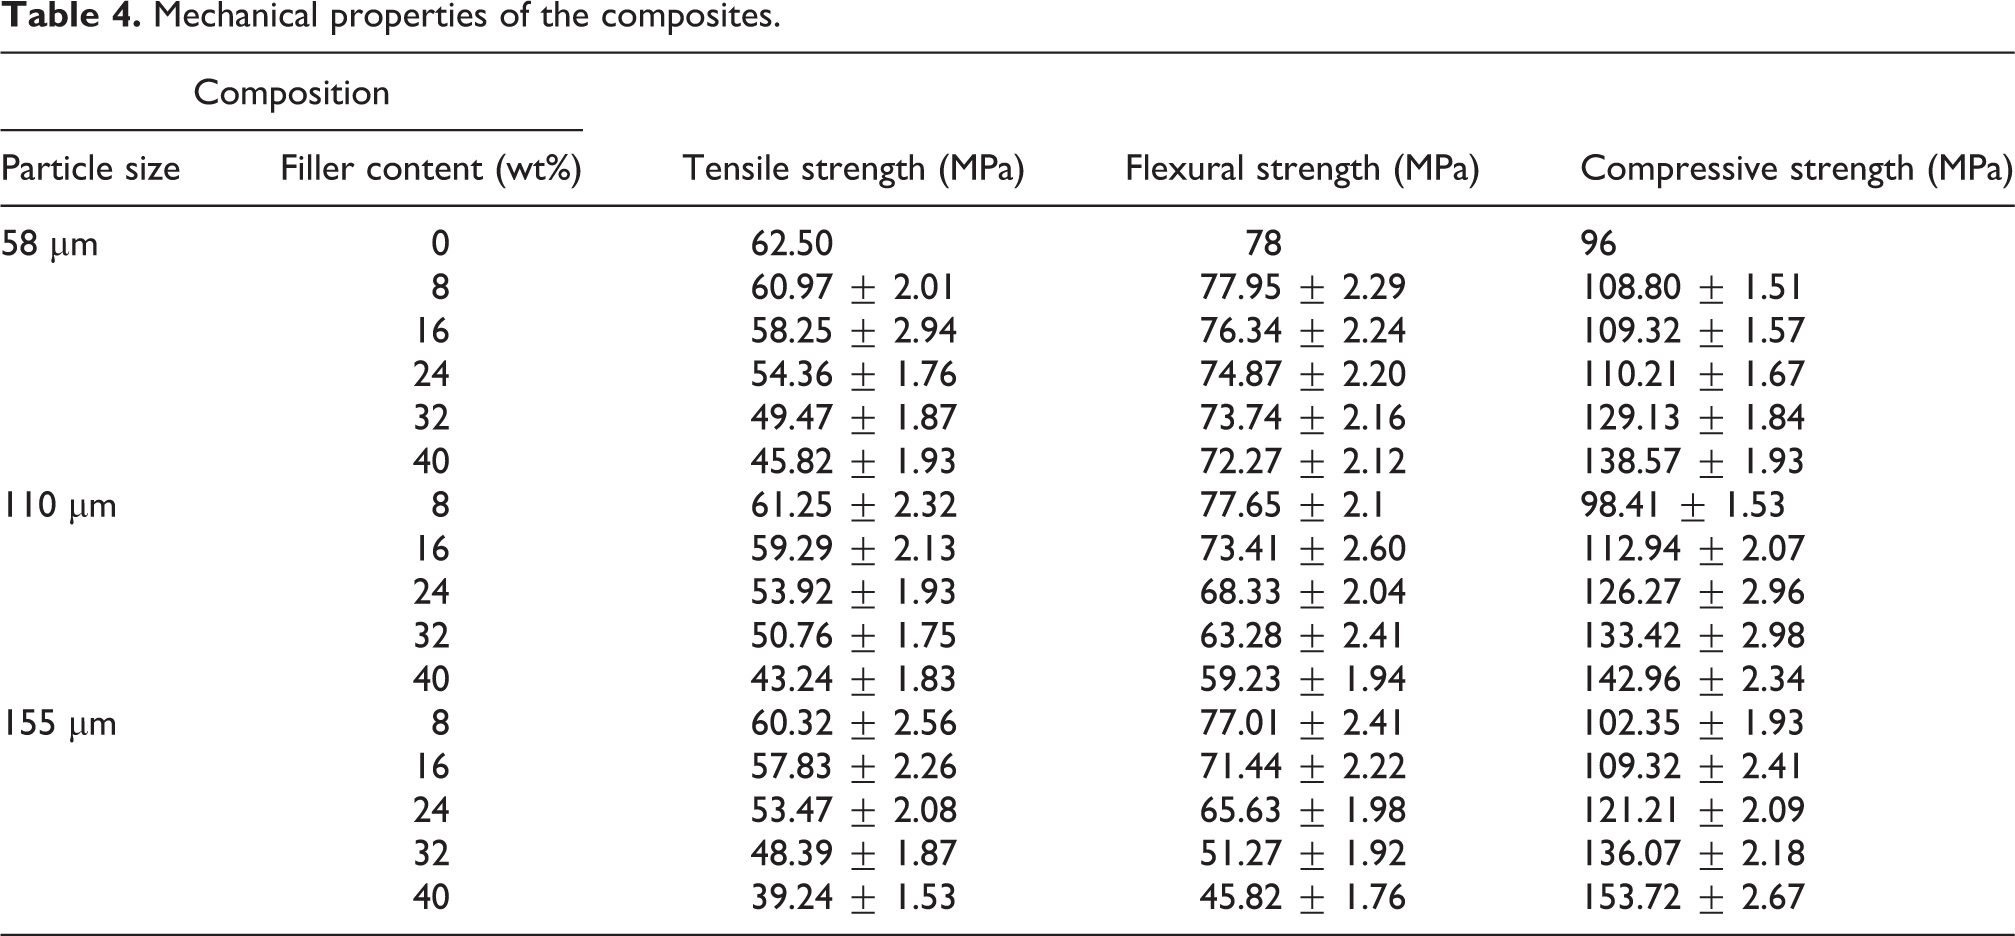
A range of property data have been generated through various characterization tests with regard to the tensile, flexural, compressive, and impact strength of the composites filled with micro-sized marble powder of different sizes and proportions. The test results are presented in Tables 4 and 5.
Mechanical properties of the composites.
Mechanical properties of the composites.

Tensile strength and tensile modulus
Figure 6 shows the variation of measured tensile strength of the composites with filler size and content. From the figure, it is clear that the tensile strength of the composites reduce gradually with the increase in filler content irrespective of particle size. However, for any particular value of the filler content, the composite having fillers of smaller particles possess marginally superior tensile strength values. The reduction in strength at larger filler content might be attributed to the irregular shape of the marble powder particles giving rise to stress concentration effects. Further, it has been seen that the volume percentage of voids is increasing with the filler content, which might be another possible reason that reduces the interfacial bonding strength between the filler and the matrix causing the reduction in tensile strength. Similar observations have been reported by Purohit and Satapathy 22 for epoxy composites filled with Linz-Donawitz sludge and by Jena and Satapathy 23 for polyester red mud as well as glass–polyester composites filled with red mud.
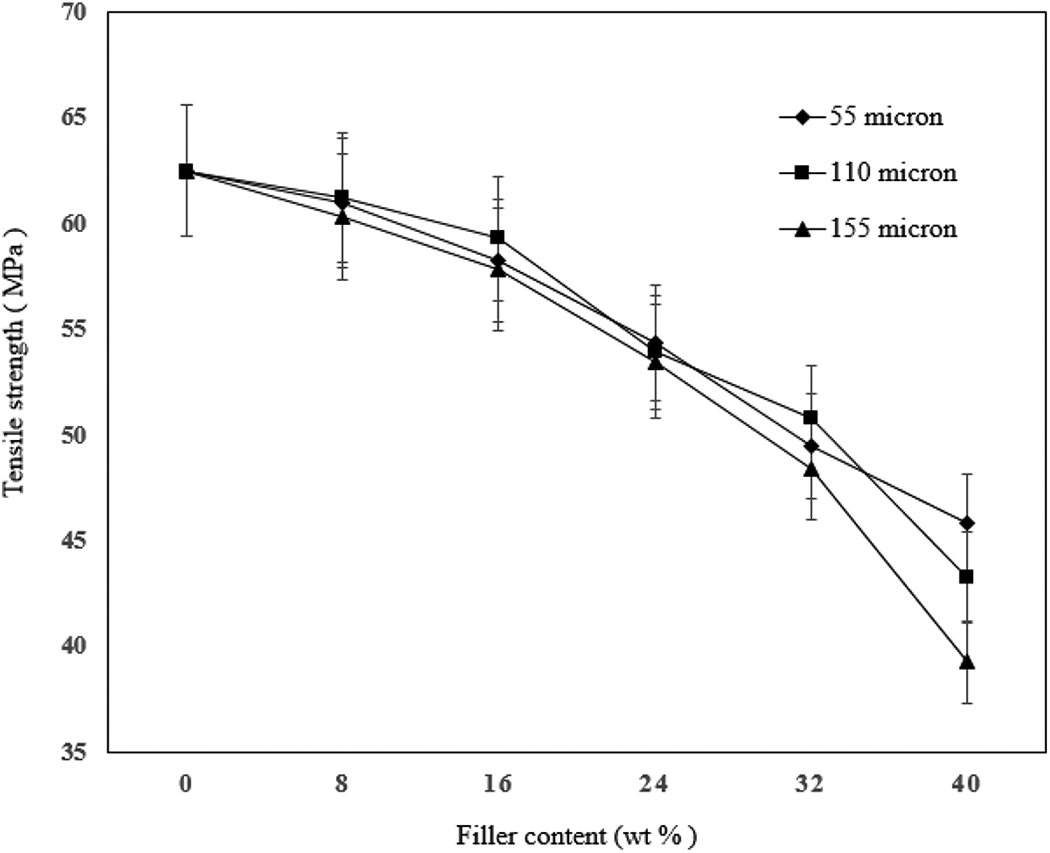
Tensile strength of the composites.
On the contrary, as far as the tensile moduli of the composites are concerned, it is noticed from Table 4 that there is an increasing trend with the weight fraction of marble dust in the composites. The increase in modulus indicates the reduction in the elongation of the composites with the increase in filler content. Kiran et al. observed the improvement in the tensile modulus of glass–polyester composites reinforced with different ceramic fillers. 24 Further, Nwanonenyi et al. reported that the tensile strength and moduli of the composites with larger filler size is lesser than the same composite with smaller filler size for equal composition. 25 Figure 7(a) and (b) shows the two typical SEM micrographs taken on the fractured surface of the polyester–marble dust composites during the tensile test.
(a and b) Morphology of the surface at which the tensile failure occurred.
Flexural strength and flexural modulus
The measured values of flexural strength and modulus of the polyester–marble dust composites of different compositions obtained from the three-point bending test are presented in Table 4. As in the case of tensile strength variation, the flexural strengths of the composites are also dropping gradually with the filler content and size as evidenced in Figure 8, which shows the variation of flexural strength. It is also noted that the rate of reduction in flexural strength is more pronounced for composites with higher filler content irrespective of the average particle size of the filler. As far as the flexural modulus is concerned, the trend of variation is found to be slightly different. It is found that the flexural moduli are improving up to a filler content of 8 wt% and beyond that they exhibit a decreasing trend. This trend is similar to composites embedded with filler particles of all the three different sizes. Recently in 2017, Purohit and Satapathy and, later in 2011, Jena and Satapathy observed the reduction in flexural strength of polymer composites with the incorporation of ceramic fillers. 22,23 However, the improvement in flexural modulus with the increase in filler percentage is reported by Kiran et al. 24 The flexural strength of the composites with smaller particle size is higher than the same composite with larger particle size for the same filler concentration. 25

Flexural strength of the composites.
Compressive strength
The variation in the strength of the composites in compression with respect to filler content is shown in Figure 9. From the figure, it can be clearly noticed that the compressive strength of the composites increases with the increase in filler content irrespective of the particle size. Although the strength did not vary in a proper trend with respect to the particle size of the filler still from the figure it can be concluded that the composites with fillers of larger particle size (155 μm) possess relatively higher strength in compression as compared to the composites with smaller particles. It is found that while the compressive strength of neat polyester is about 96 MPa, with the addition of 40 wt% of marble dust (155 µm size) it attains a value of 153 MPa indicating an improvement of about 60%. A similar observation is reported earlier by Agrawal and Satapathy. 26

Compressive strength of the composites.
Impact strength
The effect of filler content and particle size of the filler on the impact strength of the composites is shown in Figure 10. It is evident that the impact energy absorbing capacity of the composites increases with the increase in filler content. It is further noted that the composites with fillers of larger size possess higher strength compared to the composites having smaller fillers when subjected to impact loading. It is apparent that when the striker of the pendulum applies impact load on the composite specimen, a substantial amount of the impact is absorbed by the hard reinforcing particles (marble dust) which result in an increase in impact strength and it is obvious that this increment is proportional to the increase in filler content. In an investigation on glass–polyester composites filled with three different fillers, Kiran et al. observed a linear improvement in the impact strength of the composites for all the three fillers. 24 Nwanonenyi et al. also reported the improvement in the impact strength with the increase in filler content. 25
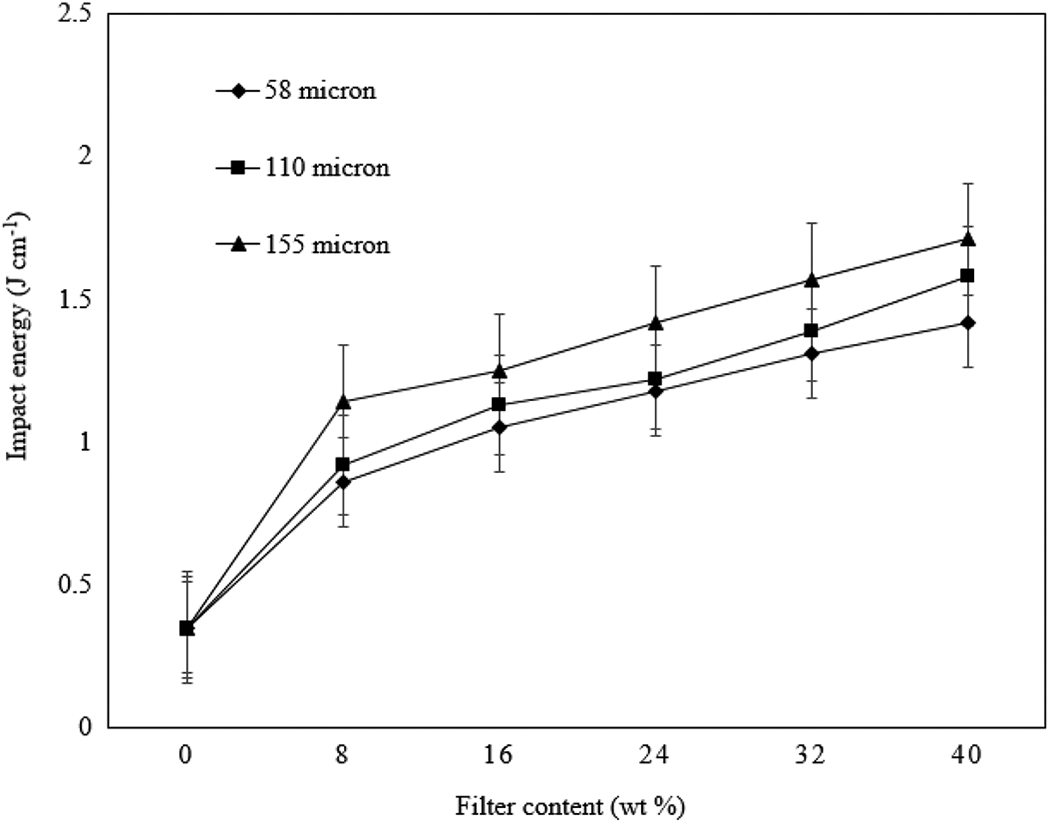
Absorption of energy by the composites during the impact loading.
Composite hardness
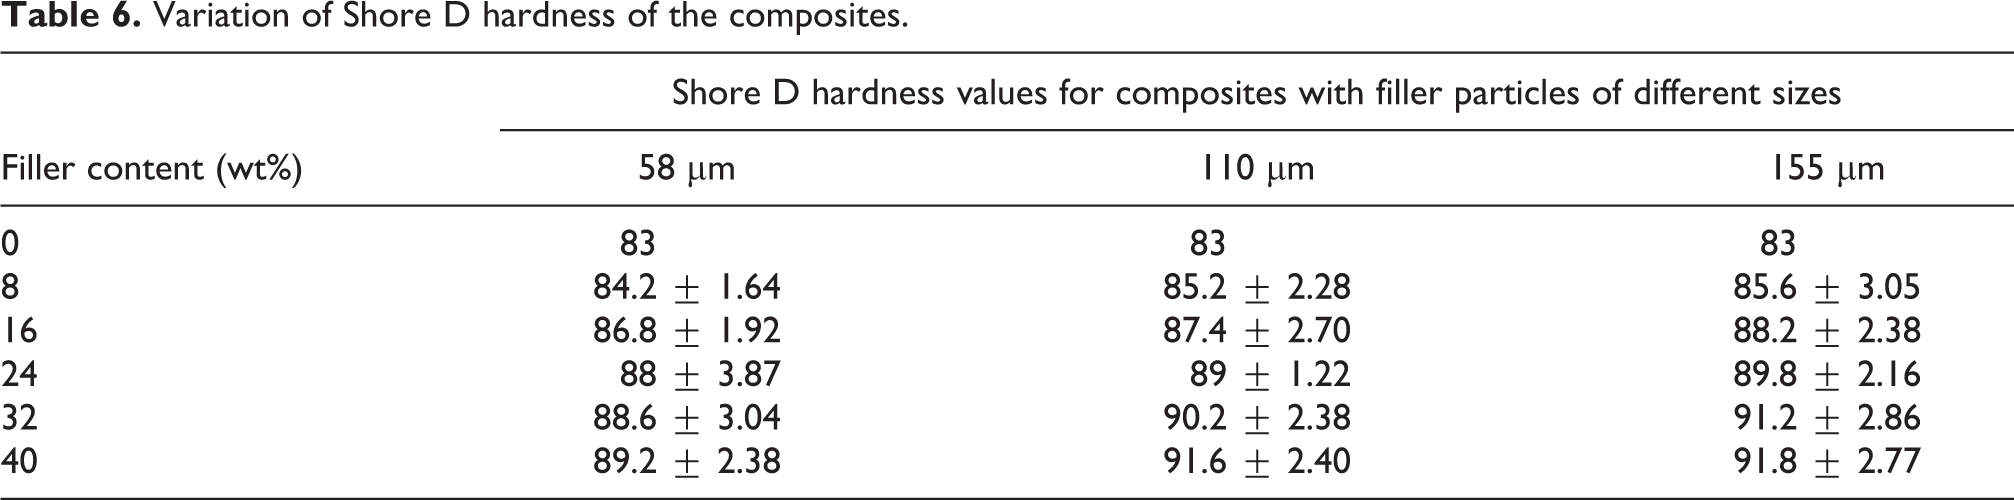
The measured Shore hardness values of the composites are presented in Table 6. It can be seen that the hardness of the composites of all the three categories increases significantly with the increase in filler content. For the hardened neat polyester, the Shore hardness value is found to be 83 and the maximum improvement is obtained for the composite filled with 40 wt% of marble dust having a mean size of 155 μm. This maximum hardness value is measured as 91.8, which is about 10.6% more than that of pure polyester. It can also be observed from Table 6 that in the case of the composites using marble dust of size 58 and 110 μm, the maximum hardness values obtained are 89.2 and 91.6, respectively. This indicates that the mean value of hardness of any particular composite is also affected by the particle size of the filler. Some similar observations recorded by past investigators are as follows: Çinar and Kar reported that the microhardness of polyethylene terephthalate–marble dust composites is increased with the increase in filler concentration as well as particle size. 13 Further, Salih et al. found an improvement in the Shore D hardness value of polyester composites filled with micro-sized copper and alumina powder. 27
Variation of Shore D hardness of the composites.
Conclusions
This study shows the successful fabrication of polyester-based composites filled with micro-sized waste marble dust through solution casting technique. While the tensile and flexural strengths decrease with the increase in marble dust content, improvements are noticed in the values of compressive and impact strength of the composites. Both the content and the mean particle size of the filler are found to be significantly affecting the strength properties of the composites. It reveals that the composite Shore hardness improves with the incorporation of marble dust. The presence of hard ceramic phases as identified by X-ray diffraction tests attribute to the improvement in the hardness of the composites. This work opens up a new avenue for gainful utilization of a construction waste like marble dust in the development of particulate-filled polyester composites. With lightweight, improved hardness, and good impact strength, these polyester–marble composites are expected to find potential use in wear-related engineering applications.
Footnotes
Declaration of conflicting interests
The author(s) declared no potential conflicts of interest with respect to the research, authorship, and/or publication of this article.
Funding
The author(s) received no financial support for the research, authorship, and/or publication of this article.