
Abstract
Acrylonitrile–butadiene–styrene (ABS) is a very significant and widely used amorphous thermoplastic which, on account of its importance in industry, multiplied billions of dollars are spent yearly in the United States alone, not to talk of the rest of the world. It is primarily utilized in industry and domestic situations due to its high damage resistance properties. This fact makes it a required exercise for serious and thorough research in this area to go ahead. In this article, the tension, compression, and bending response behavior of ABS material under various strain rate levels tests were investigated. Its characterization under tensile, compression, and other mechanical testing is thus quite important, to elicit ways of enhancing properties that would make the material or structures made from it, better in service. In the current phase, tension, compression, shear, and flexural samples were tested, because it is of interest to know how the longitudinal and shear loading damages propagate through the specimen length and thickness, and how the microstructure is affected from point to point, both laterally and depth-wise. The issues of energy transfer and dissipation are significant in terms of the effectiveness of this material as a damage retarder. Mat_187 nonlinear material model in Ls-Dyna was utilized to numerically evaluate the behavior of ABS under tension, compression, and three-point bending. The experimental results compared favorably to the numerical results.
Keywords
Introduction
Many contemporary thermoplastics can undergo extremely large plastic deformations due to relative motions of molecular chains to each other. 1 Withstanding large plastic deformations makes thermoplastics well suitable for such specific engineering applications where good impact resistance is highly demanded. 2 Nonetheless, the material behavior of thermoplastics subjected to loads is tremendously complex because their material behaviors are considerably influenced by strain rate and temperature. 3,4 Moreover, they behave differently in tension and compression indicating that hydrostatic pressure plays a significant role in their mechanical behaviors. 4 Additionally, thermoplastics experience strain softening followed by strain hardening observed in their stress–strain response under tension and compression. In the literature, many experimental studies related to the strain rate and pressure-dependent response of various thermoplastics under different stress states including tension and compression have been found. 2,5,6 For several years, deriving a constitutive model for the characterization of strain rate and pressure-dependent material behavior of amorphous thermoplastics and capturing their complex stress–strain features have been receiving a great deal of attention. Therefore, there have been many theoretical studies focused on developing reliable constitutive material; nevertheless, a further investigation is currently required. 7 -10 Because those theoretical material models have been developed based on experimental data obtained from either tension or compression tests. It is a fact that only knowing how thermoplastic materials act under either tension or compression does not reflect their actual material behaviors when they are subjected to multiaxial loads since they dictate tension, compression, and shear stress states simultaneously. Due to the lack of a reliable material model for the identification of actual material behavior of thermoplastics, experimental investigation and numerical validation become compulsory for robust design. Nonetheless, there have been still many open questions and difficulties for numerical predictions, 11 due to a lack of available convenient material models in finite element codes that enable them to capture their complex material behavior. For this reason, semi-analytical material models rather than constitutive material models in finite element codes grab attention for predicting the mechanical response of thermoplastics under different stress states.
Rubber particles that are randomly dispersed in the structure of acrylonitrile–butadiene–styrene (ABS) significantly improve its toughness and delay craze initiation leading to a large plastic deformation that the ABS can sustain. 12 -16 Therefore, characterization of its mechanical response under tension, compression, and other mechanical tests is very significant for reliable design. Although some studies have been devoted to numerically obtain the mechanical response of ABS under various stress states at different deformation rates, none of them has been quite successful to predict its response because material models utilized in their numerical implementations have not been capable of capturing the all deformation mechanisms of ABS. 2,17,18 This study focuses on the experimental investigation and numerical prediction of the mechanical response of ABS amorphous thermoplastic under tension, compression, and three-point bending at different deformation rates. In the experimental investigation, uniaxial tension, uniaxial compression, shear, and flexural tests were conducted under two distinct testing speeds of 0.005 mm s−1 and 0.05 mm s−1, respectively. From the experimentally obtained stress–strain curves for all three stress states, tension, compression, and shear, the effect of test speed on the yield stress of ABS was investigated. Additionally, the dissimilar material behavior between uniaxial tension and uniaxial compression was documented for both test speeds to illustrate the pressure dependence effect on the yield behavior of ABS. Mat-SAMP-1 (semi-analytical model for polymers) in Ls-Dyna was recently developed particularly for polymers and is capable of handling various loading cases, such as multiaxial and damage. 19 -21 In the numerical implementations of uniaxial tension and uniaxial compression tests, the strain rate-dependent response of ABS capturing strain-softening and strain-hardening features were predicted.
Materials and methods
Uniaxial tension test
Uniaxial tension tests were performed on ABS polymer in the MTS servo-hydraulic testing machine (MTS Systems Corporation, Eden Prairie, MN, USA) that possesses the load capacity of 97.8 kN depending on the ASTM D638-14 standard. 22 Depending upon the mentioned test method, five tension tests were conducted on ABS tension specimens for each elongation speed. The tension specimens were prepared as a dumbbell shape according to the ASTM D638-14 standard. The dimensional specification of the tension specimen is depicted in Figure 1. Throughout the tension tests, elongation speed was kept constant for both 0.005 and 0.05 mm s−1 elongation rates, respectively. Using an extensometer in acquiring data during the tensile tests of plastic materials is necessary because plastic materials exhibit a very small linear region that is formed immediately and nonuniform widths in a dumbbell-shaped specimen leads to a different elongation rate between the narrow section and the width of the dumbbell-shaped specimen. Therefore, the extensometer was mounted on the ABS tension specimens. In addition, the digital image correlation (DIC) method was utilized to measure true strains.

ABS tensile test specimen dimensions (t = 6 mm).
Uniaxial compression test
To characterize the mechanical behavior of ABS subjected to uniaxial compressive loads, compression tests were implemented using the crosshead speeds of 0.005 and 0.05 mm s−1, based on the ASTM D695-15 standard. 23 In our uniaxial compression tests, the prismatic shape was used and the preferred specimen dimensions are illustrated in Figure 2(a). Uniaxial compression test provides valid information related to homogenous compressive stress and its corresponding compressive strain, which is crucial for the usage of many engineering materials.

(a) Compression test specimen dimensions, (b) dimensions of three-point bending ABS test specimen, supports, and loading nose, and (c) shear test specimen dimensions.
Shear test
To establish a correlation between shear stress and shear strain, shear tests were conducted depending upon the ASTM D5379 standard. 24 The V-notched shaped shear specimen is used by this method; therefore, the ABS shear specimens are prepared according to this method as illustrated in Figure 2(c). Shear strains for various deformation rates were measured through using DIC optical method.
Three-point flexural test
To investigate the material behavior of ABS under flexural loads, three-point bending tests were performed with two different bending test speeds of 0.005 and 0.05 mm s−1, respectively. Figure 2(b) indicates the dimensions of three-point bending ABS specimen, supports, and loading nose taken from the ASTM D790 standard. 25 Load–displacement curves for each bending test speed was acquired successfully.
Finite element analysis
Numerical implementations of thermoplastic materials to predict their mechanical response subjected to different types of loading conditions such as tension, compression, shear, and impact has been a great deal of interest for robust design. 26,27 A semi-empirical material model for polymers (SAMP-1) that is recently developed by Kolling et al. 28 can take all effects, except temperature on the material behavior of thermoplastics into account. This material model generates a convex yield surface by using the uniaxial tension, uniaxial compression, shear, and biaxial tension true plastic stress–true plastic strain curves as tabulated data. Utilizing both compression and shear data with tension data as input in Mat-SAMP-1, it generates the SAMP-1 yield surface formulation for calculations. There are no fracture criteria and biaxial tension test date taken into account in any numerical simulations. The nonassociated flow rule in Mat-SAMP-1 is used in all simulations. The constant plastic Poisson’s ratio dictates the associated flow; however, many thermoplastic polymers exhibit nonassociated flow indicating that the plastic Poisson’s ratio changes with plastic strains. For this reason, while the plastic Poisson’s ratio distribution for the test speed of 0.005 mm s−1 was taken from the literature, 2 the plastic Poisson’s ratio distribution for test speed of 0.05 mm s−1 was estimated from the formula provided in literature. 28 Hence, the obtained and estimated plastic Poisson’s ratio distributions were employed in the model in terms of corresponding plastic strains. Uniaxial tension yield stresses versus corresponding plastic strain curves were introduced in the model for both test speeds of 0.005 and 0.05 mm s−1 in all numerical simulations.
Uniaxial tension
Solid element formulation (ELFORM1) with the stiffness form of hourglass stabilization was utilized in the tension simulations. Stiffness-based hourglass control is quite helpful to avoid negative volume error and physically unreal hourglass energy modes. Test speeds attained in actual tension tests were assigned to the right end grip part of the tension specimen in terms of elongation and the opposite end was fixed in all directions with boundary conditions. The resulting stresses and corresponding strains were taken from the elements along the cross-section where the necking was observed. Stresses and corresponding strains were averaged along the cross-section. In the numerical implementations of uniaxial tension tests, the elastic properties and plastic material properties as a function of strain rate for ABS are tabulated in Table 1 and illustrated in Figure 3(a), respectively. Also, the plastic poison’s ratio measured with DIC during uniaxial tension test under the lowest strain rate was used as an input.
Elastic material properties of ABS used in the simulations of uniaxial tension tests.
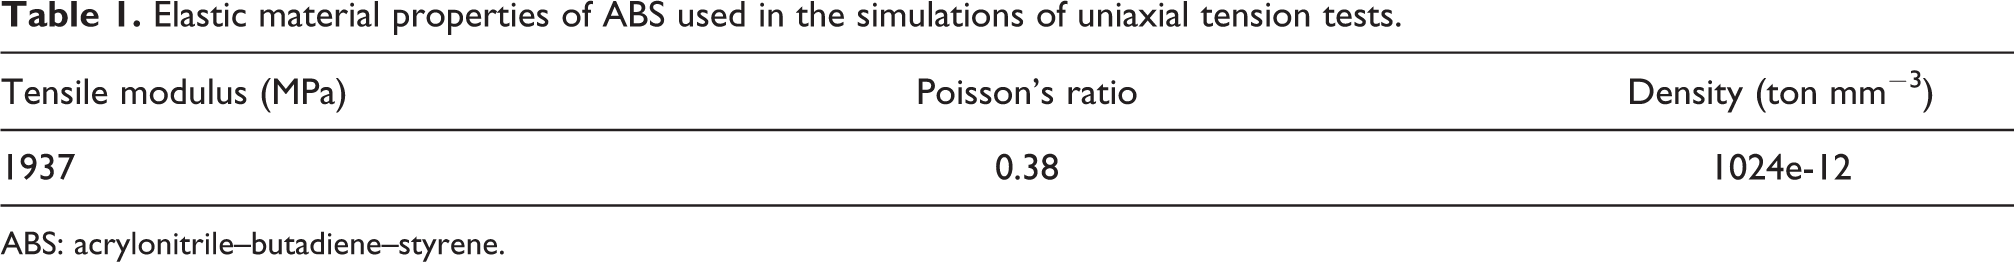
ABS: acrylonitrile–butadiene–styrene.

The experimental data as an input for SAMP-1 material model: (a) tensile simulation, (b) compression simulation, and (c) and (d) flexural simulation.
Uniaxial compression
Both upper and lower compression platen was modeled as a rigid body by employing the appropriate material properties. The lower platen was fixed and the upper platen was allowed to move only in compression direction up to 20 mm that corresponds to the maximum compression displacement in the uniaxial compression experiments. The automatic general contact type was used between the platens and the compression specimen. During the numerical analysis of compression, elements undergo extremely large deformations which lead to numerical instabilities or negative volume error. To minimize them, using a contact interior option of Ls-Dyna that imposes internal contact between elements is highly recommended. Therefore, the contact interior option was employed in the model. For the simulations of compression tests, the experimental test data shown in Figure 3(b) were used in SAMP-1 as input data implying that Drucker–Prager yield surface and nonassociated flow formulations are taken into account. In contrast to finite element modeling of uniaxial tension tests, we did not define any strain rate dependence through multiple tension stress–strain curves as a function of strain rate since uniaxial compression test imposes homogenous stress state; therefore, each compressive true stress–true strain curve experimentally obtained from each deformation rate were separately utilized in simulations. Using at least one tensile stress–strain curve is required in SAMP-1. For this reason, we used only one tensile stress–strain curve obtained from the quasi-static uniaxial tension test. Additionally, plastic Poisson’s ratio as a function of plastic strain obtained from a quasi-static tension test was introduced to our material model as illustrated in Figure 3(b). Under pure compression, SAMP-1 accepts the variation of plastic Poisson’s ratio with negative plastic strains.
Three-point flexural test
The finer mesh was used in the contact regions between the supports, loading nose, and ABS specimen to increase the contact accuracy. Six elements were used through the thickness. Both the supports and loading nose were modeled as a rigid body. Automatic surface-to-surface contact formulation with a pinball algorithm that helps to achieve proper contact for spherical surfaces was used to obtain the contact forces. A rigid body displacement motion was applied to the loading nose that was moved up to 20 mm in the bending direction. The exact test speeds attained in three-point bending tests were directly dictated to finite element modeling of the loading nose, as a result of distinct speeds of loading nose, different strain rate deformations were accomplished. The SAMP-1 yield surface formulation for predictions was assigned by means of utilizing experimental test data shown in Figure 3(c) and (d) as an input in SAMP-1. The experimental test data include multiple tensile true stress–strain curves to capture strain rate dependency, the quasi-static compressive stress–strain curve to obtain pressure dependency, and the quasi-static shear stress–strain curve to possess the SAMP-1 yield surface formulation.
Additionally, the nonassociated flow was considered. Based on the resulting strain rate during deformation, the material model SAMP-1 takes the appropriate tension test data given as a function of strain rate into account. This material model considers the tension test data with the lowest strain rate as quasi-static and assumes that compression and shear test data are obtained under the same rate deformation of tension test data with the lowest strain rate provided to the material model. Hence, the SAMP-1 linearly increases the compressive and shear yield surfaces based on the produced strain rate during deformation. In other words, whatever the ratio between quasi-static tension true yield stress and the corresponding yield stress based on the strain rate obtained during deformation, the compressive and shear yield surface is increased with the same ratio. If the resulting strain rate is between two given tension test data as a function of strain rates, the model uses linear interpolation to derive the tensile true plastic stress–true plastic strain curve. To figure out the effect of different material behavior between tension and compression on the mechanical response of ABS under three-point bending, the compression and shear test data were removed from Mat-SAMP-1 that leads to the Von-Misses yield surface formulation.
Results
Experimental results
Uniaxial tension response
The strain rate response of ABS was achieved by the implementations of uniaxial tension tests under two different strain rates ranging from low to moderate and true stresses were plotted against corresponded true strains for each strain rate as shown in Figure 4. It can be concluded that the fracture behavior of ABS is brittle; therefore, necking areas for all strain rates are barely distinguishable. Additionally, after uniaxial tension tests, the natural color of ABS throughout the gage length turned into a light white color under all strain rates indicating that microvoid formation took place due to the movements of chain macromolecules during deformation. It can be deduced that intrinsic yield drop that is followed by strain hardening occurs within a very small range of strains showing that necking is instantly stabilized. DIC measurements for tensile true principal strain for ABS at the strain rate of 1 × 10⁻⁴ s−1 and 1 × 10⁻³ s−1 are illustrated in Figure 5(a) and (b). Although the imposed deformation rates on ABS during tension tests lead to the identical feature in stress–strain curves of ABS, its elastic and plastic material properties are affected. An increase in the tensile elastic modulus and post-yield point of ABS is observed with the increased strain rate. The increment in the post-yield stress of ABS with the enhanced strain rate is more considerable than the increment in its tensile elastic modulus.

Comparison of experimental true tensile stress–strain curves for two strain rates.
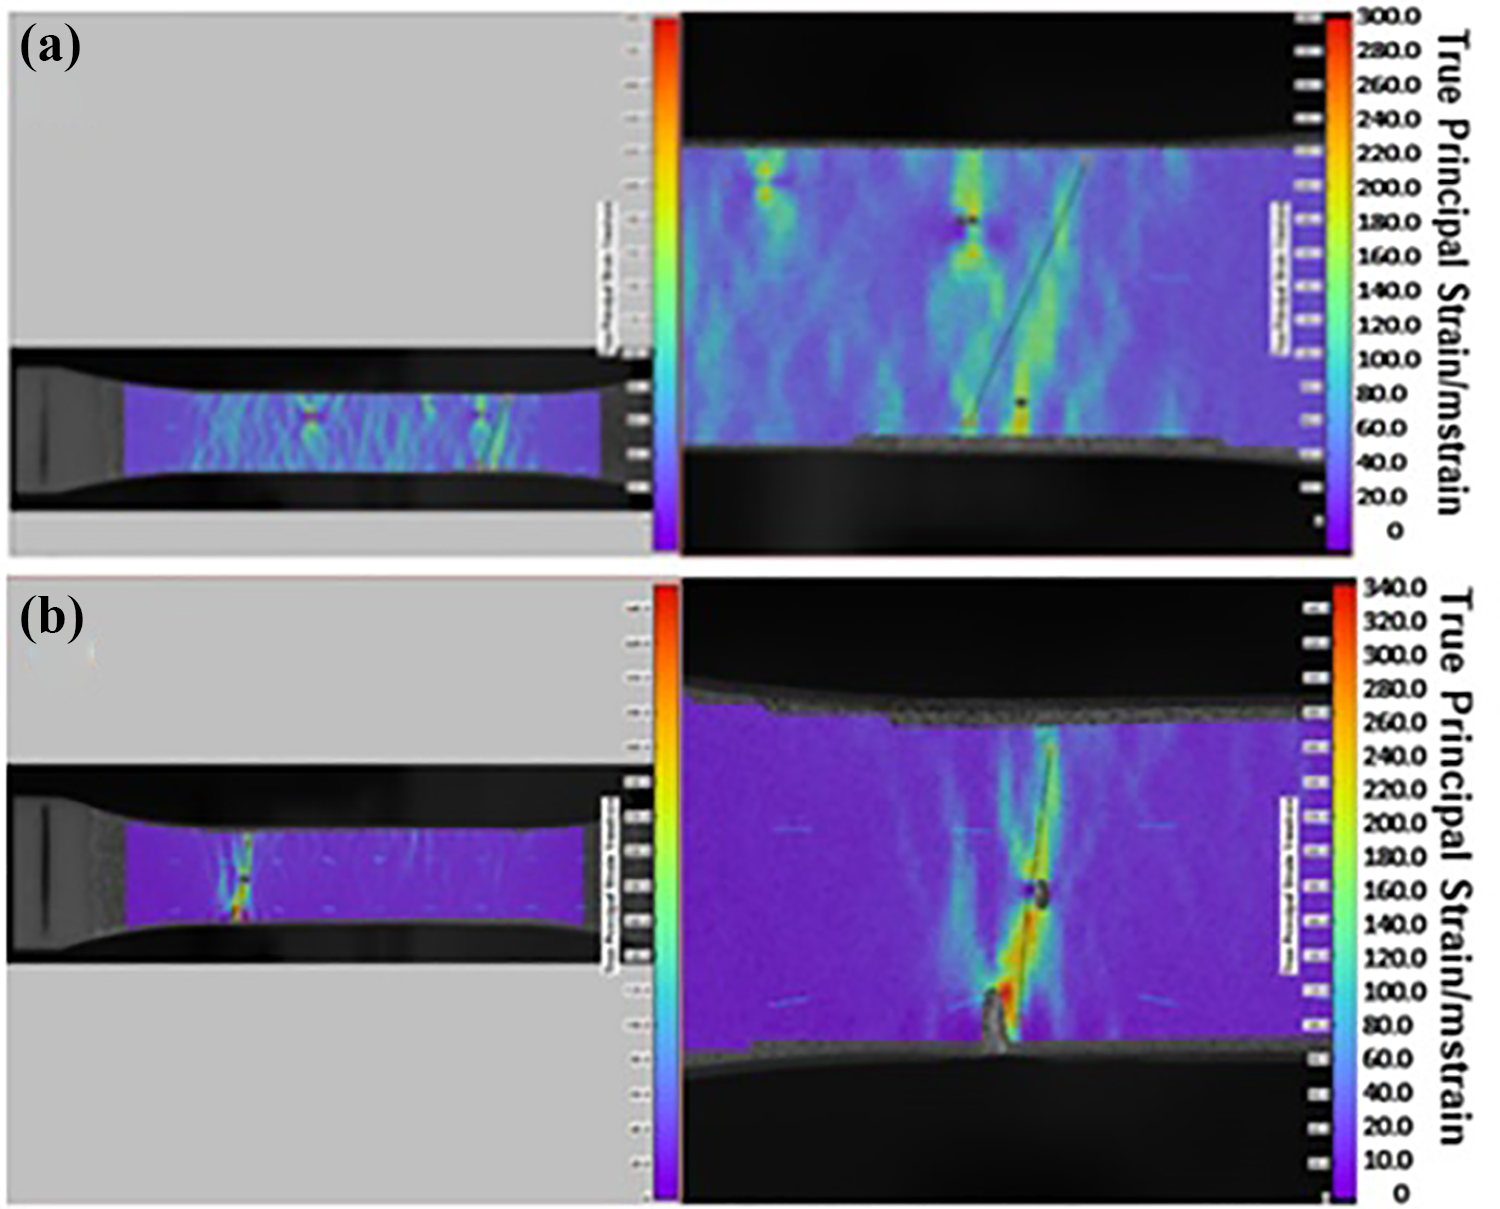
DIC tensile true principal strain for ABS at strain rates (a) 1 × 10⁻⁴ s−1 and (b) 1 × 10⁻³ s−1.
Uniaxial compression characteristics
Compressive strain-rate-dependent material behavior of ABS was investigated by conducting compression tests at two distinct strain rates similar to tensile tests. The measured compressive true stress–true strain curves of ABS were reported for each compressive strain rate and favorably compared to one another to examine the strain rate influence on the material behavior of ABS. The comparative plot is shown in Figure 6. In contrast to tension tests, there is no color change observed in compressed ABS specimens for any attained strain rate explaining that microvoid formation does not take place in ABS subjected to compression. It can be stated that the features of the tensile true stress–strain curves are generally identical with the compressive curves, but intrinsic yield drop is more drastic under tension compared to compression. Compressive yield stress and compressive elastic modulus were found to be always larger than the tensile yield stress and tensile elastic modulus. Compared to the strain rate effect on material properties of ABS under tension, it can be deduced that the elastic and plastic material properties of ABS are more drastically affected under compression resulting that the strain-rate-dependent material behavior of ABS is more sensitive to compression.

Comparison of experimental compressive stress–strain curves of ABS for two different compression speeds.
True stress–true strain curves of ABS obtained from uniaxial tension and uniaxial compression tests at identical strain rates were illustrated for the comparison purpose in Figure 7(c). The ultimate compressive plastic strains were taken as equal to the tensile ultimate strains of each strain rate for a closer view of comparisons. Otherwise, ABS undergoes larger plastic strains than under uniaxial tension. Pressure influence on yield stresses and elastic modulus of ABS can easily be recognized from Figure 7(c). From Table 2, it can be deduced that the compressive strength of ABS is about 20% higher than the tensile strength. Regarding compressive and tensile initial stiffness or elastic modulus of ABS, the compressive elastic modulus is always higher than the tensile modulus in each strain rate.

DIC true tangential shear strain: (a) 0.005 mm s−1 and (b) 0.05 mm s−1; (c) comparison of tensile true stress–strain curve with compressive stress–strain curve at same strain rate (quasi-static); (d) comparison of experimental shear stress–strain curves; and (e) comparison of experimental flexural load–displacement curves.
Comparison of tensile yield stress and tensile elastic modulus of ABS with compressive yield stress and compressive elastic modulus under the same strain rates.
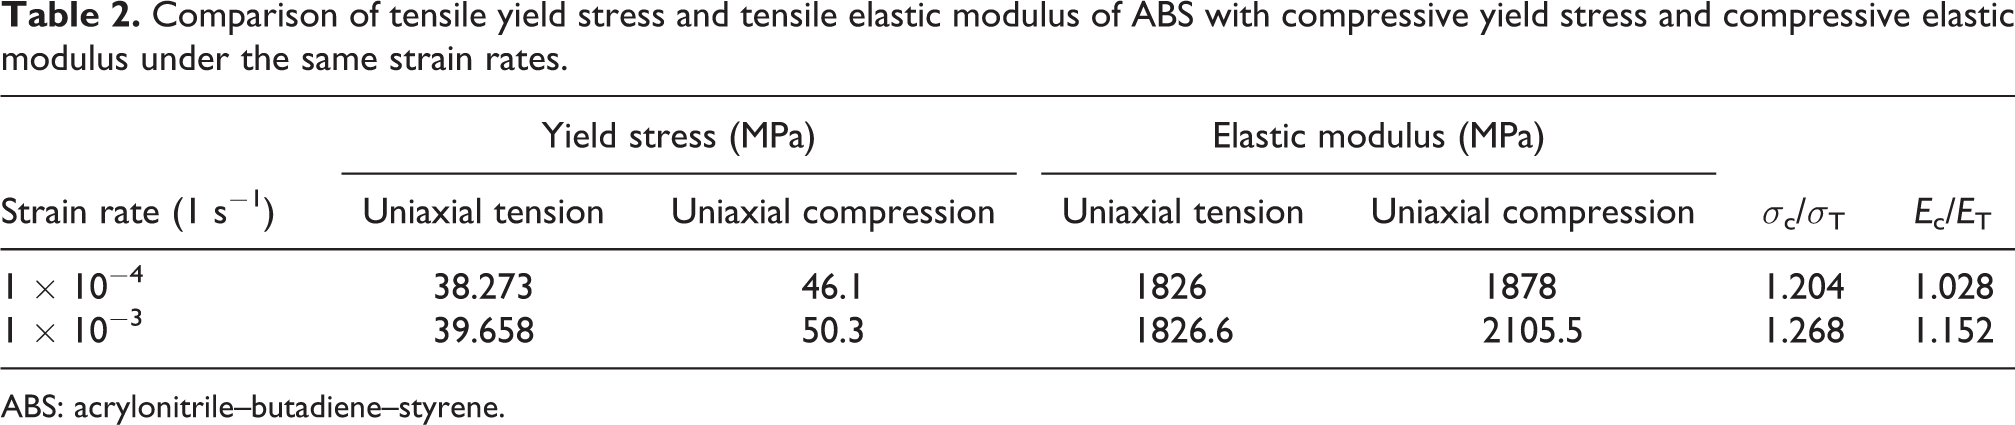
ABS: acrylonitrile–butadiene–styrene.
Shear behavior
To examine the strain-rate-dependent shear response of ABS, shear tests were carried out by the use of the Modified Wyoming Iosipescu shear test method (ASTM D5379) at two distinct shear strain rates. As expected, a shear fracture was not observed in ABS. An increased shear strain rate leads to an increase in shear yield stresses of ABS as shown in Figure 7(d). Like yield stresses in uniaxial tension and uniaxial compression, shear yield stresses of ABS increase hyperbolically with shear strain rate as seen in Figure 7(d). The feature of shear stress–strain curves of ABS at two shear strain rates is identical to each other. However, in contrast to uniaxial tension and compression, the shape of shear stress–shear strain curves change with shear strain rate. Shear strain distributions for two dictated deformation rates during shear tests measured through DIC are illustrated in Figure 7(a) and (b).
Flexural behavior response
Mechanical response of ABS to flexural loads with two deformation rates, that is, is 0.005 and 0.05 mm s−1 was evaluated by means of three-point bending tests. ABS material was forced to be simultaneously subjected to the various stress states such as tension, compression, and shear through three-point bending tests. The dictated stress states by three-point bending tests with different deformation rates reflect the actual material behavior of ABS because it covers all material aspects of ABS, including strain rate dependence and different behavior in tension and compression as well as shear. The feature of load–displacement curves is similar in each deformation rate as shown in Figure 7(e).
Finite element results
Uniaxial tension
Elastic and plastic material properties of ABS obtained from uniaxial tension tests under different strain rates were used in the numerical implementations of uniaxial tension tests. Mat-SAMP-1 uses only constant tensile elastic modulus for all strain rates. Our material model selects the tabulated data that is defined as a function of strain rate based on corresponded strain rate produced by deformation speed. After numerical implementations of uniaxial tension tests carried on ABS, corresponded strain rates were numerically extracted for their actual deformation rates, that is, 0.005 and 0.05 mm s−1. It was found that the Ls-Dyna simulation with Mat-SAMP1 material captures the necking and rupture region in congestion with the experimental samples. The comparison between experimental and simulation true tensile stress versus strain curves at elongation speeds of 0.005 and 0.05 mm s−1 are shown in Figure 8(a) and (b). An excellent correlation was found between the experimental and simulation results. The simulation results were able to successfully capture every aspect of the experimental curves, that is, strain rate dependency, the intrinsic drop in the stress values after the yielding, hardening in the plateau region of the tensile response.
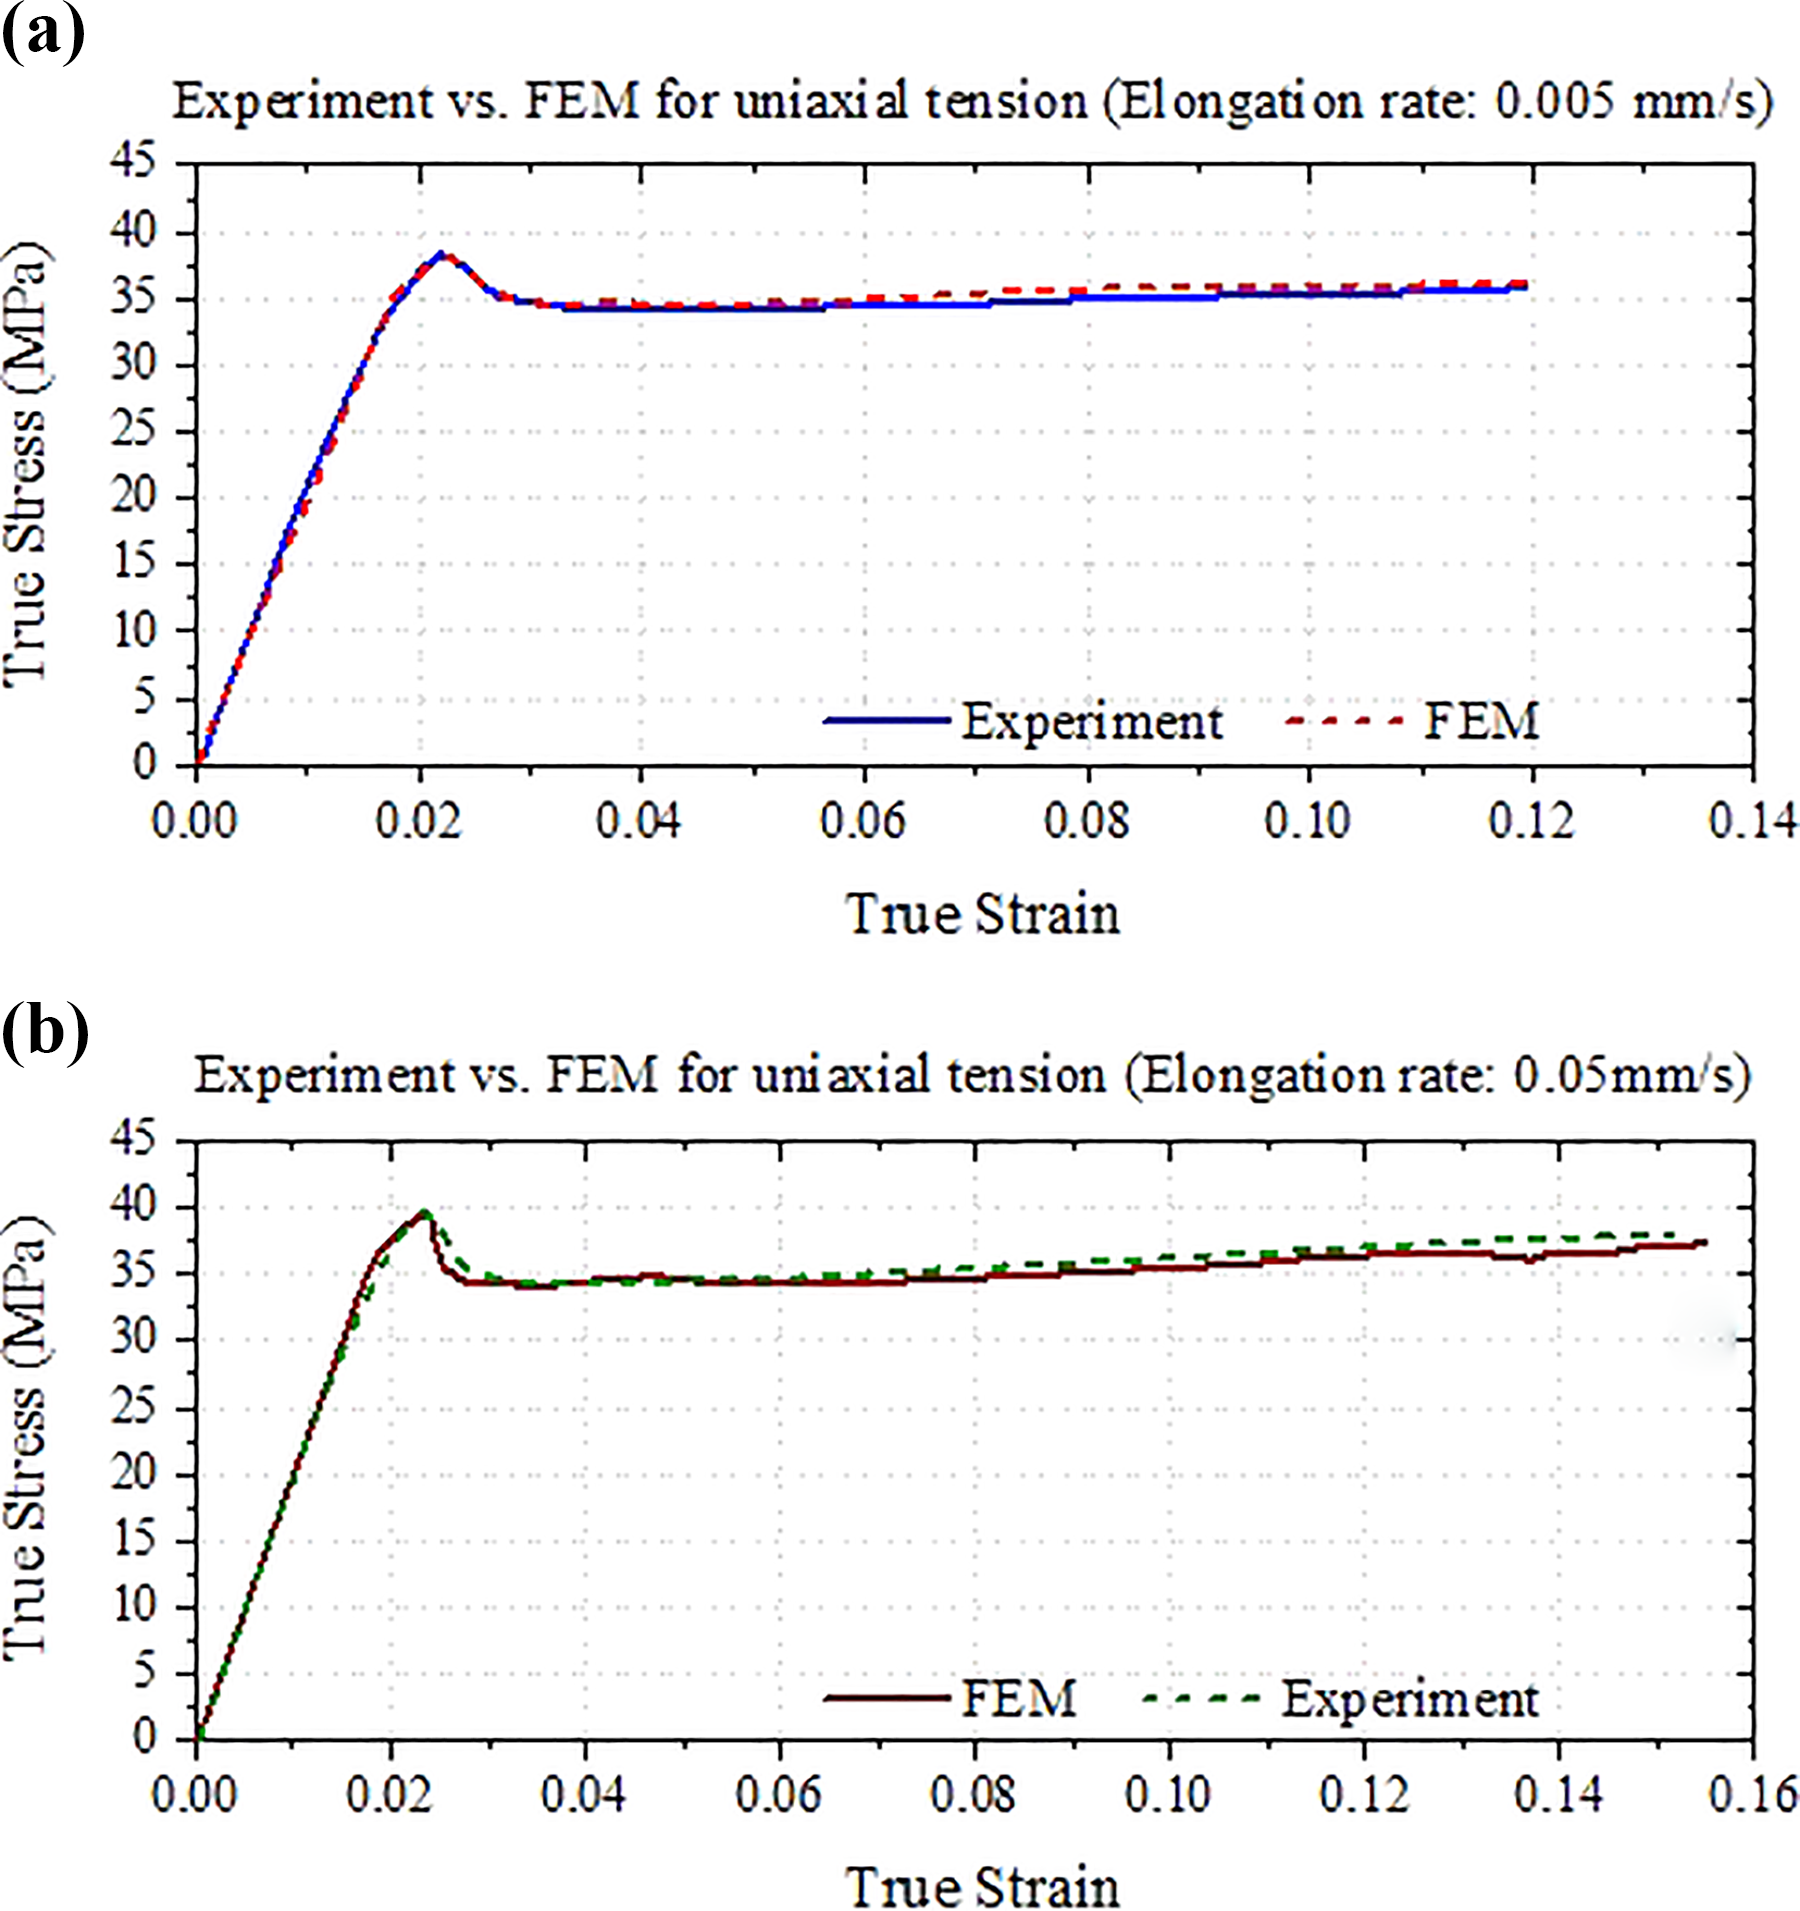
Comparison of experimental tensile true stress–true strain curve with predicted curve at different elongation speeds: (a) 0.005 mm s−1 and (b) 0.05 mm s−1.
Uniaxial compression
The comparison between experimental and simulation true compressive stress versus strain curves at elongation speeds of 0.005 and 0.05 mm s−1 are shown in Figure 9(a) and (b). SAMP 1 material model is highly capable of capturing compressive stress–strain features of ABS including strain-softening and strain-hardening regions as shown in Figure 9(a) and (b). However, the elastic region of ABS for a deformation rate of 0.05 mm s−1 was not captured properly by the material model because this material model uses the constant elastic modulus, regardless of a strain rate.

Comparison of experimental and numerical compressive stress–strain curves for different compression rates: (a) 0.005 mm s−1 and (b) 0.05 mm s−1.
It is a fact that the elastic modulus of ABS changes with strain rate. Moreover, the elastic modulus of ABS in tension and in compression is not identical that is not considered by the SAMP-1 material model.
Three-point bending
The correlation between the experimental and the simulation results for three-point bending load–displacement curves at speed of 0.005 and 0.05 mm s−1 are shown in Figure 10(a) and (b), respectively. The simulation results were found to be slightly higher than that of experimental results at a loading rate of 0.05 mm s−1. Similar to the compression test simulations, SAMP-1 was not able to predict the response of ABS in an elastic region under three-point bending as shown in Figure 10(a) and (b). Using the constant elastic modulus regardless of a change in elastic modulus with strain rate causes an improper prediction in elastic response. This improper elastic response prediction can play a more significant role at higher deformation rates. SAMP-1 material model was well applicable to predict the actual mechanical response of ABS under three-point bending in terms of peak load and corresponding displacement. Von-Misses yield surface formulation that assumes the same material behavior between tension and compression always predicts the response of ABS less than the actual ones as tabulated in Table 3 because ABS is much stiffer in compression than in tension and this different material behavior should be taken into account in numerical predictions.

Comparison of predicted three-point bending load–displacement curve with experimental curve under different deformation speeds: (a) 0.005 mm s−1 and (b) 0.05 mm s−1.
Comparison of experimental and numerical peak loads of ABS for various deformation rates under three-point bending loading.

ABS: acrylonitrile–butadiene–styrene; SAMP: semi-analytical model for polymers.
Concluding remarks
The elastic modulus and yield stress of ABS increase with an increasing deformation rate under all three stress states: uniaxial tension, uniaxial compression, and shear. However, an enhancement in elastic modulus and yield stress of ABS is larger under compression than tension and shear concluding that the strain-rate-dependent material behavior of ABS is more sensitive to compression. Under both uniaxial tension and uniaxial compression, ABS exhibits a strain-softening behavior that can be deduced from the noticed sudden drop in the true stress–true strain curves for both loading speeds. Nonetheless, the intrinsic yield drop in the tensile stress–strain curve of ABS is larger and sharper than in compression. For each deformation rate, uniaxial compression always yields larger yield stress for ABS. The compressive yield strength of ABS is about 20% higher than its tensile strength. Due to the increment in elastic modulus and yield stress of ABS with deformation rate, ABS acts stiffer under three-point bending with improving bending speed. Although SAMP 1 material model predicted and captured the strain rate-dependent response and complex stress–strain features of ABS including strain softening and strain hardening under tension and compression, respectively, the strain rate-dependent response in the elastic region under compression was not captured properly by SAMP-1. Utilizing a constant elastic modulus in SAMP-1 is the explanation of this improper prediction that can be more significant at higher deformation rates than used in this study. Hence, a more enhanced material model that accounts for the elastic modulus change with strain rate is highly needed.
Footnotes
Declaration of conflicting interests
The author(s) declared no potential conflicts of interest with respect to the research, authorship, and/or publication of this article.
Funding
The author(s) received no financial support for the research, authorship, and/or publication of this article.