
Abstract
This article reports the fabrication of pH-sensitive microbeads from sodium alginate (SA) and modified karaya gum (KG). KG was modified by graft copolymerization using 2-hydroxyethyl methacrylate (2-HEMA) through in situ free radical polymerization reaction. The graft copolymer was blended with SA to develop microbeads by a simple ionotropic gelation technique. The microbeads were characterized by Fourier transform infrared spectroscopy, X-ray diffraction, differential scanning calorimetry, thermogravimetric analysis, and scanning electron microscopy. The effect of %HEMA and polymer blend ratio on the swelling capacity was investigated. Drug release kinetics of the microbeads was investigated under both pH 7.4 and pH 1.2 at 37°C. The drug release kinetics was analyzed by evaluating the release data using different kinetic models.
Introduction
Polymers (biodegradable and synthetic) are widely used in drug delivery because of their abundance in nature, biocompatibility, low toxicity, and biodegradability. Controlled novel drug delivery systems have been attracted for the past few decades. Among various controlled release carriers, polymer interpenetrating polymer network (IPN) hydrogel microbeads have shown much interest due to their unique properties such as particle size, phase stability, huge tendency to absorb water, and mechanical strength. Hydrogels have many advantages over other biomedical carriers because of their ability to swell under physiological conditions. 1 -6
2-Hydroxyethyl methacrylate (HEMA) copolymer-based hydrogels have been much interest in biomedical applications because of their hydrophilic character, nontoxicity, non-antigenic properties, and good biocompatibility. 7 -11 The presence of hydroxyl and carboxyl groups in poly hydroxyethyl methacrylate (pHEMA) makes compatible with water, whereas the hydrophobic methyl groups and backbone impart hydrolytic stability to the polymer and support the mechanical strength of the polymer matrix. Poly HEMA hydrogels are resistant to high temperatures, acids, and bases. Hence they are stable against thermal and chemical reactants. Therefore, pHEMA hydrogels are suitable for the development of controlled drug delivery systems. 12 -14
Karaya gum (KG) is an acidic polysaccharide obtained from different sterculia species. KG is a branched polysaccharide that consists of
Sodium alginate (SA) is a nontoxic polysaccharide comprising of 1→4 linked β-(
D-penicillamine (D-PA; Figure 1) is a chelating agent used in the treatment of Wilson’s disease and rheumatoid arthritis for several decades. 25,26 It has particularly a high affinity for copper (Cu) through its electron donor groups and forms penicillamine—metal complexes that are readily solubilized in water and then excreted in the urine. These actions result in increased urinary excretion of Cu and an overall negative balance for Cu in the body. 27,28

Chemical
In the current work, 2-HEMA-grafted KG/SA (2-HEMA-g-KG/SA) microbeads were prepared through in situ free radical polymerization (Figure 2). The microbeads were characterized using Fourier transform infrared (FTIR), differential scanning calorimetry (DSC), X-ray diffraction (XRD), thermogravimetric analysis (TGA), and scanning electron microscopy (SEM). In addition, swelling studies and drug release kinetics of the microbeads have also been reported. The main objective of the present work was to investigate the possibility of using 2-HEMA-g-KG/SA microbeads for an extended and controlled delivery of D-PA.

Schematic representation of SA/KG-g-HEMA blend microbeads.
Experimental
Materials
KG and HEMA are purchased from Sigma Aldrich (Powai - I. I. T, Mumbai, Maharashtra-400076, India). SA and calcium chloride were purchased from Sd. Fine chemicals, Mumbai, Maharashtra, India. D-PA gift sample from Suven Life Sciences Ltd, Hyderabad, Telangana, India. Water used was of high purity grade after double distillation.
Synthesis of KG-g-HEMA/SA semi-IPN microbeads
The graft polymerization of KG with 2-HEMA has been carried out by using potassium persulfate (K2S2O8) as initiator and N,N,N′,N′-Tetramethyl ethylenediamine (TEMED) as a catalyst. In brief, different amounts of KG (as given in Table 1) were dissolved in water overnight under constant stirring. The solution was degassed by purging with nitrogen gas for 30 min. To this solution, different concentrations of 2-HEMA were added and stirred for 1 h at 400 r min−1. Afterward, K2S2O8 as initiator and TEMED as catalyst were added and stirring was continued for another 2 h. To the final graft solution, different amounts of SA and drug (as given in Table 1) were added and stirred until to obtain a complete homogeneous solution. Drug-loaded polymer blend mixture was added dropwise into 5% CaCl2 solution through a syringe (1 mm diameter) under constant stirring. The obtained wet beads were collected by decantation, washed three times with distilled water to remove the drug attached on the bead surface, and finally, the beads were then dried at 40°C.
Formulation, composition, and encapsulation efficiency (%EE) of all samples.
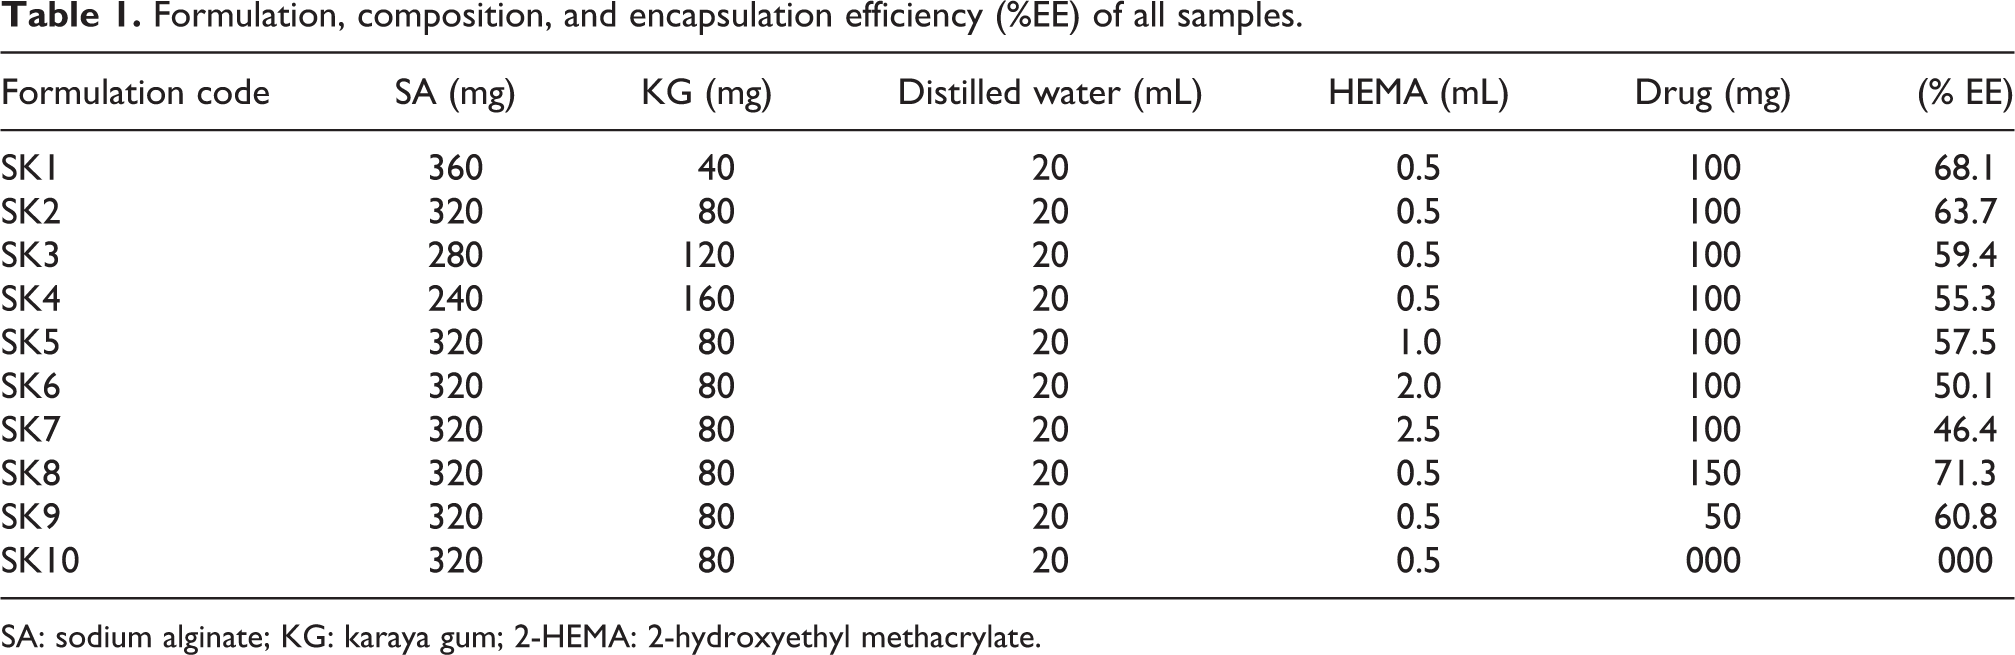
SA: sodium alginate; KG: karaya gum; 2-HEMA: 2-hydroxyethyl methacrylate.
Characterizations methods
FTIR spectral analysis
FTIR spectroscopy spectra of KG, SA, D-PA, placebo microbeads, and drug-loaded microbeads were recorded with FTIR spectrophotometer (model Bomem, ABB Measurement & Analytics, China, MB-3000, with Horizon MB™ FTIR software) in the wavelength range of 400–4000 cm−1 to find out the possible chemical interactions between polymers and drug.
Differential scanning calorimetry
DSC curves of KG, SA, D-PA, placebo microbeads, and drug-loaded microbeads were recorded using the thermogravimetry analyzer (Rheometric Scientific, Mettler Toledo, Model DSC-SP, UK). The analysis was performed by heating the sample from 40°C to 600°C at a heating rate of 10°C min−1 under nitrogen atmosphere.
Thermogravimetric analysis
TGA of KG, SA, D-PA, placebo microbeads, and drug-loaded microbeads was carried out using the thermogravimetry analyzer (Rheometric Scientific, Model DSC-SP). About 5–7 mg of sample was placed into an alumina crucible and the thermograms were recorded between 40°C and 600°C at a heating rate of 10°C min−1 under the nitrogen atmosphere.
XRD analysis
The XRD of pristine drug, placebo microbeads, and drug-loaded microbeads was performed by a wide-angle X-ray scattering diffractometer (Panalytical X-ray Diffractometer, model-X’pert Pro, Rigaku, Japan) with copper Kα radiation (λ = 1.54060) at a scanning rate of 10° min−1 to determine the crystallinity.
SEM analysis
The morphological characterization of microbeads was observed by using SEM (JOEL model JSM 840A, Leica 400, Cambridge, UK Instrument) with an accelerated voltage of 20 kV.
Swelling measurements
The swelling behavior of different formulations was determined gravimetrically at different reaction variables such as 2-HEMA, SA, and pH of the medium that were studied by varying composition of each formula to obtain the best formulation as given in Table 1.
Encapsulation efficiency
The percentage of encapsulation efficiency of D-PA-loaded microbeads was estimated according to the formula and method reported in previous literature. 29 A known mass of drug-loaded microbeads (20 mg) was immersed into 100 mL of phosphate buffer solution (pH 7.4 containing 5% absolute ethyl alcohol) for 24 h and then vigorously stirred the microbeads to ensure the complete extraction of D-PA from the microbeads. Supernatants were filtered and analyzed by ultraviolet (UV) spectrophotometer (Lab India, Mumbai, Maharashtra, India) at the λ max of 200 nm with placebo microbeads, which were used as a blank correction. The concentration of drugs was determined by using a calibration curve constructed by a series of D-PA standard solutions. Percentage of encapsulation efficiency was determined by the following formula:

In vitro drug release studies
The in vitro drug release studies of different formulations were performed by using a dissolution tester (Lab India) capable of eight baskets at 37°C in 900 mL of phosphate buffer solution pH 7.4 at a rotation speed of 50 r min−1 to replicate intestinal atmosphere. The accurately weighed 100 mg of microbeads were used for the study. At regular intervals of time, 5 mL aliquot samples were withdrawn and analyzed using a UV spectrophotometer at a fixed λ max value of 200.00 nm, and the released drug amount was obtained by using concentration versus absorbance calibration curve.
Drug release kinetics
The drug release kinetics was analyzed by fitting the data into kinetic models, which include zeroth, first order, Higuchi, and Korsmeyer–Peppas. 30 -33 Based on the goodness of data fit, the most suitable model was also determined. 34
Results and discussions
FTIR spectral analysis
FTIR spectra of SA (a), KG (b), pristine D-PA (c), placebo microbeads (d), and drug-loaded microbeads (e) were displayed in Figure 3. FTIR spectrum of SA (Figure 3(a)) shows absorption bands at 3409 cm−1 assigned to stretching frequency of O–H, and the bands at 1596 and 1388 cm−1 were due to asymmetric and symmetric stretching frequency of carboxylate group, respectively. FTIR spectra of KG (Figure 3(b)) show characteristic absorption bands at 3417 and 2939 cm−1, which were assigned to stretching frequency of O–H and C–H, respectively. The bands at 1735 and 1257 cm−1 indicate the stretching frequency of C=O and C–O, respectively. The bands at 1620 and 1388 cm−1 correspond to the stretching frequency of C=O and C–O groups of uronic acid residue, respectively. Furthermore, the absorption band at 1041 cm−1 corresponds to C–O stretching frequency of alcoholic group. The FTIR spectra of D-PA (Figure 3(c)) show characteristic absorption bands at 3417, 2517, and 1627 cm−1, which were due to N–H, S–H, and C=O stretching vibrations, respectively.

FTIR spectrum of SA (a), KG (b), D-PA (c), placebo microbeads, (d) and drug-loaded microbeads (e).
To confirm the grafting reaction of 2-HEMA on KG, FTIR analysis was performed and the spectra were displayed in Figure 3. In general, KG (Figure 3(b)) contains a large number of hydroxyl groups, which represents a band at 3417 cm−1 with high intensity, whereas the intensity of this band was reduced in the spectra of both placebo microbeads (Figure 3(d)) and drug-loaded microbeads (Figure 3(e)) due to conversion of hydroxyl groups into ether linkages. Furthermore, a new band appeared at 1072 cm−1 in the microbeads which confirms the formation of KG-g-HEMA. Comparing the FTIR spectra of placebo microbeads and drug-loaded microbeads, the band at 1620 cm−1 in placebo microbeads was shifted to lower wavelength 1596 cm−1 in drug-loaded microbeads. This is due to the formation of hydrogen bond between drug and polymer matrix, which confirms that the drug was loaded in the microbeads.
DSC analysis
To investigate the formation of graft copolymer as well as the crystalline nature of encapsulated drug in the polymer matrix, DSC analysis was performed and the data were represented in Figure 4. The thermogram of SA (Figure 4(c)) shows two peaks, an endothermic peak was observed at 81°C is due to dehydration process and exothermic peak at 288°C is due to thermal decomposition of SA. The thermogram of pure KG (Figure 4(b)) shows two peaks, one is endothermic at 77°C and another is an exothermic peak at 287°C. Whereas the graft copolymer placebo microbead (Figure 4(d)) also shows the same two peaks like that of pure KG, but with a slight variation was observed. In addition to these peaks, one more endothermic peak was observed at 198°C for graft copolymer indicating the interaction between the carbonyl group of HEMA and the hydroxyl group of KG, also confirming the formation of graft copolymer. DSC curve of pristine D-PA (Figure 4(a)) shows a peak at 207°C, whereas no such peak was observed in drug-loaded microbeads (Figure 4(e)), which confirmed that D-PA molecules were dispersed at the molecular level in the polymer matrix.

DSC curves of D-PA (a), KG (b), SA (c), placebo microbeads (d), and drug-loaded microbeads (e).
TGA analysis
To understand the thermal stability of KG, SA D-PA, placebo microbeads, and drug-loaded microbeads, TGA was performed and the thermograms were displayed in Figure 5. The TGA curve of KG (Figure 5(a)) showed two weight loss steps. The first weight loss starts at 50–139°C due to loss of water and the second weight loss step starts at 318°C due to thermal decomposition of KG. The results suggest that KG shows stability toward thermal decomposition. The TGA curve of SA (Figure 5(b)) showed three weight loss steps. The first weight loss step was observed in the region of 50–146°C due to dehydration process, the second weight loss observed in between the region of 199°C and 281°C due to thermal decomposition, and the third step was found in the region of 301–600°C due to formation of sodium carbonate residue. The TGA curve of D-PA (Figure 5(e)) remained stable up to 125°C, following mass loss being maximum at 229°C. The thermal decomposition of placebo microbeads (Figure 5(c)) occurs in three consecutive steps. The first weight loss step was observed between 49°C and 171°C with a loss of 29%, indicating the loss of free and bound water from the polymer matrix. The second weight loss was observed in the region of 179–204°C with a loss of 14%, indicating the decomposition of SA from the polymer network. The third weight loss of 6% weight in the region of 213–299°C indicates the loss of 11% due to the decomposition of polymer network. For drug-loaded microbeads (Figure 5(d)), three stages of weight loss steps were observed. The first weight loss of 23% was observed in the region 49–176°C, followed by a weight loss of 14% between the region 185°C and 205°C, due to the SA decomposition. The last step was found in the region of 213–310°C with a weight loss of 14%, indicating the thermal decomposition of remaining polymer network. From the TGA results, it was clear that the drug-loaded blend matrix shows an overall improvement in the thermal stability of microbeads.

TGA thermograms of KG (a), SA (b), placebo microbeads (c), drug-loaded microbeads (d), and D-PA (e).
XRD analysis
XRD studies were performed to investigate the molecular dispersion of D-PA in the polymer matrix. The diffractograms of D-PA (a), placebo microbeads (b), and drug-loaded microbeads (c) were displayed in Figure 6. The diffractogram of D-PA (Figure 6(a)) showed characteristic peaks at 2θ of 17.04°, 27.17°, 30.18°, and 38.63° indicating its crystalline nature. Whereas such intense peaks were not observed in drug-loaded microbeads (Figure 6(c)), this suggests that D-PA crystalline peaks were merged with the polymer matrix, indicating that the D-PA changes its state from crystalline to amorphous nature. These results suggest that the drug was molecularly dispersed in the polymer matrix.

XRD patterns of D-PA (a), placebo microbeads (b), and drug-loaded microbeads (c).
SEM analysis
To understand the morphological structure of microbeads, SEM analysis was performed and the topographical images were represented in Figure 7. As shown in the figure, the microbeads formed are spherical in shape having rough surfaces. However, the surface of microbeads shows porous structure with few depressions, which is due to the contraction of hydrophilic part of polymer matrix during the drying process. From the results of SEM images, the average size of microbeads was found to be 1500–1800 μm.

Scanning electron microscopic images of placebo microbeads ((a) and (c)) and drug-loaded microbeads ((b) and (d)).
Swelling measurements
Effect of 2-HEMA content on the swelling behavior
The effect of 2-HEMA on the swelling properties was studied (formulations SK2, SK5, SK6, and SK7) at constant SA, KG, and drug content. The results (Figure 8) reveal that the swelling decreased on increasing the amount of 2-HEMA. This is due to the presence of weak hydrophilic hydroxyl groups which forms hydrogen bond between two chains, which results in the shrinkage of network. 35

Effect of 2-HEMA content on swelling behavior.
Effect of SA on the swelling behavior
The effect of SA on the swelling properties was studied (formulations SK1, SK2, SK3, and SK4) at constant drug and HEMA content. The results (Figure 9) reveal that the swelling increased on increasing the amount of SA due to the hydrophilic nature of SA. A similar observation was observed by Madhavi et al. 36
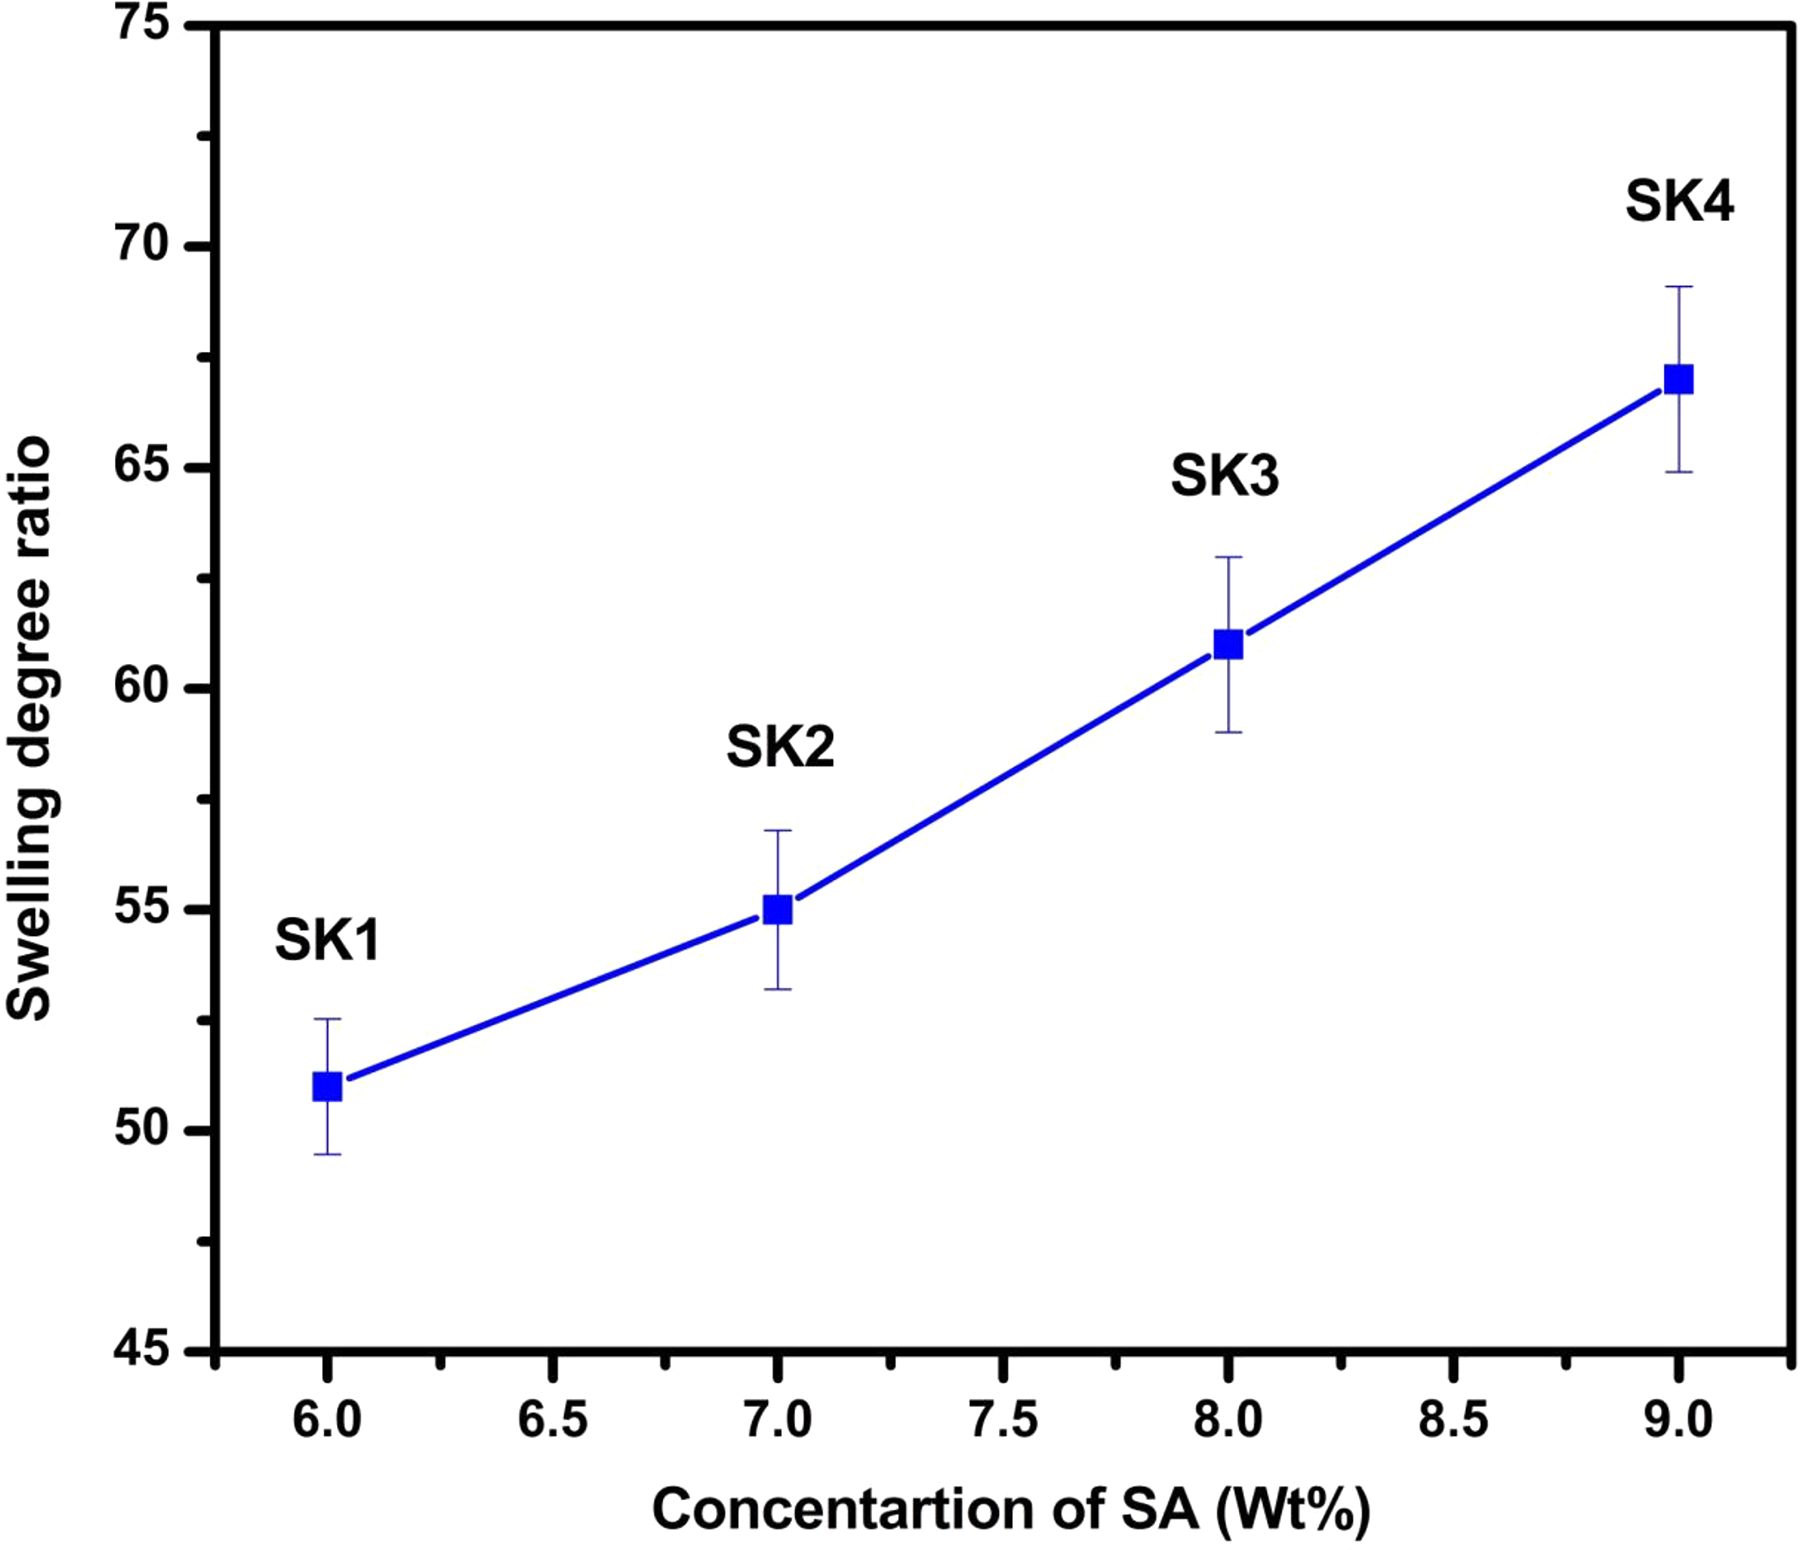
Effect of SA content on swelling behavior.
Effect of pH on the swelling behavior
Figure 10 shows the swelling behavior of microbeads investigated (formulation SK2) at various pH media at 37°C. Figure 10 shows an increase in swelling when pH was changed from 1.2 to 7.4. This is due to hydrogen bonding interactions developed between –COOH groups of polymeric chains and solvent molecules resulting in shrinking of network, thereby decreasing the swelling behavior was at pH 1.2. Whereas at pH 7.4 the swelling ratio increased because all the –COOH groups of SA and KG were converted to –COO−, resulting in the repulsion of water molecules because of the existence of ionic–ionic repulsions. A similar observation was reported by Eswaramma and Krishna Rao. 37

Effect of pH on swelling behavior.
Encapsulation efficiency
The percentage of encapsulation efficiency from drug encapsulation studies was found to be between 46% and 71% (Table 1). The %EE of D-PA depends on different parameters such as % drug loading, polymer blend composition, and effect of 2-HEMA. The %EE increases with the increase of drug loading in the polymer matrix. The %EE decreased with the increase of KG content in the polymer matrix. With the increase of 2-HEMA content in the polymer matrix, %EE decreased due to the formation of loosely cross-linked chains of HEMA in the polymer matrix. A similar observation was reported by Yerriswamy et al. 38 for the controlled release of acebutolol hydrochloride.
In vitro drug release studies
The cumulative percentage of drug release studies of all formulations was investigated under both pH 1.2 and pH 7.4. The percentage of D-PA release for all profiles at pH 1.2 and the results are displayed in Figure 11. In vitro drug release studies for all profiles at pH 7.4 were discussed in terms of polymer blend variation, drug variation, and 2-HEMA variation, and the results are displayed in Figures 12 to 14. The results reveal that the percentage of D-PA release is higher in pH 7.4 rather than pH 1.2, which is due to a higher pH (7.4) the carboxylate group shows less interactions with the buffer media, hence the network becomes slacker, therefore the entrapped drug molecules leached out easily from the polymer matrix.

Drug release profile of D-PA microbeads at pH 1.2.
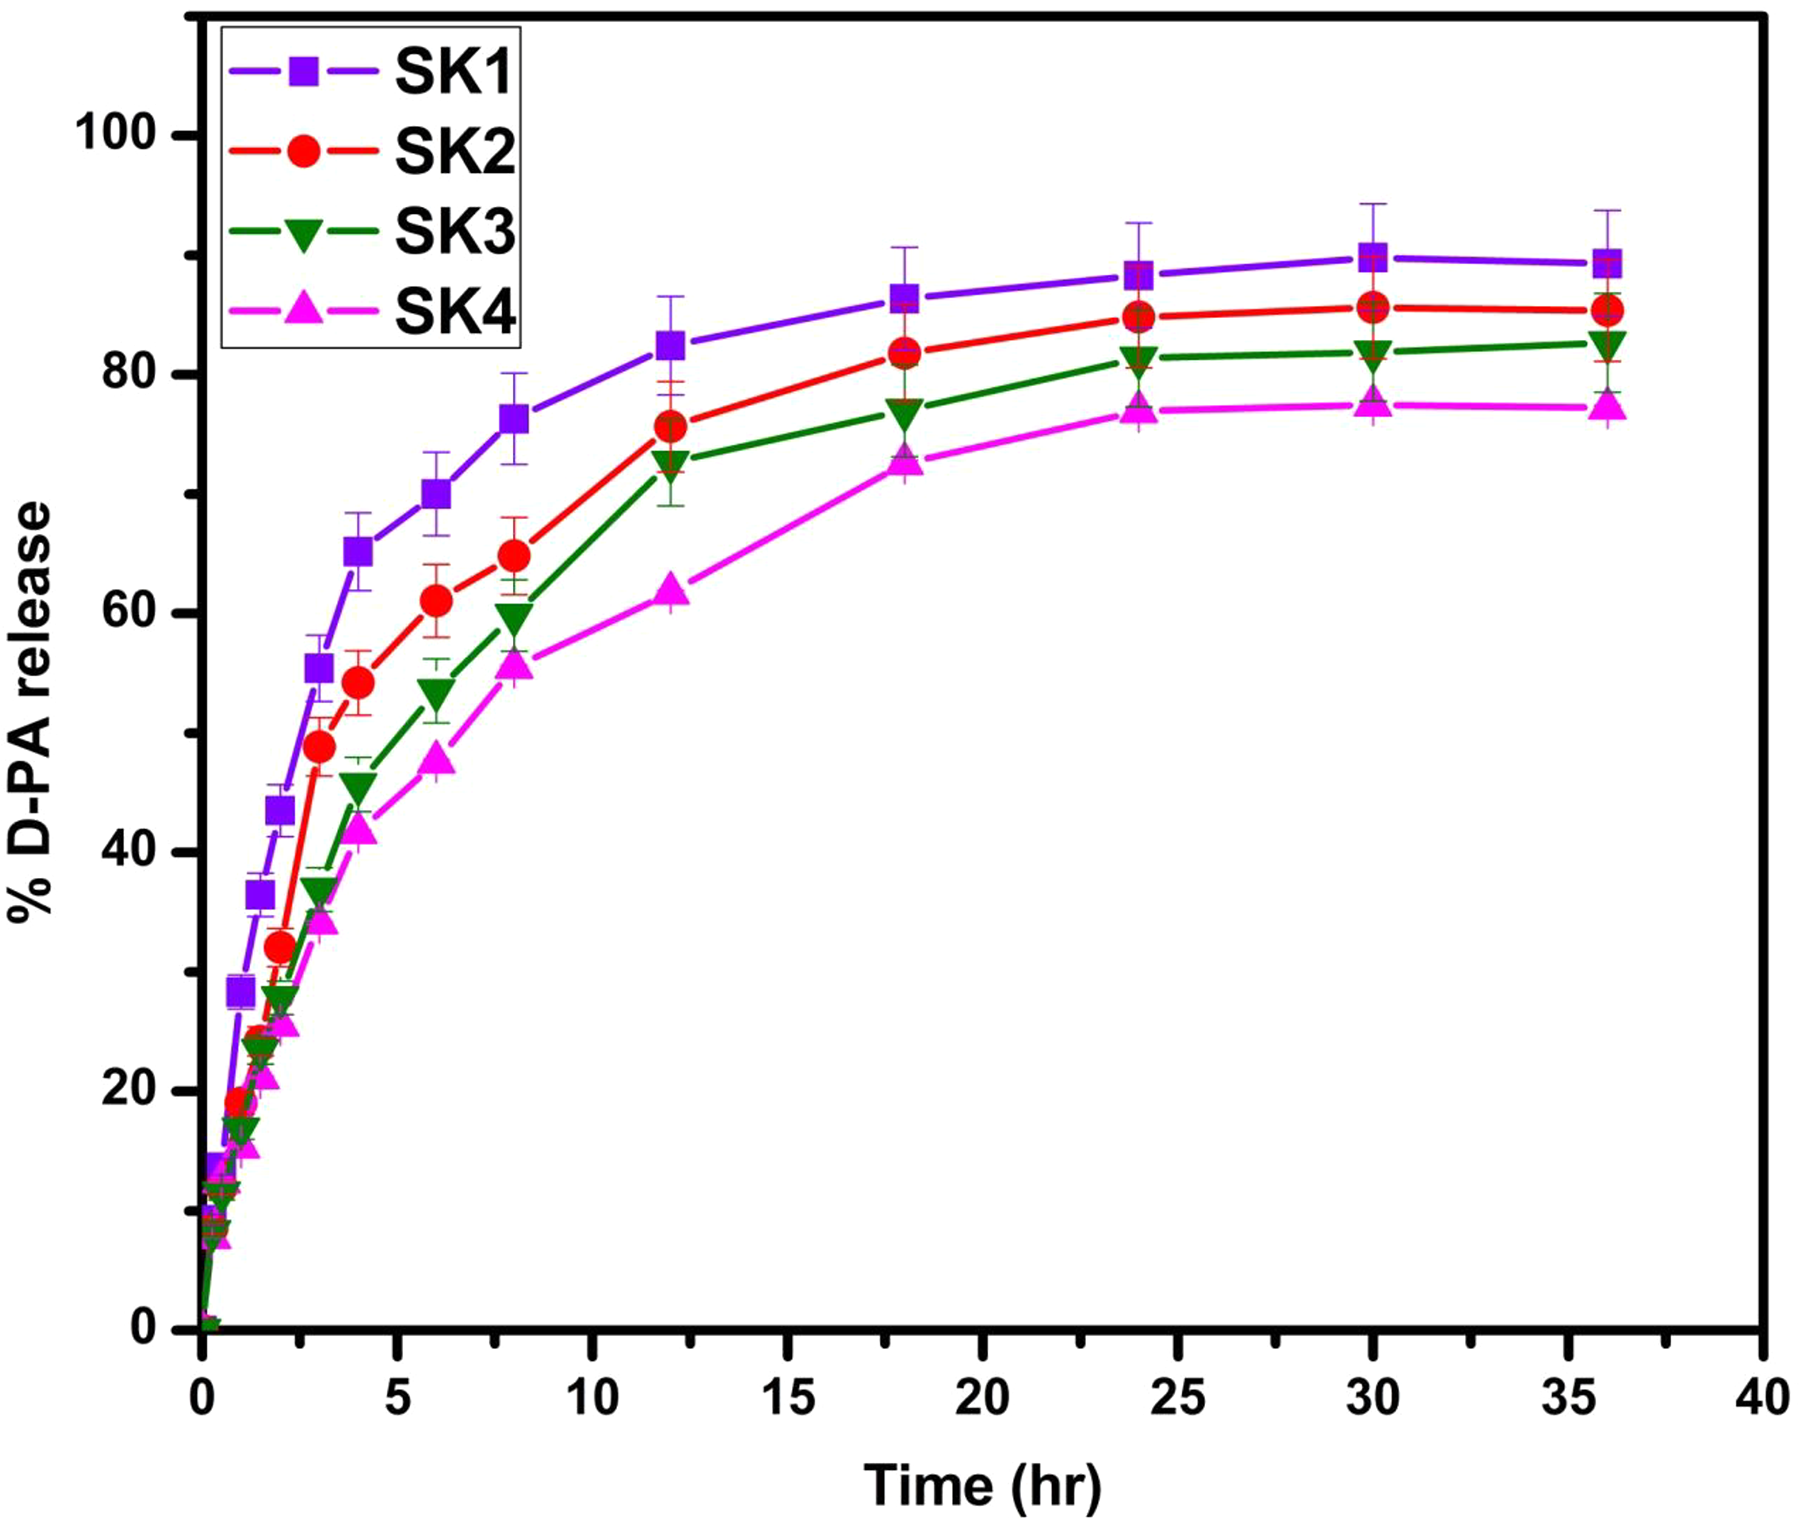
Effect of polymer blend composition on % releases of D-PA at 37°C in pH7.4.

Effect of drug content on % releases of D-PA at 37°C in pH 7.4.

Effect of 2-HEMA content on % releases of D-PA at 37°C in pH 7.4.
Effect of polymer blend composition
The effect of polymer blend composition on in vitro release profiles was studied at constant drug and HEMA content. The drug release profiles of SK1, SK2, SK3, and SK4 are displayed in Figure 12. The percentage of D-PA release was increased by increasing the content of SA in the polymer matrix due to its more hydrophilic nature. As the content of KG increases, the percentage of D-PA release was decreased due to the presence of ester linkages in the KG which increases the hydrophobicity of the matrix, thereby decreasing the release rate of D-PA. 39
Effect of drug variation
The effect of drug content on in vitro release profiles was studied at constant polymer content was studied for formulations of SK2 (100 mg), SK8 (150 mg), and SK9(50 mg). From Figure 13, it is clearly observed that the percentage of D-PA release rate was decreased with the decrease of drug content. This is due to the availability of more void spaces in the polymer matrix through which fewer molecules will transport through the matrix.
Effect of 2-HEMA variation
To find out the effect of 2-HEMA on in vitro, release profiles were studied at constant polymer matrix and drug content. The release profiles of SK2, SK5, SK6, and SK7 were displayed in Figure 14. The drug release rate of D-PA was decreased with an increase in2-HEMA content, which is due to the formation of hydrogen bond between two chains that causes the shrinkage of network, consequently reduces the free void volume in the matrix, thereby hindering easy transport of drug molecules through the matrix. 40
Drug release kinetics
To find out the drug release mechanism of D-PA loaded microbeads, the data obtained from the in vitro release studies were fitted into different kinetic models, which include zeroth order, first order, and Higuchi model. The results of correlation coefficients (r 2 ) and rate constants of all models are reported in Table 2. From the results, it was concluded that the best fit model for drug release is the Higuchi model. To confirm the drug release mechanism, the in vitro release data were fitted into the following Korsmeyer–Peppas equation 41 :
Drug release rate constant and correlation coefficient of all formulations after fitting drug release data into different mathematical models.

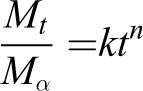
where M t/M α represents the fractional drug release at time t, k is a constant characteristic of the drug–polymer system, and n is the release exponent indicating the type of drug release mechanism. In the present study, the values n are obtained in the range of 0.502–0.695 indicating anomalous or non-Fickian diffusion mechanism. These results, along with correlation coefficients “r 2 ,” are presented in Table 2.
Conclusion
In the present study, semi-IPN microbeads were fabricated from SA and modified KG by simple ionotropic technique. The graft reaction was confirmed by FTIR and DSC studies. Chemical stability and molecular level dispersion of D-PA in microbeads were confirmed by FTIR, DSC, TGA, and XRD, respectively. Morphological studies reveal that the beads were spherical in shape with a rough surface. From the SEM studies, the average diameter of microbeads was found to be 1500–1800 μm. Swelling studies were dependent on SA content in the polymer matrix, pH of the medium, and 2-HEMA content in the polymer matrix. In vitro releases studies fitted into the Peppas equation and followed the non-Fickian diffusion transport. Based on the results, it was suggesting that the developed microbeads were potentially good carrier for drug delivery of D-PA.
Footnotes
Acknowledgements
The authors MCSS and KCR acknowledge the support provided by UGC in the form of BSR faculty fellowship.
Declaration of conflicting interests
The author(s) declared no potential conflicts of interest with respect to the research, authorship, and/or publication of this article.
Funding
The author(s) received no financial support for the research, authorship, and/or publication of this article.