
Abstract
Only a few works focus on the use of commercial pyrolysis carbon black (PCB) to replace with commodity carbon black in terms of increasing environmental awareness. In this work, a commercial PCB (ET (Enrestec) black) from waste tires was compared with N660 carbon black in styrene–butadiene rubber (SBR) compounds using standard American Society for Testing and Materials recipes. Particle aggregate size, composition, and surface functionality of ET black and N660 were analyzed through light scattering, energy-dispersive X-ray spectroscopy (EDS), and Fourier transform infrared spectroscopy, respectively. Higher compound viscosity and aggregation power for ET black filler in the rubber matrix was observed. A progressive decrement of approximately 20% in M300 from 15.2 MPa for N660-filled SBR to 12.4 MPa for ET black-filled SBR with increasing ET black ratio in the fillers was clearly observed. ET black could potentially replace 20% in N660 without much influence for SBR compounds in terms of tensile strength. The effect of ET black content on the tear strength was less marginal than the tensile strength. However, with increasing the ET black content, the abrasion resistance index progressively decreased. Thus, it was quite beneficial to consider the merit of PCB in terms of the applications required for tearing resistance. This paves the way for the opportunities to expand further commercial application of PCB from waste tires in the light of environmental awareness.
Introduction
Waste tire recycling was a global environmental issue due to the difficulty in generating valuable products through complicated composite structures including cross-linked rubber, steel wire, nylon layer, and so on. According to the European Tyre & Rubber Manufacturers’ Association, 1 the global waste tires output was about 1.5 billion. There were several approaches in managing those waste tires, including landfill, reuse, retreading, material recovery, energy recovery, and so on. Owing to the increasing concern on the carbon footprint, material recovery was one of the most and major recovery approaches. Thus, this environmental trend in efficiently recycling waste tires received much attention recently. Pyrolysis carbon black (PCB) generated from a scrap tire pyrolysis has been considered as a very plausible approach to recycle carbon black using as an additive for rubbers and other compounds. 1 -4 Besides carbon black generation, fuel resources could also be obtained through the pyrolysis of waste tires. 5
Several lab approaches have prepared PCB from waste tires in the literature, TGA pyrolysis, 6 melt-extrusion pyrolysis, 7,8 and bed reactor pyrolysis. 9 Regenerated carbon black was found to have a higher surface area, elongation at break, and heat buildup, but a lower curing speed, modulus, and a comparable state of cure, dispersion, hardness, tensile strength, and tear strength compared with those of the virgin carbon black. 10 Sugatri et al. indicated that increasing pyrolysis temperature from 225°C to 410°C could decrease the agglomerate size and a similar C–O stretching of the carboxyl group like N660 in their thermal study of recycled carbon black from the waste tire. 11 Feng et al. found that PCB significantly improved the thermal and photooxidative aging of bitumen to avoid the permanent deformation at high temperatures in road applications. 4
There were some works investigating the potential possibilities of replacing commercial carbon black with PCB in terms of mechanical properties in the rubber compounds, such as natural rubber (NR)/styrene–butadiene rubber (SBR) blends, 12,13 SBR, 14 -16 ethylene–propylene–diene copolymers, 17 and NR. 18 Their results generally suggested that some of the mechanical properties were comparable with semi-reinforcing furnace blacks like N772 and N774 series in a certain percentage of replacement but inferior to high abrasive furnace black like N330 and N339 series, mainly due to the high ash content and low surface activity. 19 Moulin et al. indicated that reinforcement properties of steam–water thermolysis-recycled carbon blacks were inferior to those of N330 carbon black but were similar or slightly better than N550- and N772-filled rubbers. 19 Most of those works used PCB in a lab scale for semi-reinforcing furnace black and high abrasive furnace black, only a few studies work on the commercial scale for the compound comparison. In this work, we selected a commercial-scale product (ET black) locally available to compare with general-purpose furnace black like N660 carbon black in SBR compounds. Particle aggregate size, composition, and surface functionality of ET black and N660 were analyzed through light scattering, energy-dispersive X-ray spectroscopy (EDS), and Fourier transform infrared (FTIR) spectroscopy, respectively. Different percentages of N660 were replaced with ET black using standard American Society for Testing and Materials (ASTM) recipes. The evaluation based on tensile and tear properties was conducted. This paves the way for the opportunities to expand further commercial application of PCB from waste tires in the light of environmental awareness.
Experimental
Materials
SBR, N660, and ET black were major materials for this work. SBR (SBR1502) was a product of Korea Kumho Petrochemical Co., Ltd (Seoul, Korea). NR (SVR-3 L) was provided by Mai Thao Rubber (Vietnam). N660 was supplied from China Synthetic Rubber Corporation (Taipei, Taiwan). ET black, available in Enrestec Inc. (Pingtung, Taiwan) was a carbon black generated from a pyrolysis process of waste tires collected in Taiwan. The oil adsorption number based on ASTM D2414 for N660 and ET black was about 93.3 and 97.6, respectively. The iodine adsorption number complying with ASTM D1510 for N660 and ET black was about 76.3 and 36.3, respectively. Stearic acid (SA-1810) was a product of PT Sumi Asih Oleochemical Ind. (Indonesia). ZnO (Grade 945) was purchased from Diamonchem International Co., Ltd (Changhua, Taiwan). Both SA and ZnO were activators for curing recipes. Sulfur supplied by EASTech Chemical Co., Ltd (Changhua, Taiwan) was a curing agent for SBR. TBBS (NS, N-tert-butyl benzothiazole-2-sulfenamide) as an accelerator for sulfur curing were both obtained from Willing New Materials Technology Co., Ltd (Puyang, China). p-Xylene (Tedia Co., Fairfield, Ohio, USA) was used as a solvent to extract the uncross-linked portion.
Sample preparations
The recipe for SBR compounds was based on the ASTM D3191-10 standard. SBR was mixed with SA (1 phr), zinc oxide (3 phr), and carbon black till the homogeneous mixture reaches the dropping temperature of 150°C in the internal mixer (SYD-2 L, NBDR-WM, Well Shyang Machinery Co., Ltd, Tainan, Taiwan). The mixture was sheeted in an open mill (Jian Kwang Machine Industrial Co., Ltd, Taichung, Taiwan), followed by cooling at room temperature for 4 h. And then the mixture was mixed with sulfur (1.75 phr) and TBBS (1 phr) till 95°C in the internal mixer. After sheeting in the open mill, the compounds were cured at 155°C for 30 min in a hot process (FS-1H1C Feng Sheng, Fengyuan District, Taichung City, Taiwan). The cured compounds were stored in an air-vent area for at least 12 h before further testing. The sample codes of SBR-1, SBR-2, SBR-3, SBR-4, SBR-5, and SBR-6 represent the weight ratio of ET black and N660 as 0/100, 20/80, 40/60, 60/40, 80/20, and 0/100, respectively.
Measurements
Structural characterizations
The FTIR spectra of N660 and ET black were determined using the attenuated total reflection (ATR) accessory of a spectrophotometer (Perkin Elmer, Spectrum 100) for 32 scans at a resolution of 4 cm−1 from 650 cm−1 to 4000 cm−1. The ratio of carbon black and KBr was kept at 1:100 to form the pressed KBr pellet for ATR analysis. The particle aggregate was determined using a zeta sizer (Malvern, nano-S90, Worcestershire, UK). One gram of carbon black was added into 100 ml deionized (DI) water to form carbon black suspension. Five drops of the above suspension were further diluted with 20 ml DI water, followed by ultrasonic treatment for 20 min before analysis. A scanning electron microscope (Tescan 5136MM, Tescan, Libusina trida, Bron, Czech Republic) equipped with EDS operating at 20 kV was used to conduct the element analysis and cryofractured surface morphology. According to the ASTM D2765-01 standard, the compounds were extracted with boiling p-xylene to remove the xylene soluble product. The insoluble parts were then vacuum-dried at 80°C for 3 h. The gel content was determined by the ratio of the dried sample weight to the original sample weight.
Thermal characterizations
A dynamic mechanical analyzer DMA (Perkin Elmer, Pyris Diamond, Waltham, MA, USA) was used to measure the glass transition temperature (T g) and tan δ under a tension mode at a heating rate of 5°C min−1 with a frequency of 1 Hz from –80°C to 100°C.
Mechanical properties
Tensile test was conducted with a crosshead of 500 mm min−1 based on the ASTM-D638 standard using a universal tensile tester (Instron 4469, Instron, Boston, Massachusetts, USA). Tensile strength, Young’s modulus, and elongation at break were determined from stress–strain curves. Tear test was performed to calculate tear strength with a type C (ASTM D624) cutter using a crosshead of 500 mm min−1 in the Instron machine.
Abrasion resistance
The abrasion test was carried out using an abrasion tester (Karl Frank, 11565, Germany) according to Chinese National Standards (CNS) 734:2014. The diameter of the test sample with a cylindrical shape was 16 mm. The test was conducted at a rotational frequency of 40 r min−1 under the applied normal load of 10 N. The abrasion resistance index (ARI, %) was calculated based on the ratio of the volume loss of the reference rubber to that of samples.
Heat buildup
Heat buildup (HBU) test was conducted using a GABOMETER-2000 (GABO, Germany) based on ASTM D623 (Test Method A). The test was operated under a static load of 250 N at a frequency of 30 Hz with the dynamic amplitude of 1.5 mm at 40°C. The increase in temperature was recorded.
Results and discussion
Structural characterizations
The particle size analyzer was used to evaluate the particle aggregate size distribution of N660 and ET black within DI water, as shown in Figure 1. The average aggregate size for three runs was about 315.3 nm and 234.0 nm for N660 and ET black, respectively. The three different runs suggested the good repeatability for both commercial carbon black and PCB during production. By closely checking the aggregate distribution, it was found that the full width at half-maximum was about 140.5 and 100.0 nm for N660 and ET black, respectively. The results indicated the slightly smaller particle aggregate size for ET black in comparison with N660, perhaps attributing to more hydrophilic inorganic species in ET black.

Aggregate size distribution of (a) N660 and (b) ET black.
The chemical composition of the commercial carbon black and PCB was analyzed by EDS and the results of which are presented in Table 1 and Figure 2. The surface morphology of N660 showed some plate agglomerates; on the other hand, ET black showed discrete particle agglomerates. This was as a result of complex ingredients on the surface ET black to prevent a continuous aggregation from forming large agglomerates through the aggregation of the primary carbon black particles. To clearly probe the possible ingredients on the ET black, EDS was used. In the EDS spectra of N660 sample, C, O, and S elements were the major constituents, in agreement with the literature. 20 As for ET black, additional elements, such as Si, Al, Ca, and Zn, were observed as a result of the complex recipe in the tire compounds from additives and fillers. Apparently, this confirmed the formation of more noncarbon-based elements for ET black as expected.
EDS element analysis.
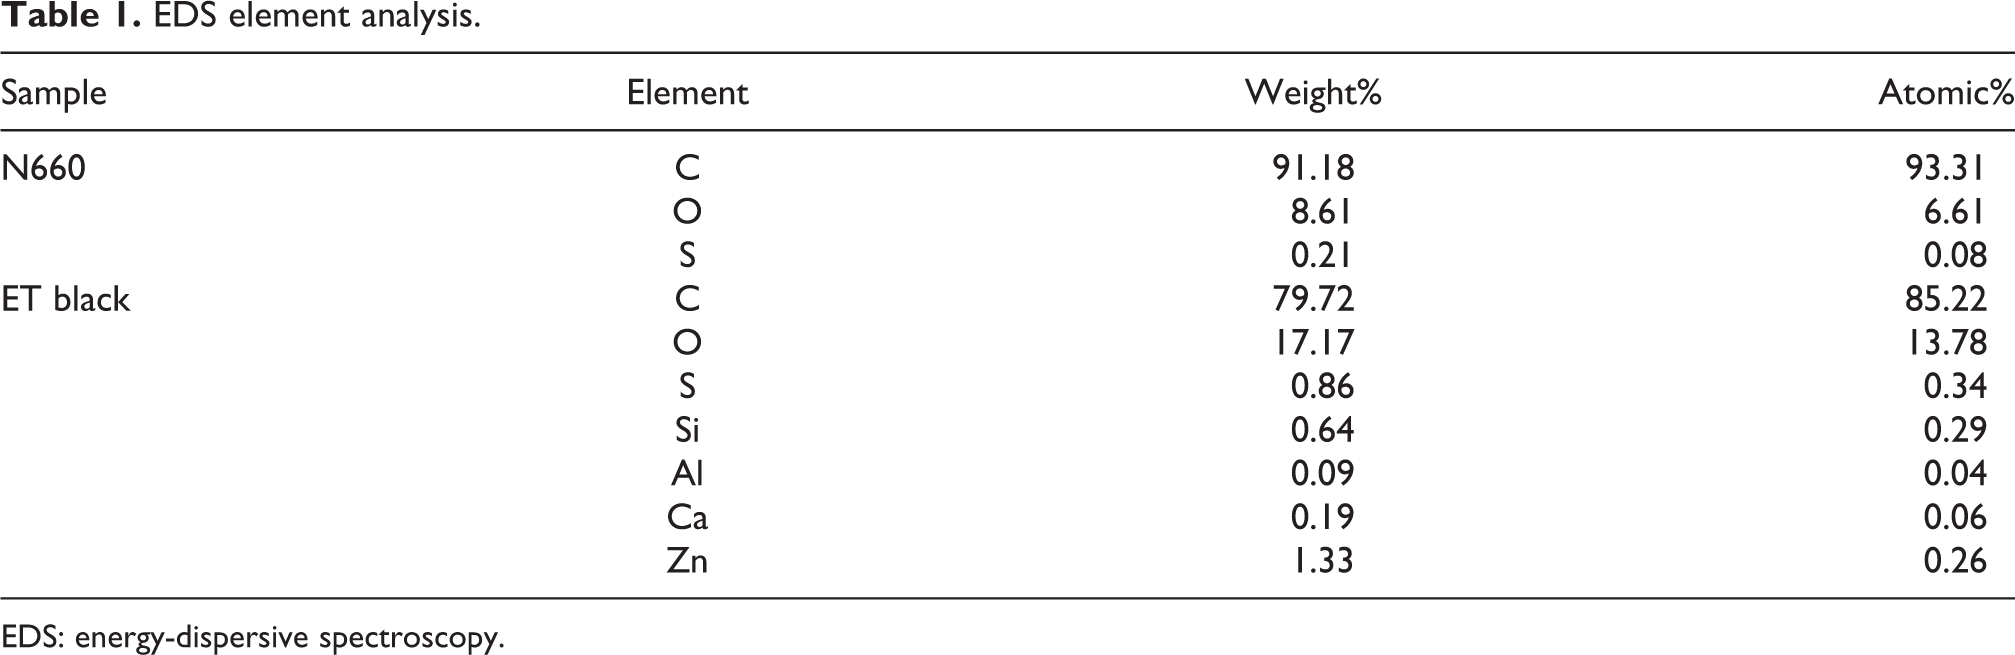
EDS: energy-dispersive spectroscopy.
EDS images of (a) N660 and (b) ET black.
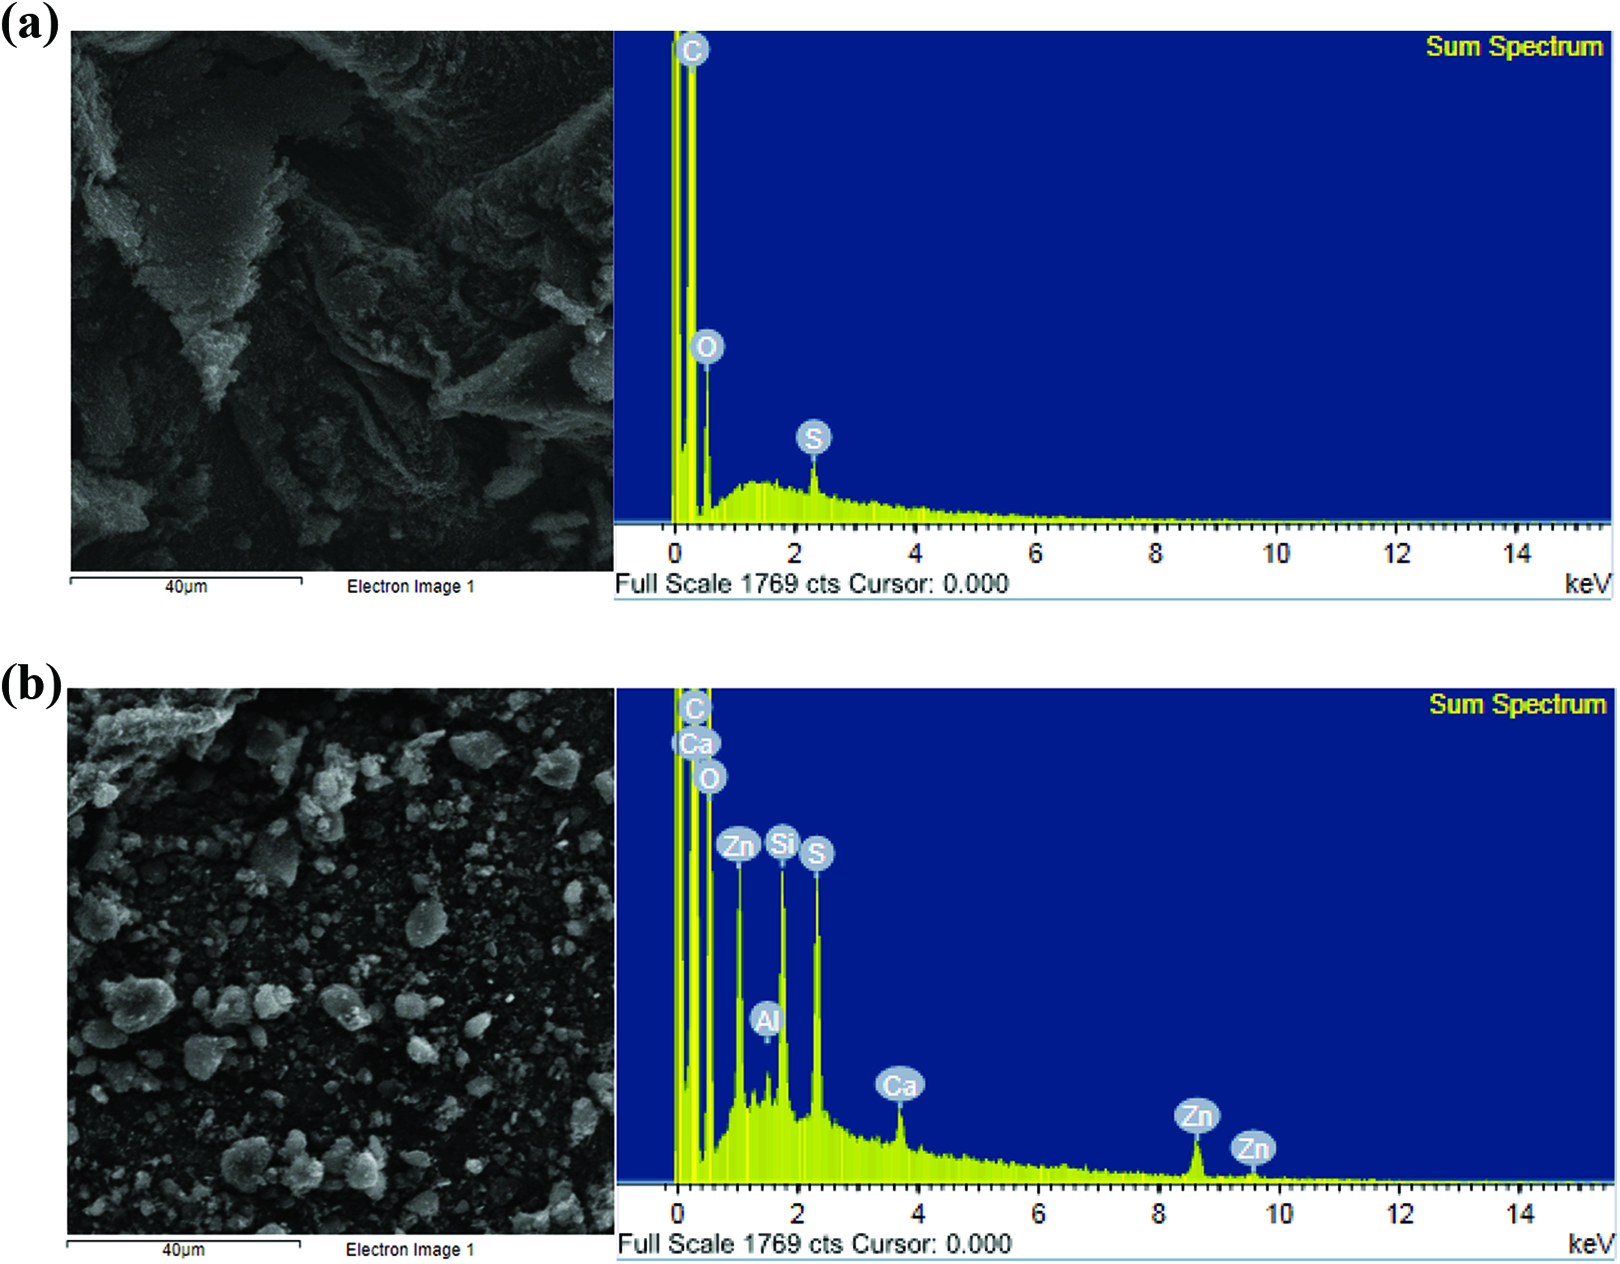
Figure 3 shows the FTIR spectra of N660 and ET black. For the scanning range from 4000 cm−1 to 2000 cm−1, –OH group at 3276 cm−1 and –CH stretching absorption band at 2917 and 2850 cm−1 were observed on N660, indicating the possible residual hydrophilic group in N660 during their preparation. In addition, to better reveal the low wavenumber range between 2000 cm−1 and 650 cm−1, the signature peaks of 1731(C=O cm−1), 1260 and 1171 cm−1 (C–O), 1647 and 1540 cm−1 (C=C) along with 1369 and 802 cm−1 (C–H) 20 -22 were observed for both N660 and ET black, except a slight difference of C–O at 1090 cm−1 for N660 and 1048 cm−1 for ET black. This confirmed similar functional groups in both carbon blacks whether they were generated from a conventional thermal decomposition method using hydrocarbons as the raw material source or a pyrolysis method using waste tires as the raw material source.
FTIR spectra of (a) N660 and (b) ET black.
Gel content
To compare the cross-linking effect of ET black composition in the standard rubber compounds, the gel content was determined, as shown in Figure 4. The gel content of SBR compounds ranged from 94.3% to 95.4% at various ET black concentrations. This indicated a similar curing degree between N660 and ET black without much influence from noncarbon-based elements in ET black. In addition to the gel content, the molecular weight between cross-links, M c, was evaluated to better understand the molecular aspect of the cross-linking degree, as shown in Figure 4. The molecular weight between the cross-links increased slightly with increasing the ET black content and then decreased further at 100% ET black. The obtained values between 1914.4 g mol−1 and 2715.1 g mol−1 were in a similar order as reported in the literature work. 23 Basically, the effect of ET black on the variation of cross-linking degrees was quite limited as well in considering the large amount of carbon black within the SBR matrix, imposing different degrees of physical cross-links. Overall, the results were in agreement with the measurement of gel content with sufficient cross-linking degrees, even though PCB with some noncarbon black elements was used.
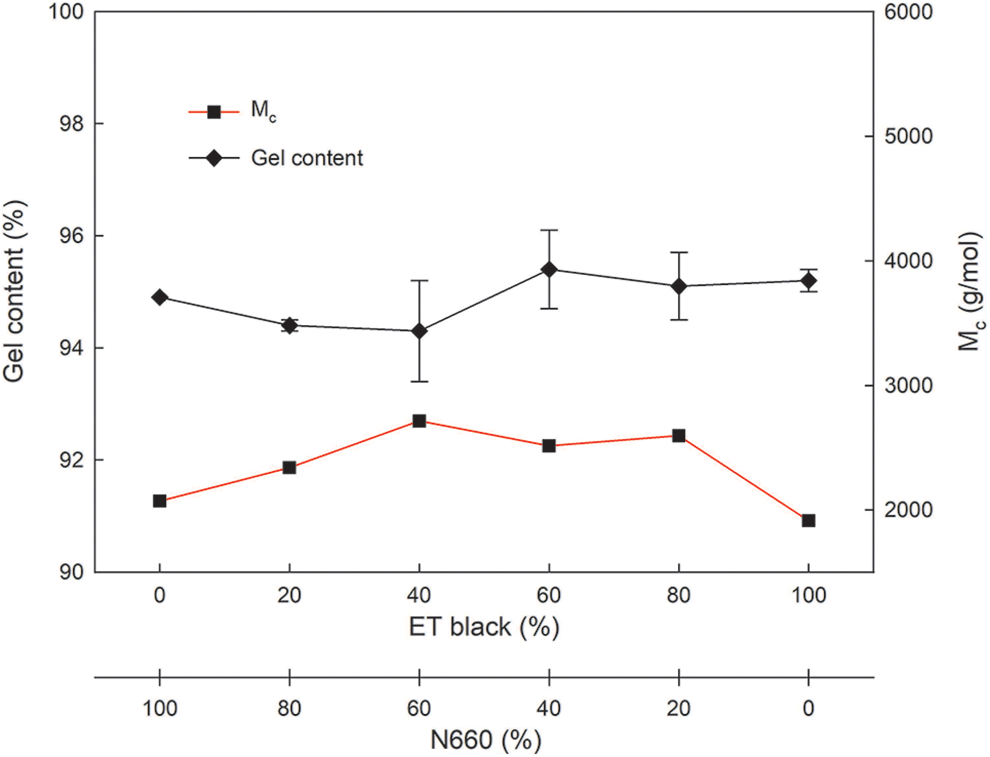
Gel content and molecular weight between cross-links of SBR compounds.
To evaluate the different types of carbon blacks on the curing behavior of rubber compounds, the cure meter was used. Table 2 presents the curing parameters on those compounds. In the SBR composite systems, ML (minimum torque), an index of viscosity of uncured compounds, increased with increasing ET black contents. This suggested a higher compound viscosity and aggregation power for ET black filler due to the existence of relatively more hydrophilic ingredients through EDS analysis. This acid affinity of hydrophilic ingredients would affect the curing degree as well, which led to the slightly lower MH (maximum torque) with increasing ET black content in SBR compounds, from 16.25 to 15.91 (dN m). Interestingly, TS2 (Scorch time), a process safety index, slightly decreased from 5.46 min to 5.22 min with increasing ET black content. Likewise, TC90 (90% cure time), a curing rate index, slightly increased with increasing ET black due to the existence of relatively more hydrophilic ingredients. It appeared that ET black posed a negative curing effect on the SBR compounds; however, strictly speaking, the variation was still quite limited in considering the sufficient gel content involved.
Cure characteristics of SBR compounds.
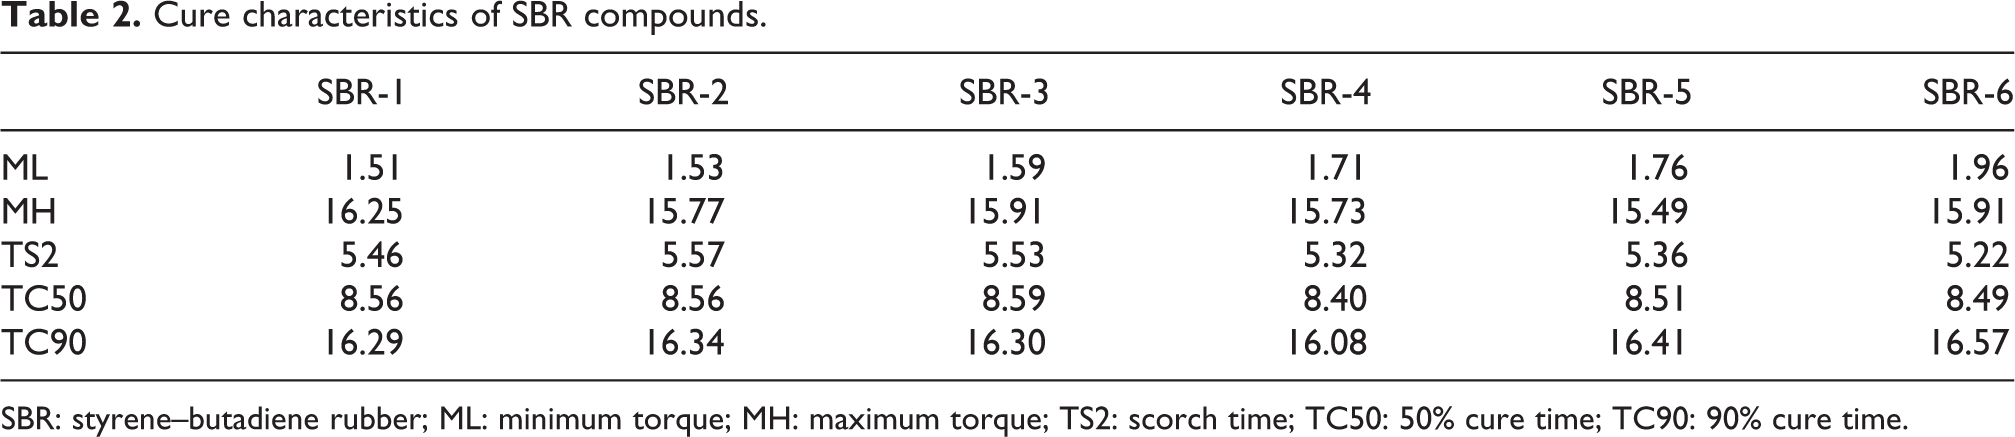
SBR: styrene–butadiene rubber; ML: minimum torque; MH: maximum torque; TS2: scorch time; TC50: 50% cure time; TC90: 90% cure time.
Dynamical mechanical properties
Viscoelastic behaviors of the SBR and NR compounds with various contents of ET black to replace N660 were investigated using a dynamic mechanical analyzer, as seen in Figure 5. The T gs at the peak maximum of tan δ are listed in Table 3. In general, a small variation from −54.8°C to −51.5°C was observed. The variation was considered to be limited as the temperature control at low temperature range was often considered to be more difficult due to the equipment design. In general, the tan δ curves did not appear to show much difference via the replacement of N660 with ET black in the rubber compounds. For rubber compounds to be used in the tire industry, the values of tan δ at low temperature (0°C) and high temperature (50°C) representing the wet traction index and rolling resistance index, respectively, were often used to evaluate the tire performance. Interestingly, by taking a close look at their trend with increasing the ET black content, tan δ at low temperature (0°C) and high temperature (50°C) marginally increased. Even though the increment was very small, it seemed to indicate a slightly higher wet traction index and a rolling resistance index for SBR compounds. Unfortunately, the performance of hydrophilic inorganics like silica being used to improve the rolling resistance of tire was not clear in this case. Still, these results suggested a smaller improvement for ET black in terms of wet traction for the current compounds.

Tan δ curves of SBR compounds.
Dynamical mechanical properties of SBR compounds.
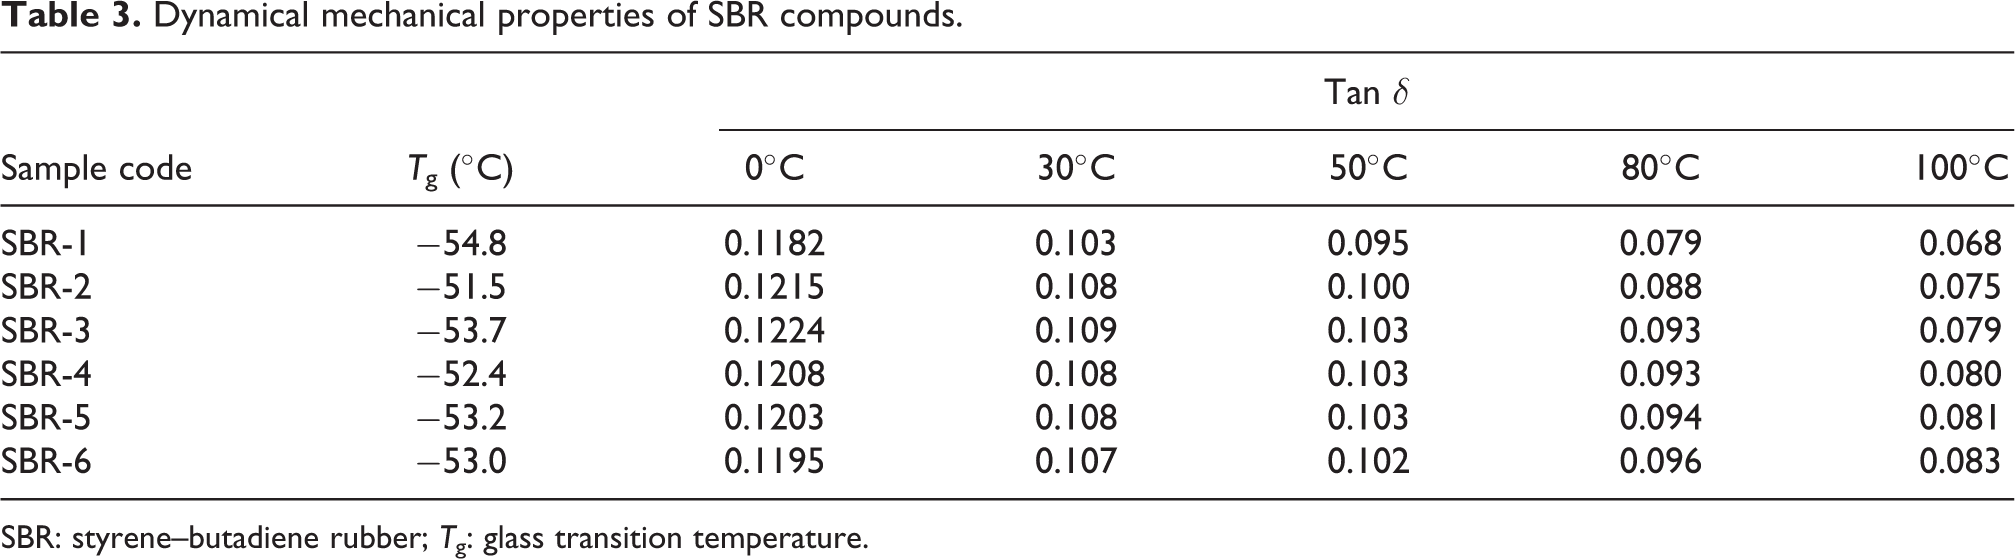
SBR: styrene–butadiene rubber; T g: glass transition temperature.
Morphology
For the fracture morphology of compounds, the SEM photographs of SBR compound materials are shown in Figure 6. It was shown that the dispersion degree of the N660 filler for SBR-1was quite uniform, as seen in Figure 6(a). A similar situation was also observed for a lower amount of ET black ratio. Yet it appeared that some filler agglomerate was found for higher amounts of ET black ratio. The increased agglomerate sizes were attributed to the slightly higher hydrophilic nature of ET black, as characterized in the surface morphology and EDS images of neat particles earlier. This effect also tended to increase the roughness of the fractured surface. However, the dimension of agglomerates was still in a few micrometer in size, which was expected to not deteriorate the mechanical properties much. The evaluation of the mechanical properties will be discussed in the following section.

Morphology of (a) SBR-1, (b) SBR-2, (c) SBR-3, (d) SBR-4, (e) SBR-5, and (f) SBR-6.
Mechanical properties
Tensile test
As discussed earlier in the SEM morphology, there seemed to be a certain degree of filler agglomeration for rubber compounds filled with higher amounts of ET black. It is interesting to see how this affects the mechanical properties of investigated compounds. The results of stress–strain curves of their tensile properties are shown in Figure 7. Basically, the tensile curves started at very similar curves in the low elongation at break range. It appeared to show the beginning of divergence at the elongation at break above 100%. In considering the low deformation region, Figure 8(a) shows Young’s modulus of SBR compounds. Young’s modulus of SBR/N660 (SBR-1) was about 6.7 ± 0.2 MPa, and the value for the SBR/ET black (SBR-6) compounds was about 6.9 ± 0.2 MPa. In addition, no much variation of N660/ET black ratio on Young’s modulus, indicating a similar resistance to small deformation. In addition to Young’s modulus, M300, stress at 300% strain, is also delineated in Figure 8(a). A progressive decrement of ca. 20% in M300 from 15.2 MPa (SBR-1) to 12.4 MPa (SBR-6) for SBR compounds with increasing ET black ratio in the fillers was clearly observed. This continue decrement was attributed to the less reinforcing degree of ET black with noncarbon black ingredients under higher deformation condition.

Tensile curves of SBR compounds.

Tensile properties (a) Young’s modulus and M300 and (b) tensile strength and elongation at break.
Figure 8(b) shows the tensile strength of SBR compounds at various ratios of ET black to N660. Without any ET black, the tensile strength of the SBR compound was at 20.1 MPa. To further elucidate the effect of the ET black, other compositions of ET black were added, and it was found that the tensile strength of SBR compounds decreased slightly. At higher ET black contents of N660/ET black 20/80 and 0/100, a large decrement of more than 10% was observed. Based on this evaluation, ET black could replace 20% in N660 without much influence for SBR compounds in terms of tensile strength. From the aspect of tensile strength, the ET black effect in SBR compounds was not significant. This decrement at higher ET black content was mainly attributed to more Si and Zn impurities to pose the potential defects, especially under large deformation state in tensile deformation. Considering the small deformation as in the case of Young’s modulus and large deformation as in the tensile strength, it was quite essential to realize that the defect or flaw size would affect these mechanical properties in a different degree.
Likewise, a similar evaluation was performed in terms of elongation at break, as shown in Figure 8(b). Owing to the low reinforcing degree of ET black, higher elongation at break of SBR compounds at increasing ET black ratio to N660 was found, although the iodine number of ET black was about twofold than that of N660. It appeared that these impurities affected the reinforcement of ET black, which led to slightly larger elongation at break in the ET black systems. Surprisingly, these impurities did not deteriorate the elongation at break at higher ET black content. However, the difference was rather limited if considering the large error in the determination of elongation at break. Overall, the basis of tensile properties should be assessed carefully to exploit the reinforcement or softness of PCB for suitable applications.
Tear test
To further investigate the fracture behavior of SBR compounds, a tear test was used to measure their tear strength. Figure 9 shows the tear strength of SBR compounds at various ratios of ET black to N660. Without the addition of ET black in N660, the tear strength of the SBR compound was at 51.5 N mm−1. To further evaluate the effect of the ET black to replace N660, various contents of ET black were added, and it turned out that the tear strength of SBR compounds was still quite high at higher ET black content. It appeared that ET black could substitute N660 in a great degree in terms of tear properties. This was mainly due to the insensitive merit of tear strength to the defects or flaws, unlike tensile strength. Thus, it was quite beneficial to consider the merit of PCB in terms of the applications required for tearing resistance.

Tear strength of SBR compounds.
Abrasion test
To better understand the abrasion resistance of SBR compounds, an abrasion test was carried out to measure their ARI. Figure 10 shows the ARI of SBR compounds at various compositions of ET black and N660. The highest ARI (131.1%) was reported for the N660-filled compound. At 20% replacement of ET black, the ARI was about 130.1%. With increasing the ET black content, the ARI progressively decreased. The abrasion resistance was generally considered as a combination of mechanical, mechanochemical, and thermochemical processes. 24 The low abrasion resistance of ET black might be attributed to the presence of low-structured impurities of ET black in comparison with the well-defined structure of N660. It was suggested that ET black could only replace N660 in a small percentage in terms of abrasion resistance.
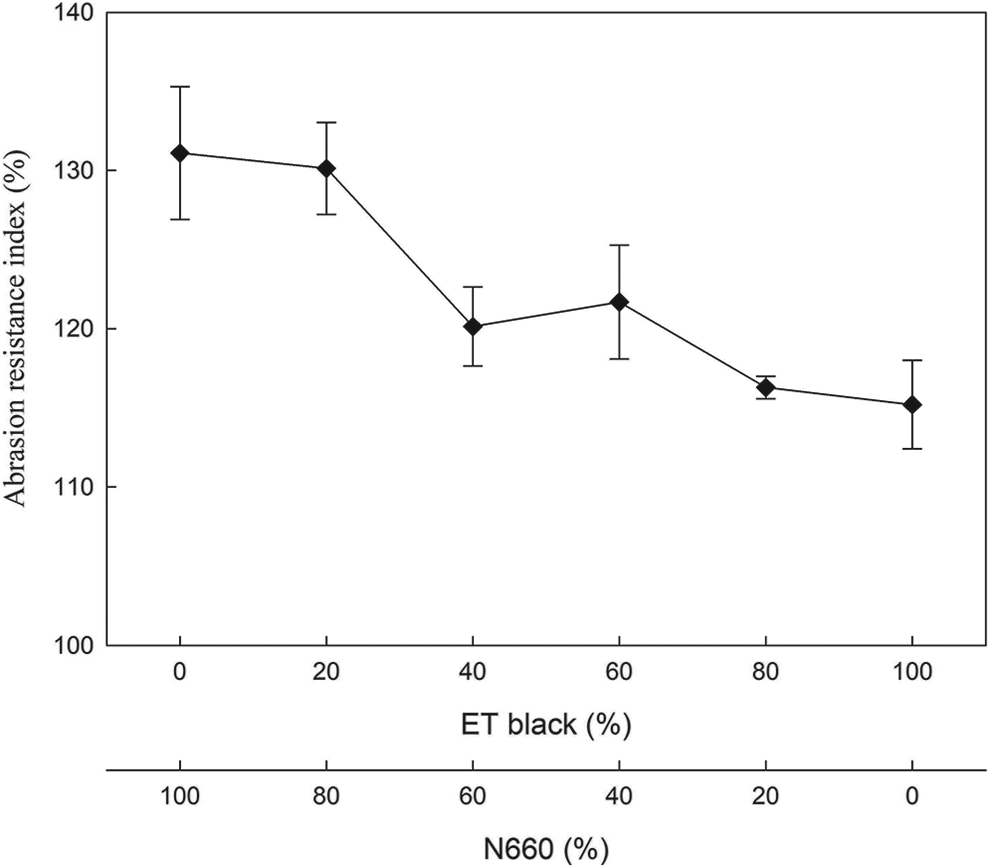
Abrasion resistance of SBR compounds.
HBU test
To further evaluate the heat generation of SBR compounds subjected to a dynamic compressive strain, a heat buildup test was used to measure the increase of compound temperatures. Figure 11 shows the heat buildup results of SBR compounds at various ratios of ET black to N660. The increase in temperature for the SBR compounds without the addition of ET black in N660 was at 34.7°C. This increase in temperature was mainly attributed to the hysteresis of the compound under the cyclic process. To further investigate the addition of the ET black to replace N660, a complicated result was observed. Owing to the small number of impurities at the low amount of ET black, it seemed to disrupt the reinforcing effect of N660, which led to the slight decrease in the viscous heating and heat buildup (31.5°C). On the other hand, with increasing ET black ratio, the temperature increase was higher, perhaps due to the higher amount of impurities agglomerates. Additionally, the low thermal conductivity of those impurities in comparison with carbon black was the possible cause. 25 However, strictly speaking, the temperature variation from this difference of hysteresis effect was not significant but was informative in terms of some potential applications.

HBU of SBR compounds.
Conclusions
Different percentages of N660 were replaced with ET black in SBR compounds using standard ASTM recipes. The smaller particle aggregate size was found for ET black in comparison with N660 in the water media. Higher compound viscosity and aggregation power for ET black filler was due to the existence of relatively more hydrophilic ingredients through EDS analysis. A progressive decrement of nearly 20% in M300 for SBR compounds with increasing ET black ratio in the fillers was clearly observed. Based on the evaluation of mechanical properties, ET black could potentially replace 20% in N660 without much influence for SBR compounds in terms of tensile strength and tear strength. Unfortunately, with increasing the ET black content, the ARI progressively decreased. The application of using PCB to cut down carbon footprint was quite essential. Further works will be needed to expand their applications in various areas.
Footnotes
Acknowledgements
The grant support from Enrestec Inc. is greatly appreciated. The authors are grateful to Mses. Yu Han Huang and An-Chih Cheng for helping in manuscript preparation.
Declaration of conflicting interests
The author(s) declared no potential conflicts of interest with respect to the research, authorship, and/or publication of this article.
Funding
The authors disclosed receipt of the following financial support for the research, authorship, and/or publication of this article: The author(s) received grant support from Enrestec Inc. for the research, as stated in the Acknowledgements above.