
Abstract
The aim of this study was to synthesize and characterize nano-hydroxyapatite-silica (nano-HA-Si) particle, followed by the evaluation of surface roughness and sol-sorption property of conventional glass ionomer cement (cGIC) with the addition of nano-HA-Si. Nano-HA-Si was synthesized by one-pot sol–gel technique. It was then characterized using Fourier transform infrared spectroscopy, X-ray diffraction, scanning electron microscope, and transmission electron microscope. Experimental nano-HA-Si–added GIC (nano-HA-Si-GIC) was prepared by adding 10% by weight ratio of nano-HA-Si to cGIC powder. The surface roughness of the samples was analyzed using tactile profilometer. Mass stabilization techniques were used to assess sol-sorption. The 10% nano-HA-Si-GIC samples were successfully fabricated. Nano-HA-Si-GIC reported lower surface roughness (0.13 ± 0.01 μm) as compared to cGIC (0.16 ± 0.03 μm). Nano-HA-Si-GIC reported an increase in sol-sorption when compared to cGIC. Incorporation of nano-HA-Si into the formulation of cGIC enhances their physical properties and with slight increase in sol-sorption property. Nano-HA-Si-GIC has the ability to enhance the characteristics of glass ionomer dental restorative materials. Hence, it can be suggested as a potential future restorative material in dentistry.
Keywords
Introduction
Glass ionomer cement (GIC) is a very discrete direct restorative material. The main differentiating factor between GIC and other dental restorative materials is their chemistry. The chemistry and the acid–base chemical reaction by which it sets is the reason for its various clinical applications. GIC is a biocompatible, 1 translucent, 2 tooth-colored, 3 self-adhesive to tooth, 4,5 and anticariogenic 6 restorative material. Based on these properties along with its tolerance to moisture, GIC is being used for many dental applications, such as lining, luting, filling, fissure sealants, and atraumatic restorative technique (ART). 7,8
Inside the oral cavity, the interaction between oral fluids and dental restorative materials is unavoidable. As a result of this interaction, there is fluid uptake by the resin-based dental restorations. This fluid uptake occurs as a combination of absorption and adsorption process. Absorption is the process by which a liquid molecule penetrates into a solid structure through diffusion. 9 On the contrary, adsorption involves adherence of a liquid molecule to the external surface of the solid structure. 9 The water uptake occurs mainly within the resin matrix, thus increasing the volume of the polymeric restorative material. 10 The sorption process has an adverse effect on the restorative material. It affects bond strength, color stability, and physicomechanical properties, thus reducing the material’s overall durability. 11
In dental restorative procedures, one of the well-documented factors that define the quality and contribute to the clinical success of the final restoration is smooth surface. 12 -14 Bollen et al. reported a critical threshold level of 0.2-µm surface roughness (Ra) for bacterial retention. 15 Furthermore, they suggested that Ra value of a dental restoration that exceeds a mean value of 0.2 µm results in an increase in plaque retention, thus increasing the chance for caries development and periodontal inflammation. 15 In addition, great emphasis has been given to research on evaluating the surface roughness of restorative materials and GIC, as smooth surfaces of the restorative material can influence wear and aesthetic quality of the materials. 16,17 Dental restorations with a smoother finish are also easier to maintain and reported to have a longer life in the oral cavity. 15,18
Historically, cGICs are mechanically weak and thus are not indicated for restoring stress-bearing areas inside the oral cavity. 19,20 Ideally, the ART requires a material with enhanced mechanical properties and bonding ability. Various types of GICs have been purposely formulated for ART restorations. In vitro studies have compared the performance of cGICs to high-density GICs. 19,20 Moheet et al. evaluated the mechanical properties and shear bond strength of nano-hydroxyapatite-silica (nano-HA-Si)–added GIC. 21 The author reported an improvement in mechanical properties with the addition of nano-HA-Si to cGIC. This addition has resulted in an increase in Vickers hardness, compressive strength, and flexural strength of approximately 36%, approximately 19.7%, and approximately 53.4%, respectively. Shear bond strength was also increased by approximately 17.34% in comparison to cGIC (Fuji IX GP, GC International, Japan). 21 These enhanced properties are suggested to be due to better packing of the nano-HA-Si crystals into GIC matrix. Even though nano-HA-Si–added GIC has demonstrated an improvement in mechanical properties, the data with regard to physical properties and fluoride ion are yet to be reported. Hence, the current study is carried out to evaluate the effects on color stability, surface roughness, and fluoride ion release upon the addition of nano-HA-Si into cGIC.
Therefore, the objective of this study was to synthesize and characterize nano-HA-Si particles, followed by the assessment of surface roughness and sol-sorption properties of the nano-HA-Si–added GIC in comparison to cGIC.
Materials and methods
Materials
Commercialized GIC (Fuji IX GP) dispensed in powder and liquid state was utilized in the current study. Analytical grade chemicals were used for the synthesis of nano-HA-Si. The chemicals used in the current study were calcium hydroxide (<98%; RM Chemicals, India), phosphoric acid (<99%; Sigma-Aldrich, Germany), tetraethyl orthosilicate (TEOS, 99%; Fluka, Germany), ethanol (99%; Systerm, Malaysia), ammonia (99%; Sigma-Aldrich), and total ionic strength buffer III (Sigma-Aldrich).
Synthesis of nano-HA-Si
Nano-HA-Si powder was synthesized by a one-pot sol–gel method. 21 Calcium hydroxide (7.408 g) was dissolved in 100 ml of distilled water. This suspension was mixed with a magnetic stirrer for 30 min; 4.104 ml of phosphoric acid was added dropwise to calcium hydroxide suspension. 21 This suspension was stirred for 48 h. Liquid ammonia was used to maintain the pH of the suspension between 11 and 12. After 12 h, a quantity of 20 ml TEOS was dissolved in 10 ml of absolute ethanol. This mixture of TEOS and ethanol was added dropwise to calcium hydroxide suspension. After 48 h, the white sol produced was centrifuged (Eppendorf Centrifuge 5804, Germany) followed by 24 h of freeze-drying (ScanVac CoolSafe, Denmark) and later calcined (WiseTherm, Germany) at 600°C. The calcined powder was grounded manually using a mortar and pestle for 10 min. 21
Characterization of nano-HA-Si
Fourier transform infrared (FTIR) absorption spectra (Perkin-Elmer 2000 FTIR spectrometer) of nano-HA-Si powder were measured in the frequency range of 600–4000 cm−1. The qualitative assessment of the fabricated nano-HA-Si powder was carried out by X-ray diffraction (XRD; Axis Ultra DLD XPS, Kratos, Trafford Park, Manchester, UK). The XRD analysis was carried out at 10 to 60° at a rate of 0.02 min−1. Cu-K radiation was used at 10 mA and 30 kV. Crystalline phase determination was carried out by comparing the XRD pattern with International Center for Diffraction Data. Morphology of the nano-HA-Si samples was studied using scanning electron microscope (SEM) (FEI, Quanta FEG 250, Thermo Fisher Scientific™, Oregon, USA) that was operated at 20 keV, with chamber pressure less than 50 mTorr. Transmission electron microscope (TEM) (FEI, TECNAI G2 20 S-TWIN) was operated at an acceleration voltage of 120 kV and objective lenses with resolution point of 0.34 nm. Samples for SEM and TEM microstudies were gold coated prior to analysis.
Preparation of nano-HA-Si–added GIC samples
GIC samples were hand mixed at 1:1 powder/liquid ratio following manufacturer’s instructions. Nano-HA-Si-GIC samples were prepared following the same powder/liquid proportions. Nano-HA-Si powder was weighed and added to cGIC powder at a percentage by weight of 10%. The powder mixture of nano-HA-Si and cGIC was hand mixed by mortar and pestle for 10 min. 21 Forty specimens were prepared in total. Sample size for each group was 10 (n = 10). The details of the experimental groups for different investigations are shown in Table 1. The specimens were then tested for color stability, surface roughness, and fluoride ion release.
Experimental groups with their corresponding sample size.
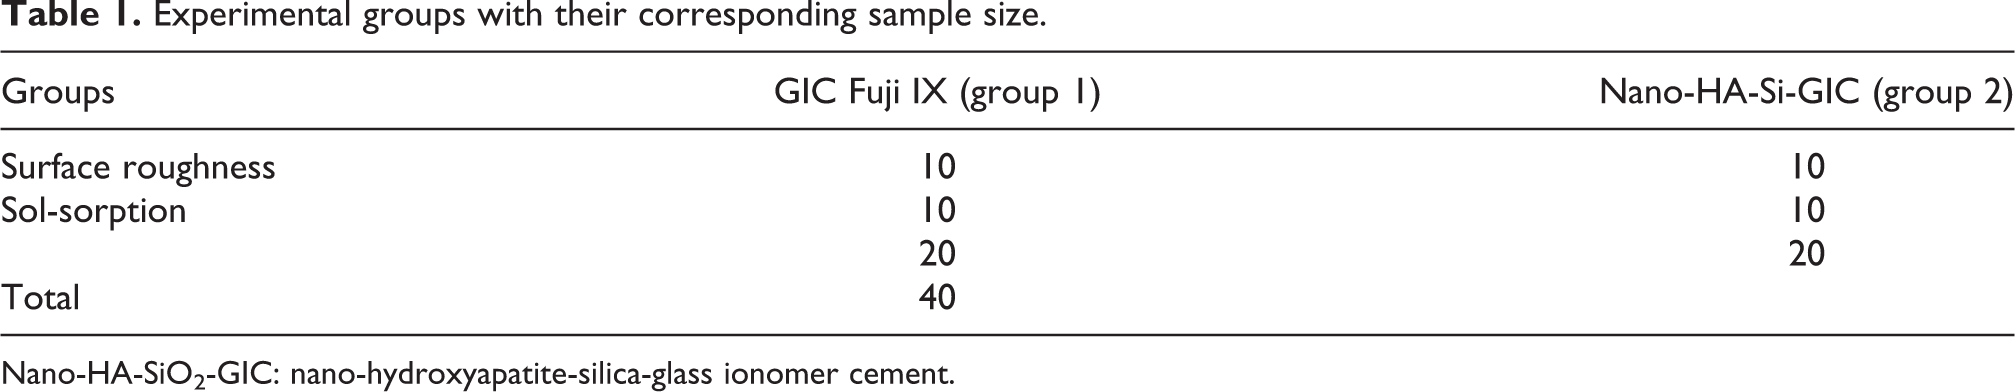
Nano-HA-SiO2-GIC: nano-hydroxyapatite-silica-glass ionomer cement.
Surface roughness
Ten specimens for surface roughness evaluation were prepared using disc-like, plastic ring molds measuring 10 mm in diameter and 2 mm in depth (10 × 2 mm2). The molds were filled with uncured cement and covered by cellophane strips on both sides. Each mold was covered with cellophane sheet and compressed between two glass slides with a gentle hand pressure to remove excess cement and obtain a smooth flat surface. No additional finishing procedure was performed. The samples were then stored in 100% humidity at 37 ± 1°C for 24 h. The surface roughness (Ra, μm) of the samples was analyzed using tactile profilometer (Surfcom flex-50A, ZEISS, Germany). Three measurements were taken passing through the center of each specimen and the mean of measurement was recorded. The cutoff value for surface roughness was set at 0.8 mm and a traversing distance of the stylus was 4 mm. The measuring force and stylus speed were set at 8 mN (0.8 gf) and 0.3 ms−1, respectively.
Sol-sorption
Ten sol-sorption specimens were prepared in disc-shaped molds measuring 10 × 2 mm2. As previously mentioned, the same hand pressure technique was used for smoothening and removing of air bubbles from the mold filled with cement. Specimens were stored in a desiccator with silica gel at 37 ± 1°C for 22 h and stored in a second desiccator with silica gel at 25 ± 1°C for 2 h. The samples were then weighed in a digital analytical balance (Mettler Toledo™ and Fisher Scientific™, Oregon, USA). This cycle was repeated until a constant weight was achieved (m 1), which was represented by mass variations of less than 0.1 mg. After weight stabilization, the samples were stored in artificial saliva (AS) at 37 ± 1°C for 7 days. AS was freshly prepared according to the composition proposed by Fusayama, Katayori. 22,23 The pH of the newly prepared AS was 5.2, which was checked using a pH meter and was adjusted by adding 1 M of sodium hydroxide (NaOH) until a pH of 7.2 was obtained.
Specimens were then removed from AS, dried with absorbent paper, and weighed for the second time (m 2). Following the protocol used for m 1, samples were reconditioned in the desiccator until a constant weight was achieved (m 3). The volume (V) of each specimen was calculated in cubic millimeters. Water sorption (W sp) and solubility (W sl) ratios were calculated for each specimen using the following equations:


Statistics
All the data were analyzed using SPSS version 23 (IBM Corp., Newyork, USA). Repeated measure analysis of variance and Bonferroni correction were used to determine the intergroup significant differences between nano-HA-SiO2-GIC and cGIC for surface roughness. Independent t-test (two-tailed) was used to analyze the significant difference for sol-sorption between nano-HA-SiO2-GIC and cGIC. A value of p ≤ 0.05 was considered statistically significant.
Results
Characterization of synthesized nano-HA-Si
X-ray diffraction
Figure 1(a) shows the XRD pattern of the sintered nanopowdered at 600°C. The XRD patterns include a strong peak at approximately 32° conforming to (211) hkl planes of HA crystalline structure. Number of counts specifies that nano-HA crystals possess higher degree of crystallinity. Shoulder peaks approximately 32° (112) and (300 planes) are not as predominant as in pure HA crystal that may be as a result of silicon doping. Sharp peaks at 26°, 40°, 47°, 50°, and 53° relate to (002), (222), (213), (004), and (130) hkl planes, respectively.

Characterization of nano-HA-Si powder (a) XRD, (b) EDX spectrum, and (c) FTIR.
Energy dispersive X-ray (EDX) spectrum in Figure 1(b) confirms the synthesis of the nano-Ha-Si powder. Elemental composition of the nanopowder confirms the presence of phosphorus, silicon, oxygen, and calcium in the EDX spectrum. K-alpha lines of Si, O, P, and Ca are present while L-alpha line of Ca was also observed.
Fourier transform infrared
Figure 1(c) exhibits the FTIR spectra of nano-HA-Si powder detected at stretching frequencies (3574,1452, 1023, 873, 809, 667, and 605 cm−1). The phosphate PO43− bands were observed at wave numbers of 1023 cm−1 (PO asymmetric stretching) and 605 cm−1 (OPO bending). Peak at 873 cm−1 characterizes the hydroxyapatite particles (HAP) with deficiency of calcium referring to nonstoichiometric HAP. The hydroxyl bending bands of HA were recognized at wave number of 667 cm−1 (OH inplane bending). The bands inferring to absorbed water were also detected at wave number of 3574 cm−1. The absorption band at wave numbers 809 cm−1 was attributed to Si–O–Si tetrahedral structure. The absorption bands that appeared at 1452 cm−1 were suggestive of the existence of the carbonate ion, which may have developed as a result of dissolved carbon dioxide (CO2) during the crystallization process.
SEM and TEM evaluation
Figure 2(a) and (b) shows the SEM and TEM micrographs of the nano-HA-Si powder. The elongated crystals belong to HA are covered by smaller spherical silica particle. Both HA and silica crystals were of nanosize. HA crystals were between 100 nm and150 nm, while silica crystals were approximately 40 nm. SEM dot-mapping displays the microstructure of the modified GIC with a fine dispersion of phosphorus and silicon particles in the glass matrix (Figure 2(c) and (d)).

Micrographs and dot-mapping for nanopowder: (a) SEM, (b) TEM, (c) phosphorus dot-mapping, and (d) silicon dot-mapping.
Surface roughness
Mean surface roughness (Ra) value and standard deviation for cGIC and nano-HA-Si-GIC are presented in Table 2. The lowest surface roughness was reported for nano-HA-Si-GIC 0.13 ± 0.01 µm on day 1, which was significantly lower as compared to Ra value for cGIC 0.16 ± 0.03 µm (p ≤ 0.05). Surface roughness for both cGIC and nano-HA-Si-GIC shows a gradual increase over a period of time (Figure 3). Highest surface roughness for both experimental materials was observed on day 28. Nano-HA-Si-GIC reported surface roughness value of 0.2 ± 0.02 on day 28, which was same as to surface value of cGIC 0.2 ± 0.03 µm with no statistical difference between the two.
Mean and standard deviation of surface roughness for experimental groups.

Nano-HA-SiO2-GIC: nano-hydroxyapatite-silica-glass ionomer cement.
a A significant difference between the control group and nano-HA-Si-GIC (p ≤ 0.05).

Surface roughness (Ra, μm) profile for nano-HA-Si-GIC and cGIC.
Sol-sorption
Mean sol-sorption values with standard deviation are presented in Table 3. Independent two-tailed t-test was done to find the significant difference between the experimental materials. Nano-HA-SiO2-GIC recorded higher values for both solubility and sorption as compared to cGIC. Results reported for sorption of nano-HA-SiO2-GIC (48.38 ± 12.80 μg mm−3) were significantly higher than that of cGIC (42.64 ± 6.74 μg mm−3), whereas solubility value reported for nano-HA-SiO2-GIC (63.66 ± 11.23 μg mm−3) was also higher than cGIC (56.65 ± 10.15 μg mm−3) but it was found to be statistically not significant (Figure 4).
Mean and standard deviation of sol-sorption for experimental groups.
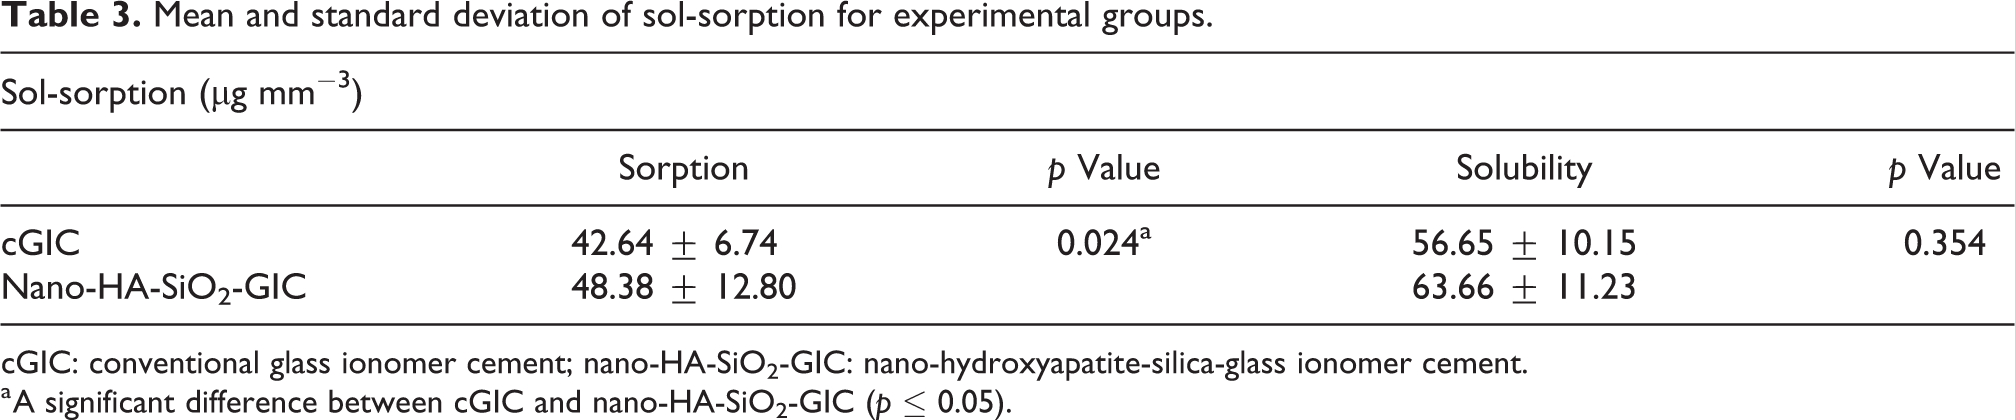
cGIC: conventional glass ionomer cement; nano-HA-SiO2-GIC: nano-hydroxyapatite-silica-glass ionomer cement.
a A significant difference between cGIC and nano-HA-SiO2-GIC (p ≤ 0.05).

Graphical representation of sol-sorption between nano-HA-Si-GIC and cGIC.
Discussion
In the current study, synthesis and characterization of nano-HA-Si have been successfully achieved and employed to synthesize nano-HA-Si powder. The characterization of the nanopowder was performed through FTIR, XRD, SEM, and TEM.
Characterization of nanopowder
FTIR analysis confirmed the presence of functional groups in the synthesized nanopowder. FTIR spectra of nano-HA-Si were observed at stretching frequencies (3574,1452, 1023, 873, 809, 667 and 605 cm−1). The peaks are in correspondence with previous work and the formation of nano-HA-Si composite by one-pot sol–gel method could be suggested. 24 -27 XRD diffractogram shows a crystalline material, which is also in agreement with the earlier work. 21,27 The micrographs confirm that the asymmetrically elongated rod-like structures are indeed HA crystallites (Figure 2(a)), which has been documented in past studies, 28,27 while the smaller spherical structures embedded between the elongated HA are the silica particles. 29 -31 These micrographs confirmed the assumption that both of the particles were in nanoscale range. The elongated HA particles measured to a length of 100–150 nm, while silica particles having a mean size of approximately 40 nm. These observations were in agreement with the previous work done by several authors. 29,31 -33 SEM dot-mapping shows spatial distribution of phosphorus and silicon in the GIC powder (Figure 2(c) and (d)). The microstructure of the GIC composite with well-distributed packing of phosphorus and silicon is shown in Figure 2(c) and (d), respectively. Both of these elements were evenly dispersed throughout the scan area.
Surface roughness
Surface roughness is an essential criterion for restorative material as it affects surface topography and has many clinical consequences. 34,35 The surface roughness of a restorative material depends on multiple factors, such as shape, size, number, and distribution of particles. 36 Surface roughness is typically indicative of physical wear and deterioration of a restorative material. 34,35 Surface roughness has been identified as one of the precursors to bacterial adhesion that could lead to a risk of caries and periodontal disease. 15
GIC is commonly used as a material of choice for ART in dentistry. Hence, it has to function for a long period and should be able to withstand bacterial adhesion to its surface. Therefore, it is critical to evaluate the initial surface roughness of cGIC. One of the common techniques for measuring surface roughness is taking the arithmetic mean of peaks and valleys measured through the centerline of the sample profile. 37
In the current study, the mean values of Ra were in the range of 0.13–2.2 µm for both experimental groups. The lowest Ra was observed on day 1 for nano-HA-Si-GIC (0.13 ± 0.01 μm), which was significantly lower than the Ra value for cGIC (0.16 ± 0.03 μm) recorded on day 1. These Ra values are in accordance with the result reported by Lopes et al. 38 Lopes et al. investigated the addition of HA into glass carbomer and reported Ra value of 0.20 ± 0.07 μm, which is higher than the Ra value achieved for nano-HA-Si-GIC in the current study. The Ra values for nano-HA-Si-GIC and cGIC in the current study increase with time and reported similar surface roughness values on day 21 (0.19 ± 0.02 µm and 0.19 ± 0.03 μm) and day 28 (0.22 ± 0.02 µm and 0.22 ± 0.03 μm; Figure 3). This gradual increase in surface roughness could be the result of the loss of the surface layer as a result of storage in distilled water, leading to exposed glass particles. Thus, this could be the possible reason for an increase in surface roughness over a period of time.
As reported by Bollen et al., surface roughness that is higher than 0.2 µm can lead to increased microbial adhesion and plaque accumulation, further leading to increased risk of caries and periodontal disease. 15 It is reported that surface roughness can also be responsible for the way light reflects that, in turn, can make the material surface opaque. 39 It has been proven that a surface is considered reflective when its defects are below 1 μm. 39 In the current study, the Ra value for nano-HA-Si-GIC was well below 1 μm. Therefore, nano-HA-Si-GIC is believed to be less prone to microbial adhesion and is more aesthetic compared to cGIC.
Sol-sorption
One of the weaknesses of GIC is that it is hydrolytically susceptible at initial stages of setting when exposed to air and moisture. Wang et al. reported that water sorption and solubility is one of the most critical attributes for a restorative material. 40 Water is the main reaction medium for GIC; it is an essential component to form an ionic cross-linking and for poly-salt bridge formations. 41 If cGIC is exposed to moisture, GIC can absorb water and leach out important ions. Deterioration of the mechanical properties can be one of the consequences of water loss or uptake in the initial stages of the setting reaction. 42 Therefore, GIC weight stabilization was selected as one of the parameters for material evaluation.
Resin-based restorative materials must conform with ADA specification no. 27 and ISO Standard 4049, 43 which states that the water sorption value for any material should not surpass 40 μg mm−3 after 7 days of storage in water. When the water sorption for any given material exceeds the ISO recommended value, it would interfere negatively with the material properties consequently affecting their clinical outcomes and biocompatibility. 44 In the current study, water sorption values for both nano-HA-Si-GIC (48.38 ± 12.80 μg mm−3) and cGIC (42.64 ± 6.74 μg mm−3) were higher than the ISO recommended value of 40 μg mm−3. Despite these sol-sorption findings, Moheet et al. 21 reported an increase in mechanical properties for nano-HA-Si-GIC than conventional GIC. 21 Therefore, this could be an area of further investigation to find out whether this increase in sorption for nano-HA-Si-GIC over an extended period of time has any effect and correlation with the mechanical properties.
The increase in sorption and solubility demonstrated by nano-HA-Si-GIC and cGIC can be linked with surface roughness property. Nano-HA-Si-GIC reported an increase in surface roughness over a period of time.
Conclusion
The characterization of the powder confirms the successful fabrication of elongated nano-HA and smaller spherical silica particle synthesized through one-pot sol–gel method. Within the limitation of this in vitro study, the addition of nano-HA-Si to cGIC (Fuji IX GP) did not only decrease the surface roughness of nano-HA-Si-GIC but also slightly increase the sol-sorption property. Surface roughness value for nano-HA-Si-GIC reported on day 1 was significantly lower than cGIC, suggesting less need of polishing to produce a good finish. Increase sol-sorption property needs further investigation as it might open doors for more clinical indication for GIC. In conclusion, nano-HA-Si-GIC has the ability to change the characteristics of glass ionomer dental restorative materials. This could lead to a restorative material with a better finish, esthetic and appearance.
Footnotes
Acknowledgement
IAM would like to thank USM for providing the USM global fellowship.
Declaration of conflicting interests
The authors declared no potential conflicts of interest with respect to the research, authorship, and/or publication of this article.
Funding
The authors disclosed receipt of the following financial support for the research, authorship, and/or publication of this article: This work was supported by the Malaysian Ministry of Higher Education under Fundamental Research Grant Scheme (FRGS/203/PPSG/6171173).