
Abstract
Nanotechnology has become one of the most popular areas of interdisciplinary research. In the vast majority of nanotechnology applications, polymer-based matrices were used as the dispersing medium of nanoparticles. The combination of polymer–zeolite nanocomposite has the potential to come out with the advantages of polymers and zeolites while coping with the deficiencies of both materials. In this study, the synthesis and properties of low-density polyethylene (LDPE) composites with nanozeolite + Y2O3 are investigated. Polyethylene nanocomposite fibers containing nanozeolite + Y2O3 at 5% by mass using a melt extrusion method were composed in a laboratory type twin screw extruder. The thermal properties of the composite fibers were determined by analysis of both thermal gravimetric and differential thermal spectra. Their structural properties were enlightened by scanning electron microscopy, Fourier transform infrared, and ultraviolet absorption. According to the results of X-ray diffraction tests, the samples contain crystals in semicrystalline and α form. The mechanical properties of LDPE matrices increased with the addition of nanoparticles. In addition, radioluminescence properties of the polymer were also improved after composing with nanozeolite and Y2O3.
Introduction
Polyethylene (PE) is one of the widely used polymers in the production of industrial materials. PE is especially modified with the addition of nanocomposites which increase the polymers thermomechanical stability and chemical resistance. 1 Nanocomposites, the newest type of composite materials, are produced by dispersing the nanoparticles through the polymers. Nanocomposites are known to have superior properties than normal composites or basic polymers. Significant differences occur in the chemical, physical, and functional properties of materials by producing them at nanolevel with today’s technology facilities. 2,3 The other advantages of nanocomposites to the material are increasing the elastic modulus, strengthening the material, increasing the heat resistance, and reducing the gas permeability and flammability. 4
A wide variety of nanoparticles are used in the synthesis of polymeric nanocomposites. For nanocomposite production, at least one of the components must be used in nanometer size. Low-density polyethylene (LDPE) nanocomposites are usually used for packaging and improvement of their properties are provided by using different fillers like zeolite. 5 Clay compounds can also be widely used for this purpose. As a popular usage of zeolites, polymer–zeolite composites are combined for providing better conditions of membranes. 6,7 Polymer–clay nanocomposites are obtained by the introduction of polymer molecules between clay layers or by polymerizing the monomer between layers. 8 Polymer nanocomposites containing a low amount of clay improve the properties of polymeric materials much more than the composites containing a high amount of clay. 9
Another component among commonly used in the synthesis of ethylene-based polymers is Y2O3. Usage of metal oxides in polymer composites is getting popular because of their capacity to distribute polymerization more properly in all over the polymer composite and other side materials inside the polymer. 10 Even though it does not clearly appear in the polymer, Y2O3 serves as an auxiliary for the polymerization of the nanozeolite. 11,12 In previous research efforts, yttrium and zeolite used separetely for improving polymer properties, but there is no further study searching how yttrium and zeolite act together for creating better polymeric conditions. 13
In this study, the changes in the thermal and structural properties of fibers by adding anatase phase containing Y2O3 + zeolite nanoparticles to LDPE-based fibers were investigated. In addition, radioluminescence (RL) behavior of the composite was determined. According to the results, more advanced materials can also be developed for future membrane technology.
Materials and methods
Materials
LDPE granules used in the production of fibers were supplied from Petkim Petrochemistry Company (İzmir, Turkey). The melt flow index of the polymer granules is 4.7 g/10 min. While the melting temperature is 108°C, the glass transition temperature is −90°C and Vicat softening point is 88°C for LDPE. Y2O3 particles used as fillers and stabilizers were purchased from Sigma-Aldrich (Darmstadt, Germany). The specific surface areas of Y2O3 particles in the anatase phase are between 30 m2 g−1 and 50 m2 g−1 particle sizes below 50 nm, and its melting point is 2410°C. To produce zeolite-based nanocomposites, powdered zeolite particulate was gathered from Manisa province.
Method
In the study, melting or melt blending method was chosen for the production of nanoparticle-based composites because of being cheap and environmentally friendly. Nanozeolite was obtained by the reaction of zeolite with aluminum sulfate, 14 and then mixed by equal weighing with Y2O3. In order to determine the most appropriate conditions, several parameters were applied. Firstly, the composite ratios between nanozeolite and Y2O3 were chosen as wt. 25:75, 50:50, and 75:25. Scanning electron microscopy (SEM) images of the mixtures were examined, and the smoothest blend was chosen as 50:50. Then, the optimum mixture ratio for PE + (nanozeolite and Y2O3) was determined by the application of wt. 2.5:97.5, 5:95, and 10:90%. According to those results, the prepared nanozeolite Y2O3 mixture was blended with melted LDPE (wt. 5:95), and the resultant new composite structure was analyzed by Fourier transform infrared (FTIR), ultraviolet (UV), X-ray diffraction (XRD), RL, SEM, and thermogravimetric (TG)/differential thermal analysis (DTA).
Findings
FTIR
The characteristic peaks for zeolite are observed at 3630, 1630, 1055, 673, and 607 cm−1. 15 The vibrations of Si–O–Si and Si–O–Al bands are seen in the region of 1200–950 cm−1 (Figure 1(a)). This band is important in terms of showing the aluminum content of the crystal structure. The tensile bond vibrations from quartz or amorphous SiO2 appear as a weak band at 795 cm−1. O–H vibrations in the 1600–3700 cm−1 region indicate the presence of structural water. The absorption peaks at 2942 and 2883 cm−1 are due to asymmetric and symmetrical CH2 stresses. 9,16
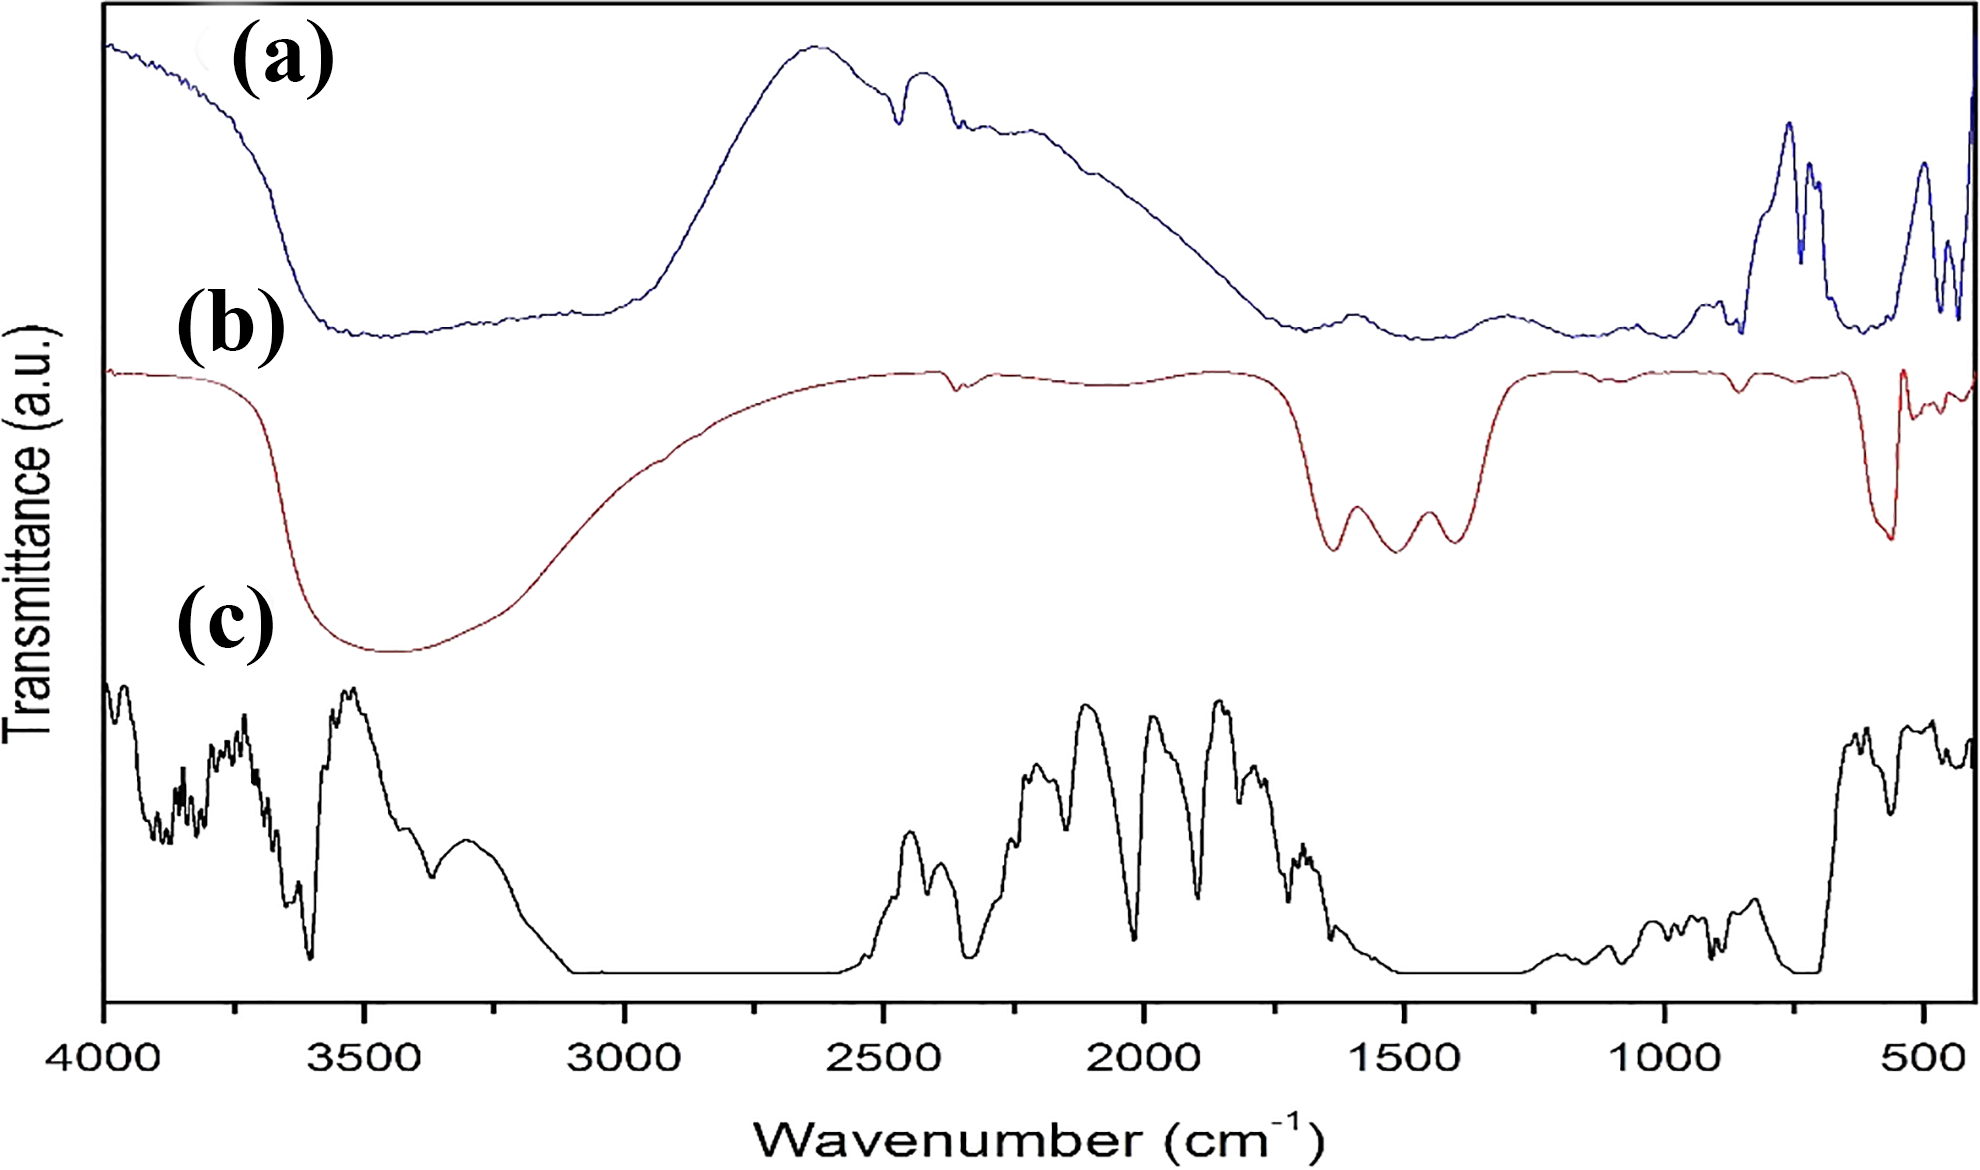
FTIR spectra of (a) pure zeolite, (b) pure yttrium oxide, and (c) the composite.
As pointed in the literature, 7,17 the peaks because of the presence of the M–O bond in Y2O3 were being observed between 400 cm–1 and 600 cm–1 (Figure 1(b)).
Considering the LDPE/(zeolite + Y2O3) composite, the peaks of the yttrium observed in the blend around 600 and 1300–1750 cm–1 moved to 490 and 1200–850 cm–1, and the peaks at 750, 1320, and 1400 cm−1 shifted to 700, 1300, and 1600 cm−1, respectively, showing the existence of zeolite inside the blend (Figure 1(c)).
UV absorption results
Sharp corners in the UV absorption spectrum show that the structure of zeolite and yttrium cause a beautiful crystallization. 18 LDPE, supported with 5% Y2O3 and 5% zeolite, shows the typical 220 and 250 nm bands of zeolite below 300 nm, and yttrium peak of 290 nm with more severe peaks at 250 and 270 nm (Figure 2). Only the permeability of the zeolite-added polymer composite appeared lower. The UV permeability of the zeolite polymer composite with Y2O3 is higher. The reason for these more intense peaks is that the distribution of yttrium in the polymer is being more homogenous.

UV absorption of the composite and its components.
Although UV rays cause degradation in polymer chains, the stabilizer role of yttrium is seen from the peak intensities that prevent this degradation. 19
XRD results
In this study, the structure of the nanocomposites was analyzed using XRD method to determine the distribution of zeolite and yttrium particles within the LDPE polymer matrix and to determine the change in the structure of the polymer matrix. All materials have been monitored by PANalytical X-ray diffractometer (Royston, UK) with a graphite monochromator with X-ray distribution Cu Kα radiation source. After the analysis, the 2θ angle on the obtained spectrum was determined and the interlayer distance values were calculated using the Bragg equation.
After the XRD spectra of LDPE polymer nanocomposites produced using zeolite particles were examined, a characteristic peak between 10°A and 30°A was determined pointing nanocomposites containing yttrium particles (Figure 3). There are many characteristic peaks observed in the XRD spectra of zeolite particles. Characteristic peaks of zeolite with higher peak density and height are determined within the range of 9.5–10.1°A, 22.0–22.7°A, and 30–36°A 11 ; 30, 35, 50 and 58°A are characteristic peaks for yttrium. 11,20 In literature, the typical diffraction peaks for LDPE are observed in all samples with peaks at 21.1, 23.8, and 36°A. 17 As Carotenuto et al. 21 pointed out, there is a possibility to observe the presence of the d-spacing of 0.335 nm peak around 26°A. In the XRD spectrum of zeolite particles, the interfacial distance values corresponding to the 2θ value of the peaks are in between 8.75°A and 9.30°A, and the same distances for LDPE polymer nanocomposites were calculated as 2.98–8.84°A. Hence, nanocomposite samples have lower interfacial spacing than zeolite particles.

XRD graph of the LDPE-(Y2O3 + zeolite) composite.
The characteristic XRD peaks of yttrium and zeolite appeared effectively in PE composite spectrum. While LDPE peaks were observed at 16, 32, 33, 40–45, and 57°A, the peaks belonging to zeolite moved to 9, 22, 30, 36, 52, and 55°A, and the peaks for yttrium were determined at 24, 38, 48, and 53°A. The spaces in the LDPE structure are filled by the additives, and the peak density of the PE in the lower d-space decreased. This limitation leads to a less extension in the zeolite–yttrium-doped composite. This is because yttrium oxide helps to polymerize while balancing zeolite. Observed more sharp peaks in XRD point out crystal phase in all over the composite structure.
As no peaks were observed at the low 2θ in the composite samples containing the particles, there was a peak determined with high 2θ. This indicates that the particles tend to clump more and that a completely or partially dispersed structure cannot be obtained. Therefore, it was concluded that the composite structures should better be called microstructure.
RL results
The RL spectra were recorded in an X-ray unit with a Machlett OEG-50A tube (Canoga Park, CA, USA) operating with a current of 15 mA and a voltage of 30 kV. The X-ray tube delivers white X-rays with a dose rate of 30 Gy min−1. The luminescence detection system is conducted with a Horiba Jobin Yvon spectrometer (Bensheim, Germany) coupled to liquid nitrogen-cooled CCD detector, and the RL spectra were measured between 200 nm and 1200 nm at room temperature with an integration time of 5 s. Input and output slits were set to a width of 2 mm.
Figure 4 shows the peaks for LDPE-Y2O3 composite and LDPE-zeolite composite separately.
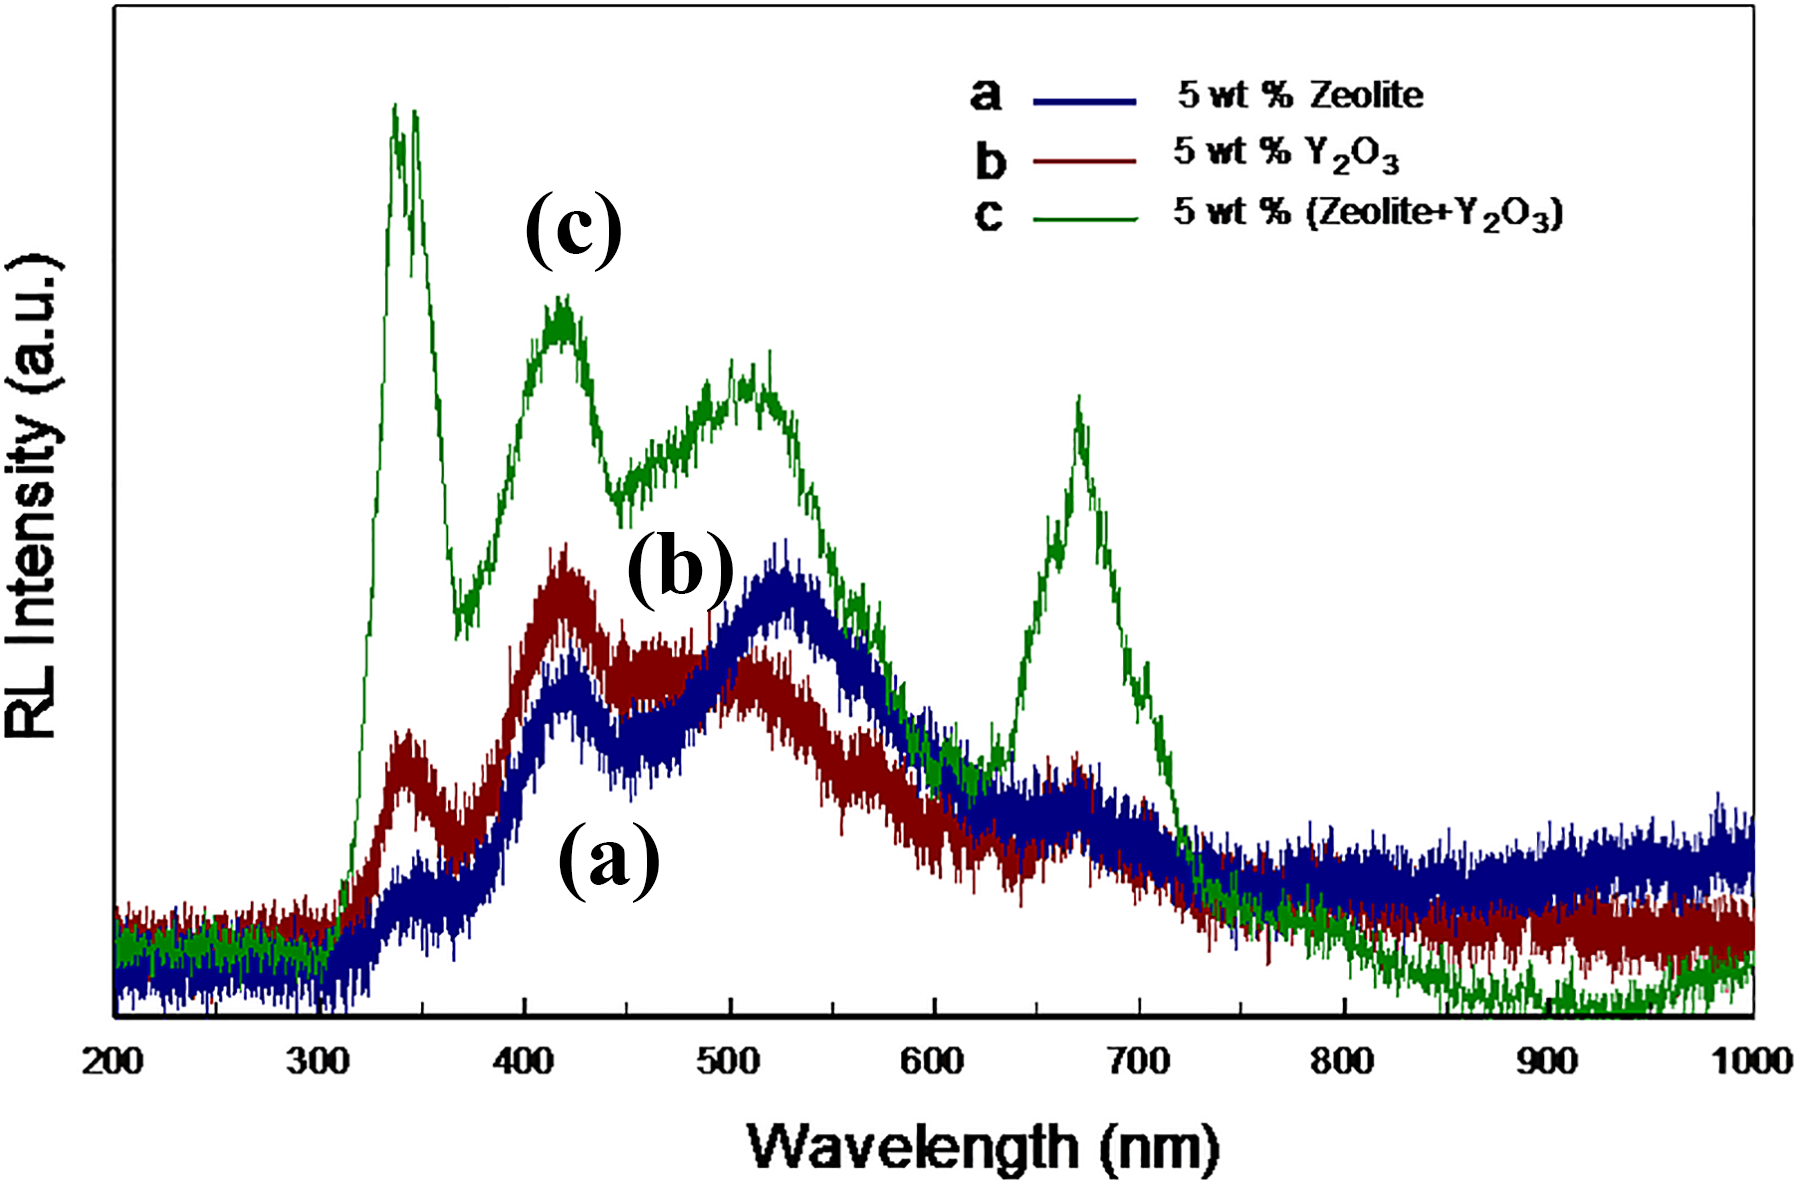
RL spectra of (a) the LDPE-Y2O3 composite, (b) the LDPE-zeolite composite, and (c) the LDPE-(Y2O3 + zeolite) composite.
Transition elements such as yttrium have a more electronic transition due to their d orbitals in their structures. 22,23 In general, the bonds between 4d-4d are the reason why the electronic transition of the trivalent yttrium is evident. Because of the vibrations in the structure, the yttrium gives the peak in RL at 330 and 400 nm, while the zeolite added to the structure yields peaks caused by the sp 3 orbitals vibrations of Si in the 500–550 nm region (Figure 4). When zeolite and Y2O3 are added to the LDPE together, the peaks at 350, 400, and 500 nm indicate that the RL properties remain the same. Strength of the peaks increased in the LDPE-(Y2O3 + zeolite) composite higher than LDPE-Y2O3 composite and the LDPE-zeolite composite (Figure 4(c)).
TG and DTA
This analysis technique quantifies the weight changes in the transformations occurring during temperature change of a substance. 24 Weight change occurs as a result of breakage or formation of physical or chemical bonds at high temperatures. Since the volatiles that will be released during this time will be separated from the system, the decrease in weight is recorded. Thermal analysis (TG-DTA) of the samples was performed using Hitachi SII Exstar 7300 thermal analyzer (Tokyo, Japan). The thermal behavior of nanocomposites was studied in the temperature range between 25°C and 575°C at a heating rate of 10°C min−1 in air atmosphere.
The exothermic peak of nanocomposite around 110°C indicates that the structure began to melt. The degradation of LDPE at around 475°C shows a polymerization reaction (usually occurs around 400°C) with the contribution of zeolite and yttrium. The intensity and amount of this reaction increase with the increasing zeolite ratio and reaches a maximum at the composite with 10% of zeolite. With the loss of structural water in the structure of the zeolite, the structure is subject to degradation over 500°C. The sharp endothermic and exothermic peaks observed in DTA graphs show good crystallization (Figure 5).

TG and DTA graph of the composites.
Figure 5 also represents the TGA curve which belongs to LDPE with zeolite and yttrium. The nanocomposite was degraded in one step, and 95% of total weight loss occurred. With the addition of zeolite, mass loss in LDPE shifts from 440°C to 420°C. The first weight loss happened about 110°C with the loss of water inside the zeolite. The mass loss due to the Si ions in the zeolite structure is reduced from 100% to 90% with the increasing amount of zeolite. It means that the LDPE-Y2O3 + zeolite composite has a lower mass loss because of yttrium and zeolite nanocomposite holds LDPE during the process.
SEM images
The surface morphology of the nanocomposites was examined with SEM (Philips XL-30S-FEG, Amsterdam, The Netherlands). A smooth crystal formation on the surface of the zeolite-doped structure is more clearly seen in the SEM image (Figure 6(a) to (c)). A similar formation is observed after zeolite and yttrium addition because of the structurally crystalline appearance of zeolite. Some structures of polymer composites are replaced by yttrium–zeolite nanostructures. These structures have also emerged as a cloudy structure in SEM. The stabilizer role of yttrium is more apparent in the SEM image of the yttrium composite. This stabilization image is absent in the SEM image of the zeolite–polymer composite. In the zeolite + yttrium-doped composite, the crystalline appearance of the zeolite has largely disappeared, since yttrium helps the zeolite to spread more evenly into the polymer. Zeolite mostly forms smaller aggregates in the polymer as noticed in Figure 6(c). 5
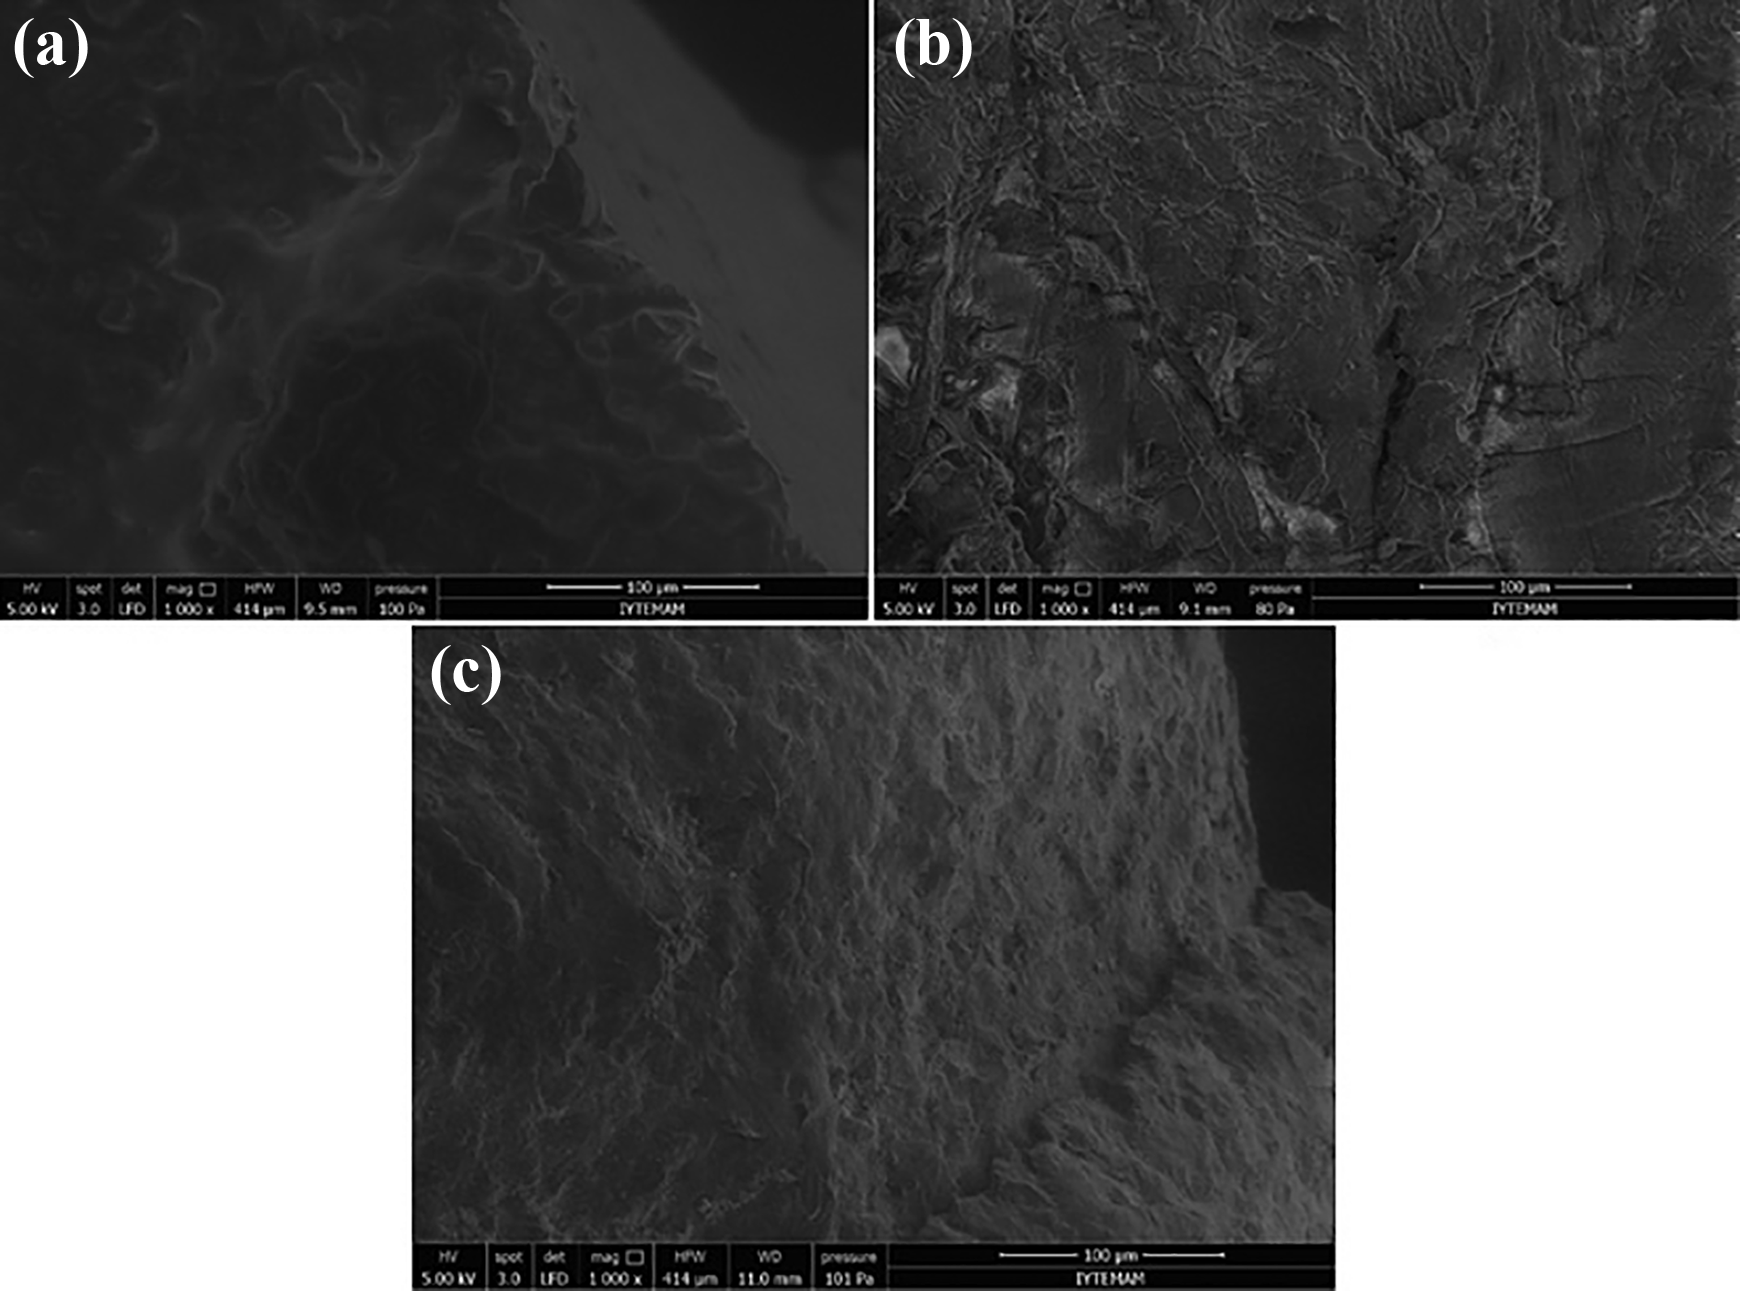
SEM images of (a) the LDPE/Y2O3 (95:5%) composite, (b) the LDPE/nanozeolite (95:5%) composite, and (c) the LDPE/(Y2O3 + nanozeolite) (95:5%) composite.
Discussion and conclusion
Comparison of the decomposition temperature and total mass loss shows that polymer nanocomposites with zeolite and yttrium have lower values. It has been concluded that the particle distribution in the polymer significantly affected the properties of the nanocomposites, and for a uniform and homogeneous distribution, the modifiers should be used to have sufficient affinity between the polymer chain and the surface of the particles. 8,9 Interactions between zeolite and the LDPE show that it is hard to accomplish the dispersion of small particles of zeolites alone through the polymer. In this case, yttrium particles helped zeolite to fill the spaces inside the polymer. It is possible to say that the cross-linking effect of the Y2O3 + nanozeolite acted an important role inside the LDPE chain because of the existence of metal oxides. 25 While yttrium moves to the center of the polymeric chain to connect ethylene monomers, nanozeolite particles take place inside the gaps of the polymer–yttrium structure. 26,27 As indicated in UV absorption, both components of the composite cause changes in the LDPE even if it is hardly noticed. RL results pointed out that yttrium is as effective as zeolite over LDPE together in the composite with increasing RL strength of the LDPE-(zeolite + Y2O3) composite. The help of yttrium can be understood better in DTA graph that yttrium supported zeolite in the polymer composite. However, more detailed analyses are needed to determine how mechanical properties are affected after addition of nanocomposites into the polymer chain. In order to benefit from the properties of the particles used, nanocomposite production requires more testing with modification of the particles, particle ratio, particle size, condition of particles and polymer conditioning, screw feed condition, screw speed, and temperature. Therefore, more detailed studies will be completed about rheological properties of the nanoparticle-containing nanocomposites. This will help to find out whether the composite polymer can be used for packaging or insulating industry.
Footnotes
Acknowledgment
The authors are grateful to Rana Kibar and Ahmet Çetin for their support.
Declaration of conflicting interests
The author(s) declared no potential conflicts of interest with respect to the research, authorship, and/or publication of this article.
Funding
The author(s) received no financial support for the research, authorship, and/or publication of this article.