
Abstract
In this work, ceramics barium titanate (BT) polymer composites were prepared with BT/polyvinyl alcohol (PVA) having a ceramic concentration of 10, 30, and 50% by weight using solution casting method. The prepared thin film samples were characterized by X-ray diffraction for phase analysis. Scanning electron microscope (SEM) studies on composite films revealed ceramic crystallites are well dispersed in the polymer matrix. The dielectric constant (εr ) and the AC conductivity at room temperature and at different frequencies (100 Hz–5 MHz) of the piezoelectric composites with different concentrations were investigated. The result shows that the dielectric constant of ceramic-PVA composites was found to increase as ceramic concentration increases and the dielectric loss tangent decreased with increasing concentration. AC conductivity of the composites increased with increasing frequency.
Introduction
Barium titanate (BT) belongs to a group of materials that crystallize with the perovskite structure that have the general composition of ABO3. 1 BT ceramics is used widely due to its high dielectric constant and low loss, and it is also piezoelectrically active. However, poor flexibility and complex manufacturing processes limit the development of inorganic ceramic dielectric material to some extent. 2 Combining the polymer material having excellent film-forming properties with ceramic material having high dielectric constant to prepare a composite is a new approach for dielectric materials. 3 In this article, BT was used as an inorganic filler and polyvinyl alcohol (PVA) as an organic matrix to prepare composite thin films.
The selection of appropriate polymer matrix and ceramics can lead to the development of graded dielectrics, where the dielectric properties like dielectric constant and loss tangent can be varied over a range by changing composite concentrations. 4 These composites have good mechanical properties with easy processing and can be formed into any shape through simple molding process, which can be used for various electrical and electronic applications. 5 BT/PVA composite can serve as a good dielectric in capacitor applications and as an active component in ultrasonic transducers.
Materials and methods
Commercially available PVA was used as a polymer. BT purchased from Sigma-Aldrich (USA) with 99.99% was used as filler material. BT powder, as received, was mixed with PVA in different weights of 10, 30, and 50%. PVA is mixed in 50 ml of hot distilled water. This mixture was continuously stirred at a temperature of 60°C for 3 h using a magnetic stirrer to form a gel-type solution. BT of different weight percentage was added to the above cooled PVA suspension and stirred for 1 h. This solution is casted on to a glass substrate and allowed to dry at room temperature. A film sample of 0.5–0.8 mm thickness was formed. Composite films of BT/PVA of different weight percentage (i.e. 100:0, 90:10, 70:30, and 50:50) were prepared. 6 The prepared BT/PVA composites were characterized by X-ray diffraction (XRD), scanning electron microscope (SEM), and electrical study. The microstructures of films were examined by SEM using EVO MA 18 SEM equipped with OXFORD EDS analyzer (Oxford instruments, Inc.). XRD analysis was performed from 5° to 80° 2θ values at a step of 4° using Rigaku miniflex 600 diffractometer with a graphite monochromator (Rigaku Corporation). For dielectric constant, tan δ, and AC conductivity studies, silver electrode was deposited on to the film. The measurements were carried at room temperature using a PSM1735 LCR meter in the frequency range of 100 Hz to 5 MHz (N4L Newtons4th Ltd).
Results and discussion
Powder XRD analysis
The XRD pattern of the BT/PVA composites with different ceramic concentrations of 10, 30, and 50% was analyzed to explain the influence of the incorporation of the ceramic in polymer matrix, as shown in Figure 1. X-ray reflections of BT/PVA show a single phase with a pseudocubic perovskite structure. In all systems investigated, Bragg reflection peaks were characterized mainly by a higher intense peak (110) at 2θ = 31° and no peak splitting was observed. The peaks at 2θ = 21.9, 31.3, 38.6, 45, 50.6, and 56 are attributed to the crystal phase in BT. No peak shift was observed in any case of BT/PVA composites. The crystallite size of pure BT is 30–50 nm. 5

XRD of BT/PVA different weight percentage.
The cell parameters are listed in Table 1.
Lattice parameters of BT.

BT: barium titanate.
SEM analysis
SEM images give morphological information of BT/PVA, as shown in Figure 2.
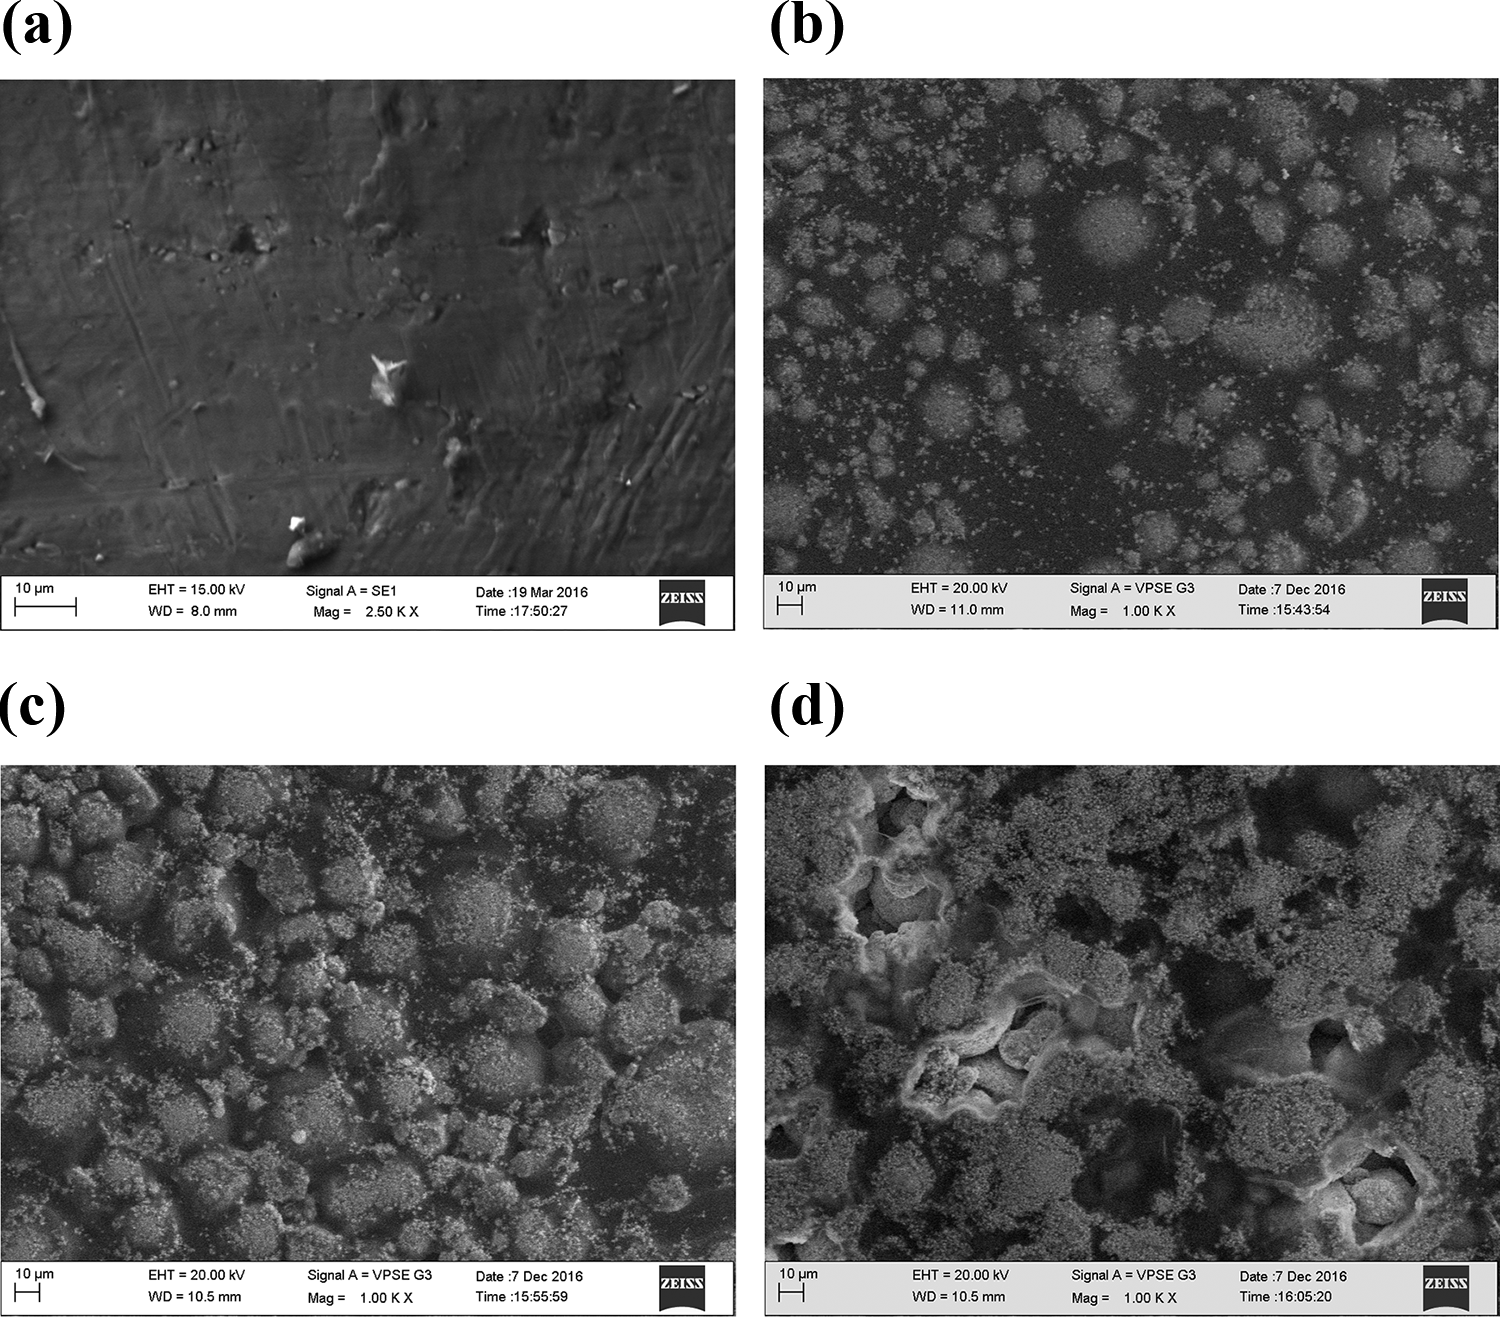
SEM images of BT in polymer PVA matrix: (a) pure PVA, (b) 90:10, (c) 70:30 and (d) 50:50.
SEM image of the surface of the composite film with BT concentration of 10, 30, and 50 weight percentage suggests that the BT particles were dispersed homogeneously in the PVA polymer matrix. An increase in the agglomerate size was observed as the amount of ceramic powder was increased. Particle agglomeration results from a nonhomogeneous dispersion of particles or smaller particle size. 7,8 At higher concentration, increased crystallite size and agglomeration were observed with two phases randomly interconnected. 9
Dielectric studies and AC conductivity
The variations of dielectric constant and tan δ with the frequency for BT/PVA composites are shown in Figure 3. The dielectric constants of BT/PVA composites at frequencies below 1 kHz were observed to be high. As the concentration of BT in the polymer matrix decreases, the effects of space charge on the dielectric properties become dominant. Therefore, the dielectric constant at frequency <1 kHz resulting from a space charge in BT/PVA composites can be larger. 10
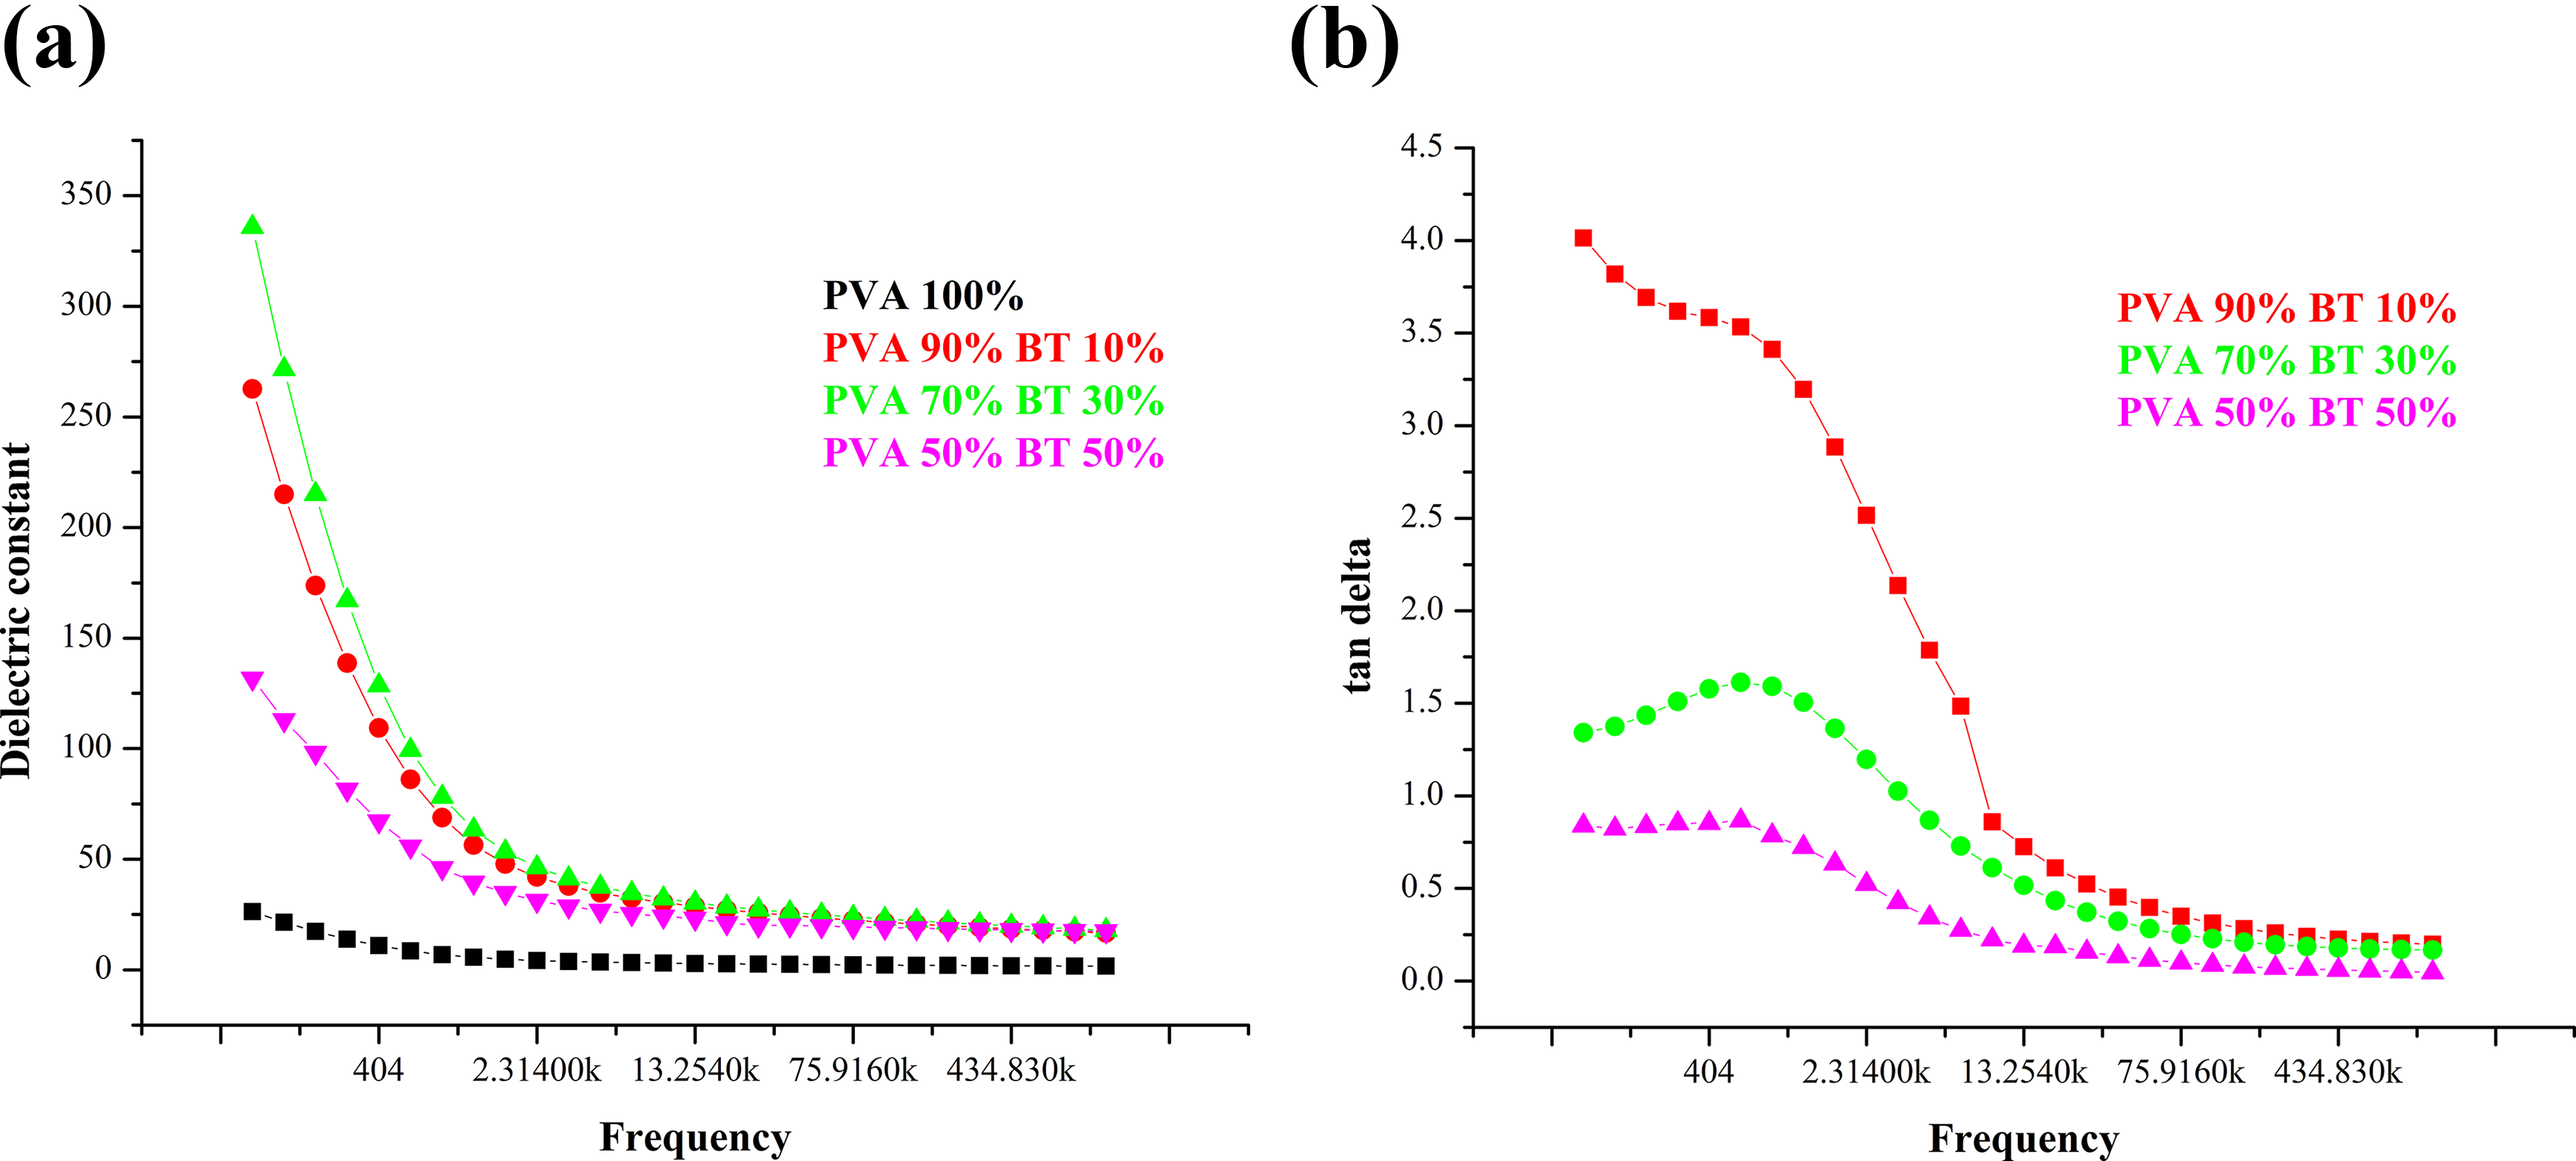
Dielectric constant and tan delta v/s frequency of BT/PVA in different weight concentrations.
Since the powder used to make all films was the same, the particle size was the same and only the size of clusters is different. The dielectric constant appears to have a strong concentration dependence. 11 As the concentration of BT increases (i.e. 10, 30, and 50% weight), the dielectric constant of the composites at 1 kHz is measured as 47.8, 63.4, and 39.5, respectively. 12,13 The increase in dielectric constant and dielectric loss with filler content at lower frequency may be due to interfacial effect, which appears in a composite system exhibiting electrical heterogeneity due to the accumulation of charges at the interface of the system. 14
The decrease in the value of dielectric constant at 50% concentration of BT may be due to the agglomeration of particles. Random interconnectivity of composite phases attributes to lower value of dielectric constant at higher frequency. 15
Figure 4 shows the variation of log AC conductivity with log frequency for different filler concentrations in BT/PVA. AC conductivity was evaluated using real and imaginary permittivities ε′ and ε″.
16

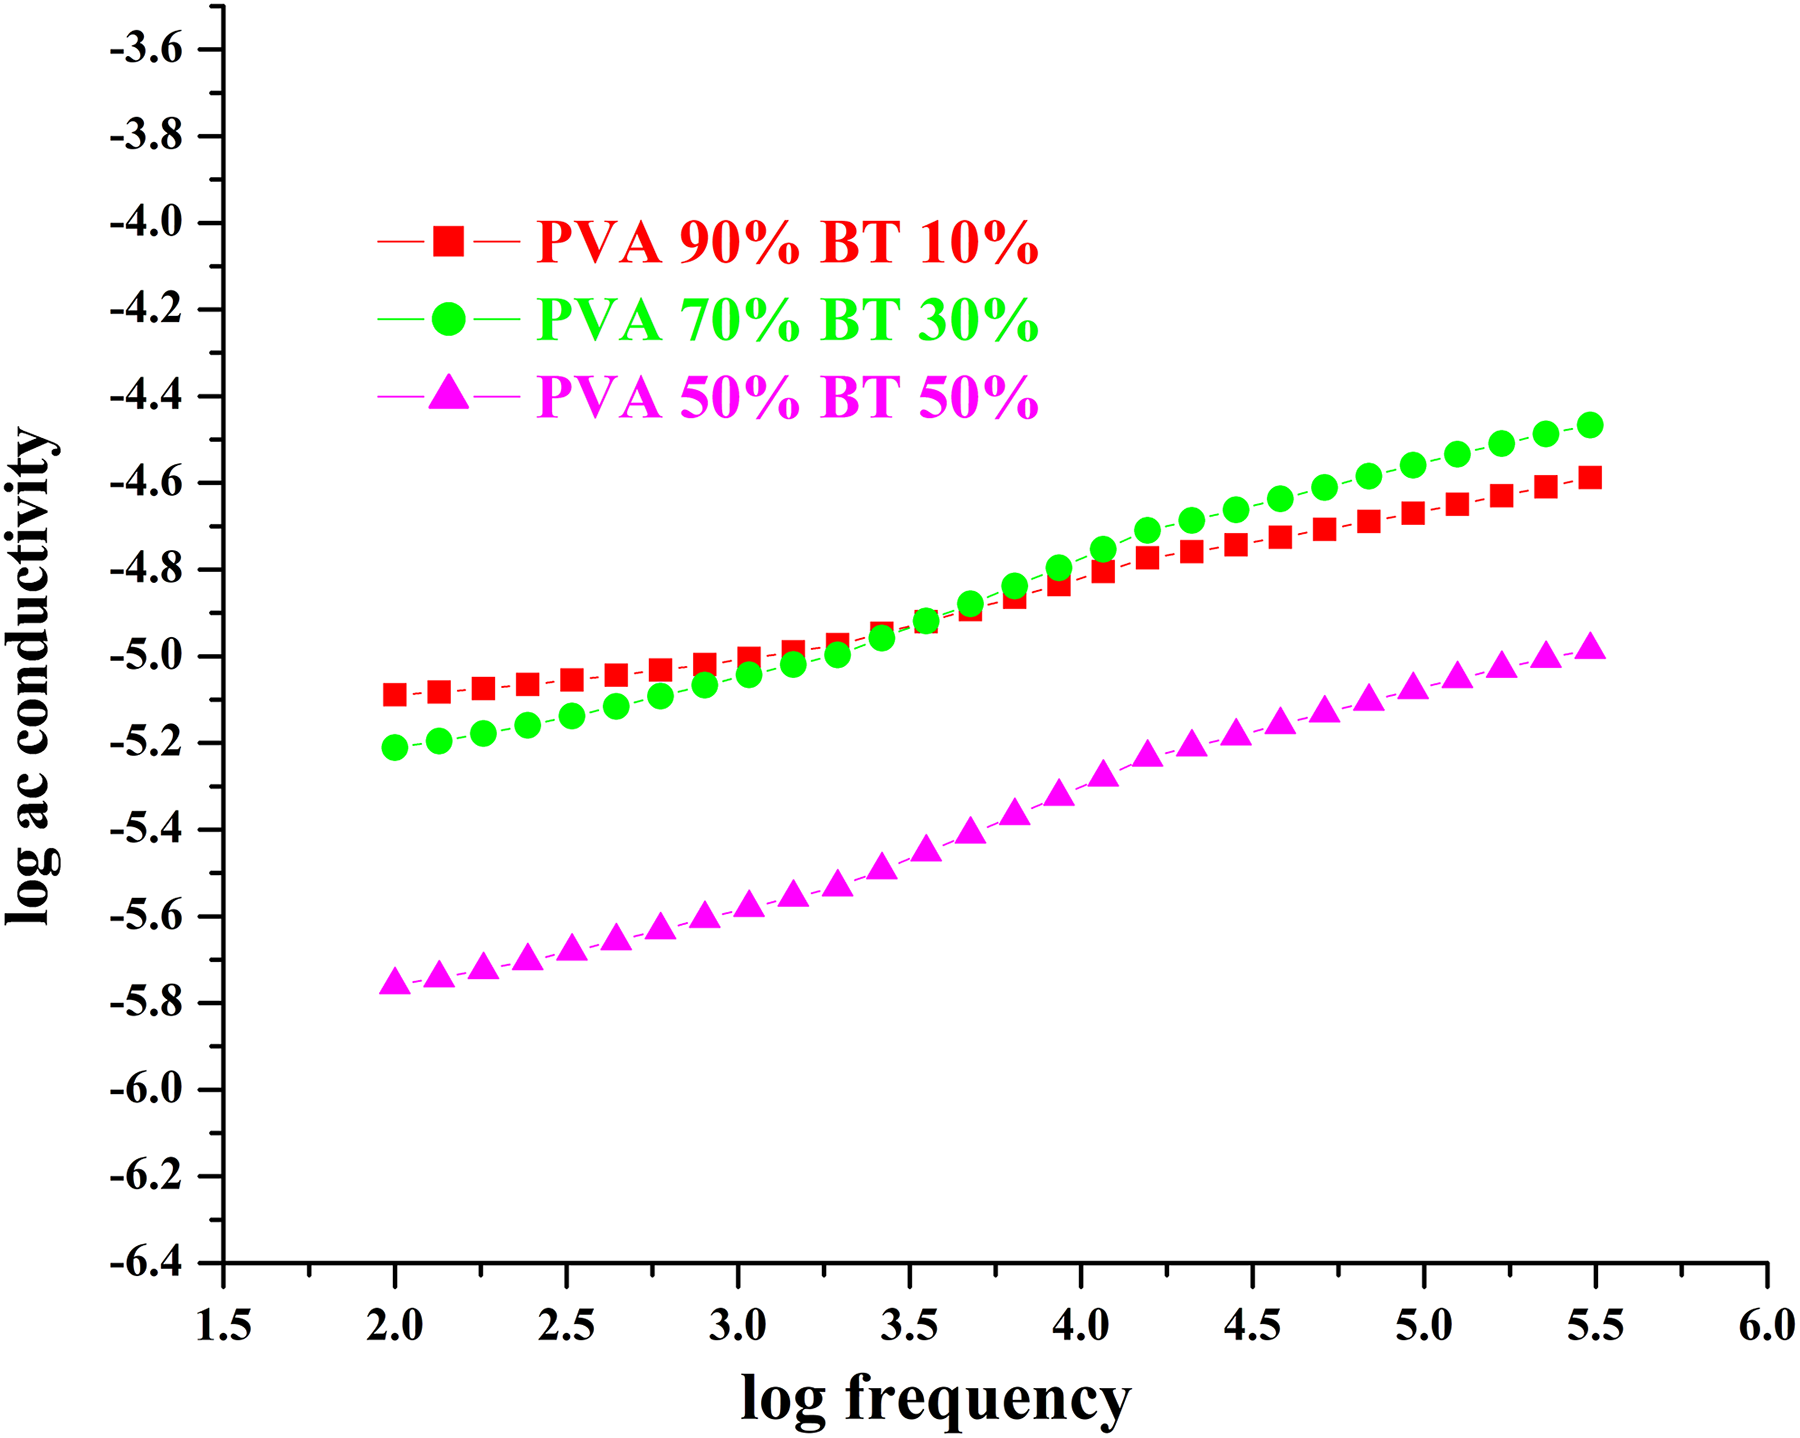
Log ac conductivity v/s log frequency of BT/PVA and in different weight proportions.
Conductivity increases with increase in the frequency for all filler concentrations in BT/PVA. From the graph, it is found that AC conductivity remains almost independent of frequency in the low-frequency region and reveals dispersion at high frequencies. 17 The observed increase in the room temperature conductivity may be attributed to the incorporation of ceramic fillers. As the filler concentration increases, the interfacial polarization increases and the observed conductivity increase may be due to ion hopping in the polymer chain. 14,18
Complex impedance and electric modulus analysis
Complex impedance spectroscopy was used to analyze the electrical properties of composites with conducting electrodes in a frequency range of 100 Hz to 1 MHz at room temperature. 19 Complex impedance and electric modulus analyses were done using these formulae:
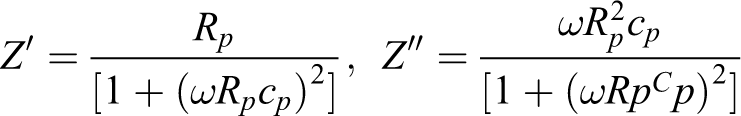

Figure 5(a) shows the variation of Z′ with the frequency of BT/ PVA and it is observed that Z′ decreases with the increase in frequency. At higher frequency, the space charge has less time to relax and the recombination would be faster. 20 Higher Z′ value at lower frequency and lower Z′ value at higher frequency indicate an increase in conduction with frequency. Figure 5(b) illustrates the frequency response of Z″ at room temperature. This plot is suitable for the evaluation of the relaxation mechanism of many resistive components.
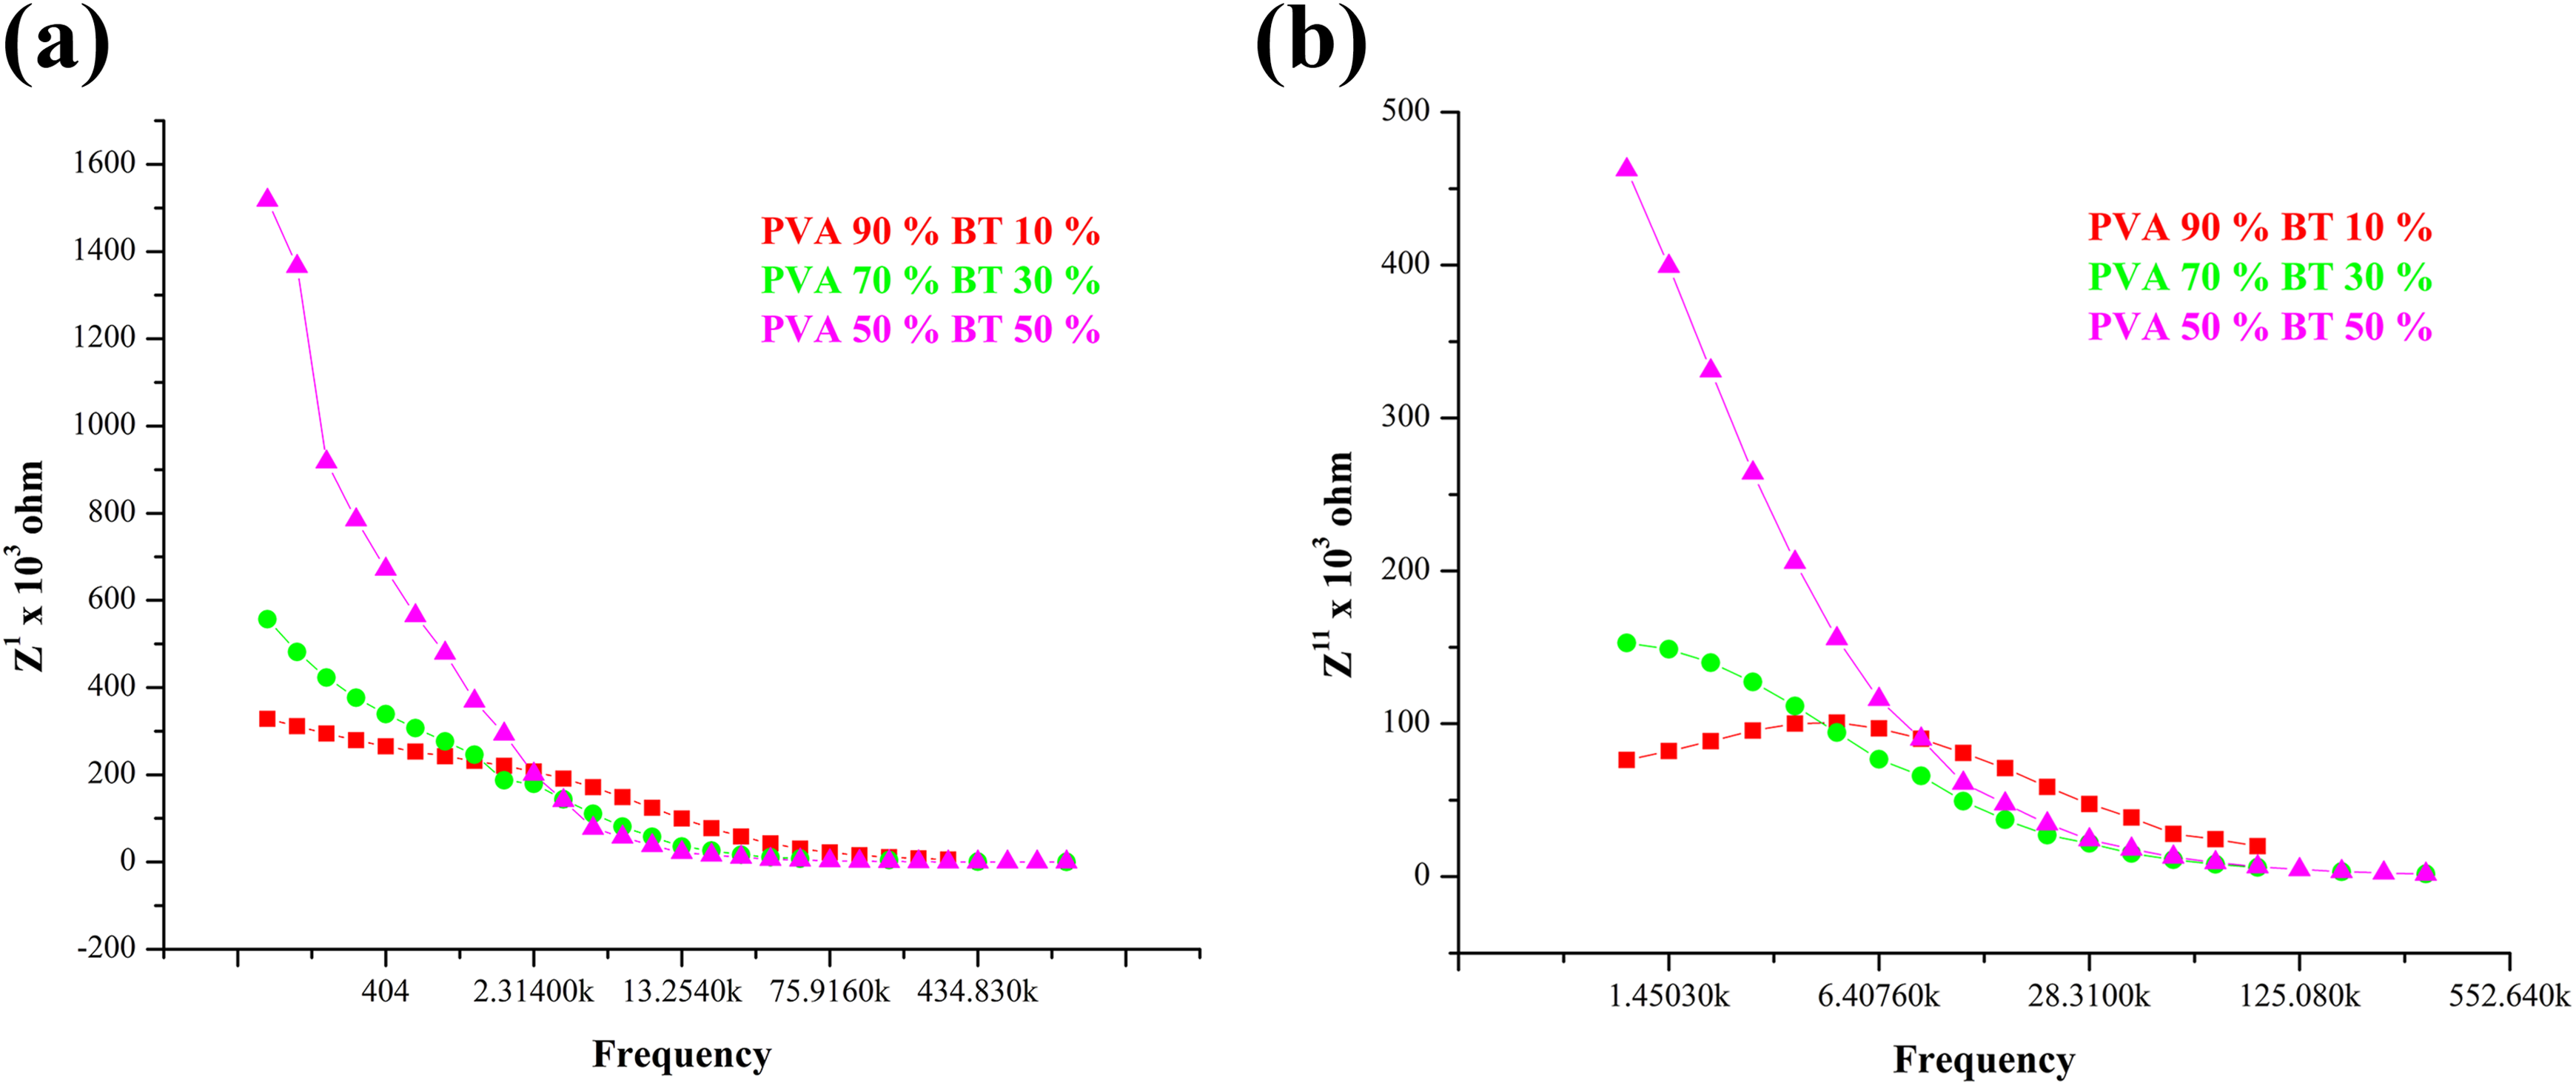
(a) Real part of impedance v/s frequency. (b) Imaginary part of impedance v/s frequency of BT/PVA in different weight proportions.
Complex electric modulus analysis has been adopted to study the frequency dependence of the conductivity of ceramics. 21 Impedance analysis provides a simple method to determine various contributions to the total conductivity of materials in terms of four possible interrelated complex formulations: impedance (Z*), admittance (Y*), permittivity (ε*), and modulus (M*). Figure 6(a) shows the frequency dependence of M′ for various weight concentrations. It is observed that the value of M′ is very low in the low-frequency region. A continuous increase in the M′ with the increase of frequency shows the tendency of the material to saturate at a maximum value for every concentration. The tendency of saturation suggests that the conduction is due to the short range displacements of charge carriers. 22 The low value of M′ in the low-frequency region suggests that conduction phenomenon due to long-range mobility of charge carriers is negligible. Irrespective of the amount of filler in the composite, the value of M′ is nearly zero at low frequencies, indicating a lower contribution of electrode polarization. 23

(a) M1 v/s frequency. (b) M11 v/s frequency of BT/PVA in different weight proportions.
The frequency dependence of M″ for various concentrations is shown in Figure 6(b). It is noticed that M″ increases with the increase in frequency except the appearance of a small and broad curvy region, which is observed above frequency 1 kHz. As the ceramic concentration is increased, the curve is shifted toward the lower frequencies, indicating faster relaxation behavior. The low-frequency side of the peak represents long-range hopping of ions, whereas high-frequency side shows the localized movement of charge carriers. It is observed that one peak appears for all filler concentrations indicating the presence of at least one dielectric relaxation phenomenon. 19 The region where the peak occurs shows the transition from long range to short range mobility of charge carriers with increase in frequency. The appearance of peaks in M″ provides a clear indication of the real dielectric relaxation process, which is the result of physical movement of dipoles and the time required for their displacement. 24,25
Conclusions
XRD of BT/PVA shows a single phase and no splitting of peak is observed. Crystallite size was calculated to be less than 50 nm. The microstructure of the samples of different weight percentage shows a better dispersion of ceramic particles in the polymer matrix. At 50% concentration of BT, random connectivity of ceramic in the polymer phase is observed. At room temperature, dielectric constant and loss tangent of the composites decrease with increasing frequency and increase with increasing concentration up to 30% of ceramic in BT/PVA film. AC conductivity measurements show a conductivity increase with frequency, which is due to interfacial polarization in BT/PVA. Higher impedance Z′ at lower frequency and lower Z′ at higher frequency show an increase in conduction with frequency in the composite at all concentrations. Increase of complex modulus with frequency indicates that relaxation process is the result of the physical movement of dipoles and time required for their displacement in BT.
Footnotes
Acknowledgment
The authors are thankful to Innovation center, Manipal Institute of Technology, Manipal, for providing the facility for XRD and SEM characterization of the prepared samples.
Declaration of conflicting interests
The author(s) declared no potential conflicts of interest with respect to the research, authorship, and/or publication of this article.
Funding
The author(s) received no financial support for the research, authorship, and/or publication of this article.