
Abstract
Tensile, flexural, wear, and friction behaviors of polyamide 6.6 (PA 66) reinforced by different weight fractions of short glass- iber were investigated. Three-point bending flexural tests in addition to monotonic tensile tests were carried out to determine the mechanical behavior. Reciprocating friction tests were carried out without lubrication under ambient conditions. A ball-on-flat contact configuration was adopted for all tests. Reciprocating wear tests were carried out against a silicon carbide abrasive paper. Results show that the reinforcement influenced mechanical and tribological behaviors and that the orientation of glass fiber has an effect on the friction behavior. Increasing the weight fraction of glass fiber increases the ultimate strength, the flexural strength, and the elastic modulus but decreases the elongation at break. Increasing the weight fraction of glass fiber decreases the coefficient of friction and increases the wear rate. For high weight fractions, when sliding parallel to the glass fiber direction, the coefficient of friction is smaller than which is measured in the perpendicular direction. Abrasive wear mechanism of wear was illustrated via scanning electron micrographs.
Keywords
Introduction
Polymers are reinforced to improve the strength and stiffness of the matrix. Glass fibers are of the most widely used reinforcing agents in polyamide 6.6 (PA 66) matrix. These fibers are usually sized to permit good bonding with the matrix, producing a material of high mechanical performance. A number of researchers investigated the influence of reinforcement on the mechanical behavior of this thermoplastic material. They showed usually an improvement in the strength and mechanical properties. 1 -3 Other works studied the influence of reinforcement on the tribological behavior of PA 66 under dry 4 or humid conditions. 5 Srinath and Gnanamoorthy reported that reinforcing nylon 66 with about 20% glass fibers reduces the coefficient of friction by about 28% and the specific wear rate by about 74%when sliding against stainless steel (AISI 314). 4 Kim et al. reported that reinforcing PA 66 with 30% glass fibers improved the wear resistance and decreased the friction coefficient when sliding against carbon steel (S45C). 5 Byett and Allen conducted reciprocating dry sliding wear tests against stainless steel (AISI 431) and showed that reinforcing by glass fiber (40%) decreased the specific wear rate by about 99% under low load (2 kg) and about 76% under high load (10 kg) but increased the coefficient of friction. 3 Various methods such as pin-on-plate, 3 pin-on-disc, 4 block-on-ring, 5 and twin disc test rigs, 6,7 which simulate conformal and nonconformal contact configurations and identical or dissimilar antagonists, were employed. Kukureka et al. reported that the wear behavior of the reinforced materials in identical nonconformal contacts differs completely from that found by previous authors, where the composites were loaded against metallic counterfaces. 6 Some researchers studied the effect of other reinforcement on the tribological behavior of PA 66. Demirci and Duzcukoglu showed that adding polytetrafluoroethylene (PTFE) to PA 66 has a negative effect on the wear and friction behaviors, but when adding glass fiber and PTFE to PA 66, the coefficient of friction and the wear rate decreased. 8 Chen et al. confirmed that adding PTFE and glass fiber to the PA 66 matrix exhibited less friction when running against steel, brass, and aluminum counterfaces under rolling–sliding contact. 7 However, this addition of PTFE to the glass fiber-reinforced PA 66 exhibited lower wear only when sliding against steel but higher wear with aluminum or brass counterfaces. Chang et al. found that conventional fillers, such as short carbon fiber, graphite flakes, and nano-titanium dioxide, could effectively reduce the coefficient of friction and wear rate of PA 66. 9 Tewari et al. showed that reinforcement by carbon fiber deteriorated the abrasive wear resistance, decreased the elongation at break, and increased the ultimate tensile strength. 10 Yu et al. showed that adding rubber particles decreased the wear mass loss and the coefficient of friction of PA 66 when sliding against a steel wheel. 11 Recent studies investigated the influence of experimental parameters on friction and wear mechanisms of PA 66/PTFE blend and PA 66/GnP (graphene nanoplatelets) nanocomposite. 12 -16 Other researchers were interested in the effect of different reinforcements (glass fiber, aramid fiber, carbon fiber, graphite and wax, titanium carbide particles, aluminum borate whiskers, and polypropylene) on the tribological properties of another matrix, such as PA6, PA12, poly(ether ether ketone), polyimide, and polyethyleneimine. 17 -23 Addition of reinforcements will affect mechanical but especially tribological properties of PA 66 and the effect needs to be clearly understood for better utilization and widening application of this PA-based polymer composites. An extensive study of tensile, flexural, friction, and wear behaviors of different glass fiber-reinforced PA 66 is conducted. The friction tests are investigated when sliding against a hard material as 100Cr6 bearing steel and the wear tests are investigated, separately to friction tests, by rubbing against a silicon carbide (SiC) abrasive paper counterface.
Materials and methods
Materials
The material investigated in this study is a short glass fiber-reinforced PA 66 with different weight fractions. To produce composites with 10 and 20 wt% glass fiber content, a combination of two commercial products was performed: PA 66 (HERAMID® A NAT) and PA 66 containing 30 wt% glass fibers (HERAMID A NAT FV030) provided by RADICI GROUP. These new reinforced materials are, respectively, designated PA66GF10 and PA66GF20. The commercial reinforced PA is designated PA66GF30. The unreinforced material is designated PA66GF00. A short glass fiber type E (9–11 μm in diameter and 0.3–0.4 mm in length) was employed to reduce microcracks and to have a very good mechanical performance. Samples for tensile, flexural, and tribological tests were obtained by molding injection at 50% relative humidity. Specimens for tensile tests are type 1A, according to ISO 527-2 standard. Plates have dimensions of 125 × 105 × 4 mm3 (Figure 1).
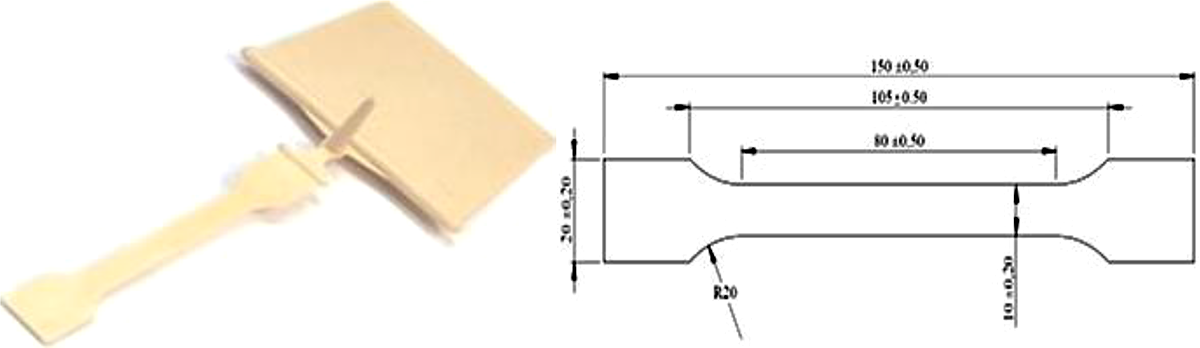
Molded plate and tensile test specimen dimensions.
Tensile tests
Tensile tests were performed at a constant crosshead speed of 1 mm min−1 at room temperature as specified in ISO 527 -1 standard using a 3-kN Instron Electroplus E 3000 machine (Institut supérieur de mécanique de Paris (Supméca), Saint-Ouen, France). A laser extensometer type RUDLPH, placed at 370 mm from the specimen, was employed to measure the deformation. Specimens for tensile tests are type 1A, according to DIN EN ISO 527-2 standard. Three sample replicates were tested for tensile tests.
Flexural tests
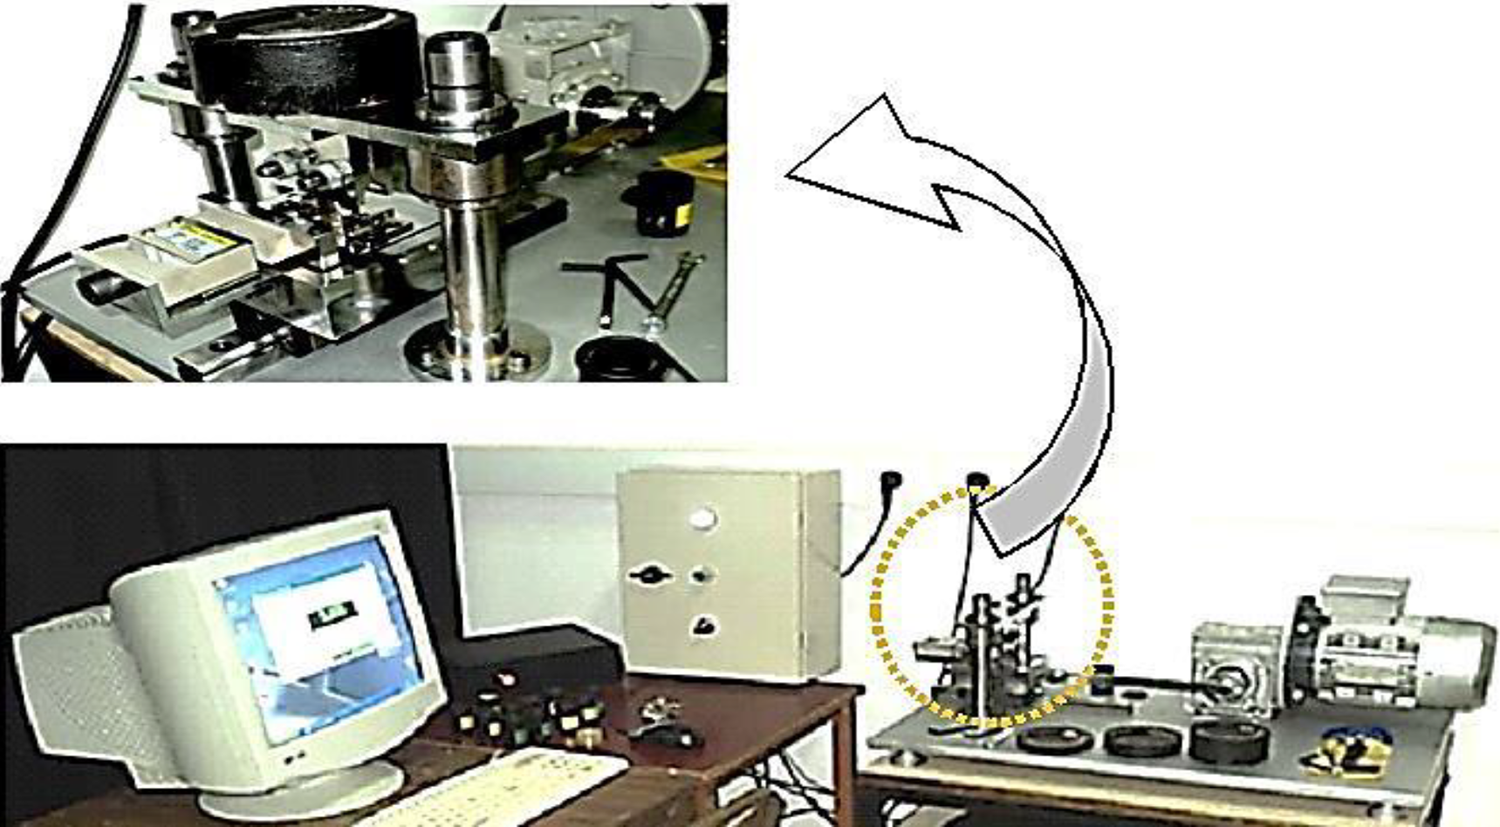
Flexural properties were determined by a three-point bending test according to the ASTM D-790 standard. 24 Support span was 70 mm (Figure 2). The applied crosshead speed was 5 mm min−1. The load was placed midway between the supports. Each sample was loaded until the core broke and their average is reported.

Machine and setup of the flexural test.
For each material, three samples were tested. The samples were machined to a size of 105 × 10 × 4 mm3 from the rectangular plate. The flexural strength (σ F), modulus (E F), and strain to failure (ε F) are given as follows:


where L, b, and h are the span (length), width, and depth (or thickness) of the sample, m is the slope of the tangent to the initial straight-line portion of the load–deflection curve, D is the maximum deflection before failure, and P max is the maximum load encountered before failure.
Friction and wear tests
Tribological tests were performed on a reciprocating tribometer (Figure 3). ASTM G133-05 and ASTM G132-96 standards are followed to conduct, respectively, friction and wear tests. The test method and the apparatus architecture are described amply in previous works. 25 -28 Friction tests were carried out using prismatic samples (15 × 15 × 4 mm3) sliding against a ball-bearing steel 100Cr6 (diameter 20 mm), illustrating a ball-on-flat contact configuration (Figure 4).
Architecture of the reciprocating tribometer.
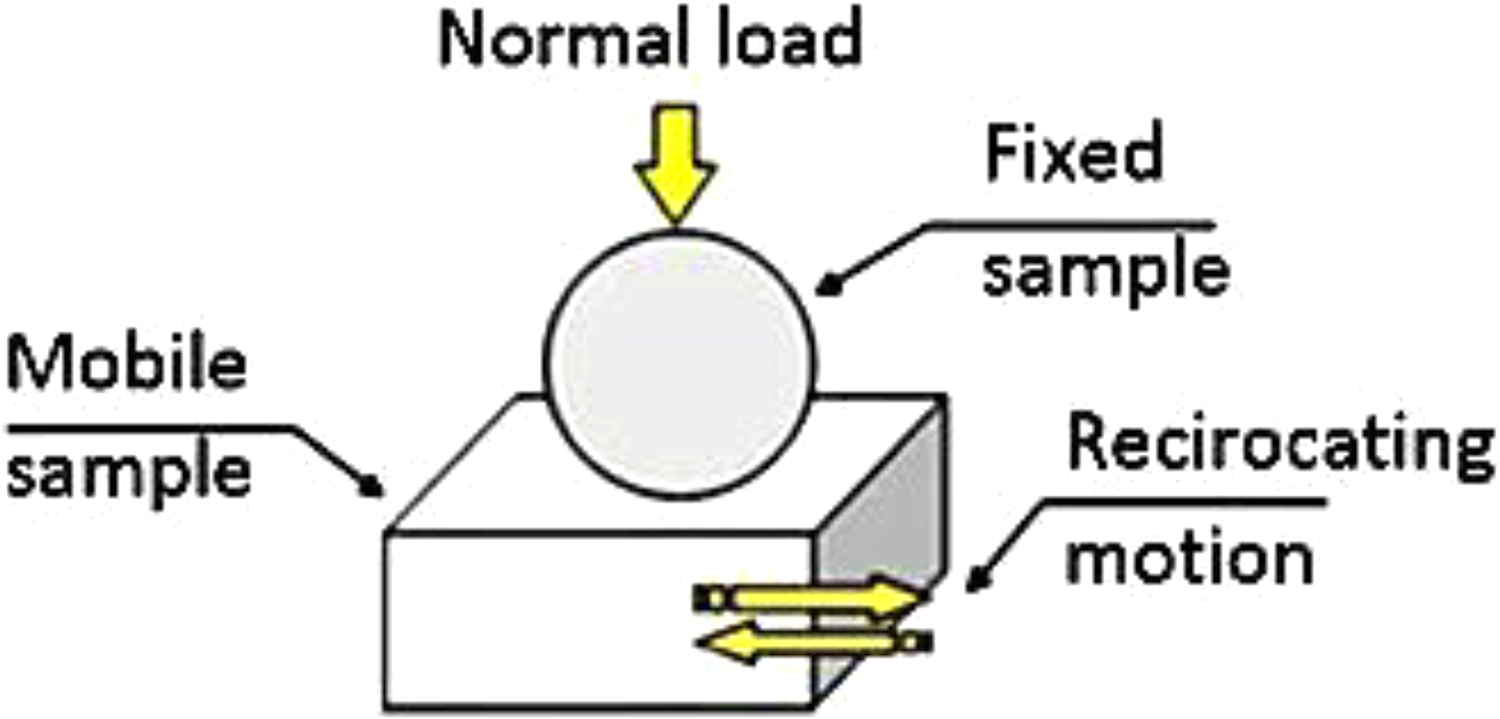
Contact configuration for the reciprocating friction test.
The coefficient of friction µ was calculated as the ratio of the friction force and the normal load. The conditions of the friction tests are summarized in Table 1.
Conditions of the friction and wear tests.

Wear experiments were carried out using prismatic samples similar to which employed for friction tests. The wear test is flat-on-flat (polymer composite against a flat SiC abrasive paper). Three sample replicates were tested for wear tests. Samples for friction and wear tests were cut from the rectangular plate. The conditions of the wear tests are summarized in Table 1. The wear rate was calculated as the difference of the weight of the sample before and after the wear test divided by the initial weight (in percentage).
Results and discussion
Tensile behavior
Figure 5 shows the stress–strain curves of the unreinforced and reinforced PA 66 with three different ratios of short glass fiber. Results showed that increasing the weight fraction of the glass fiber improves the elastic modulus and the ultimate strength but it reduced the elongation at break.

Stress–strain curves versus glass fiber weight fractions.
Increasing the glass fiber fraction changes the material behavior from ductile to fragile. These results are in accordance with those obtained by Mouhmid et al. (for glass fiber contents of 15, 30, and 50 wt%). 1 Table 2 summarizes the different values of the elastic modulus E, the ultimate strength R m, and the elongation at break A% for the different reinforcement ratios. The standard deviations (STDEV) of tensile results are indicated for E, R m, and A% in italics.
Tensile properties of studied materials.a

STDEV: standard deviation; E: elastic modulus; R m: ultimate strength; A: elongation at break.
aSTDEV of tensile results are indicated for E, R m, and A% in italics.
Flexural behavior
Figure 6 shows flexural stress–strain curves of the unreinforced and short glass fiber-reinforced PA 66 samples (10, 20, and 30% glass fiber weight fractions). Results showed that increasing the glass fiber weight fraction improved the flexural modulus and flexural strength. This improvement in the strength properties is in good agreement with the literature data, 2 and it is explained by the contribution of the glass fiber as a brittle and tough material. Table 3 recaps quantitatively the effect of glass fiber content on the maximum obtained flexural stress. The STDEVs are calculated for three replicates. Reinforcement caused an increase in the maximum flexural stress to about 17.7% for PA66GF00, 36.3% for PA66GF10, and 47.2% for PA66GF30 in comparison with unfilled PA 66. Figure 7 illustrates unfilled and glass fiber-reinforced samples after the flexural test. As shown in the figure, all samples were deformed without fracture.

Flexural stress–strain curves versus glass fiber weight fractions.
Effect of reinforcement on the maximum obtained flexural stress.
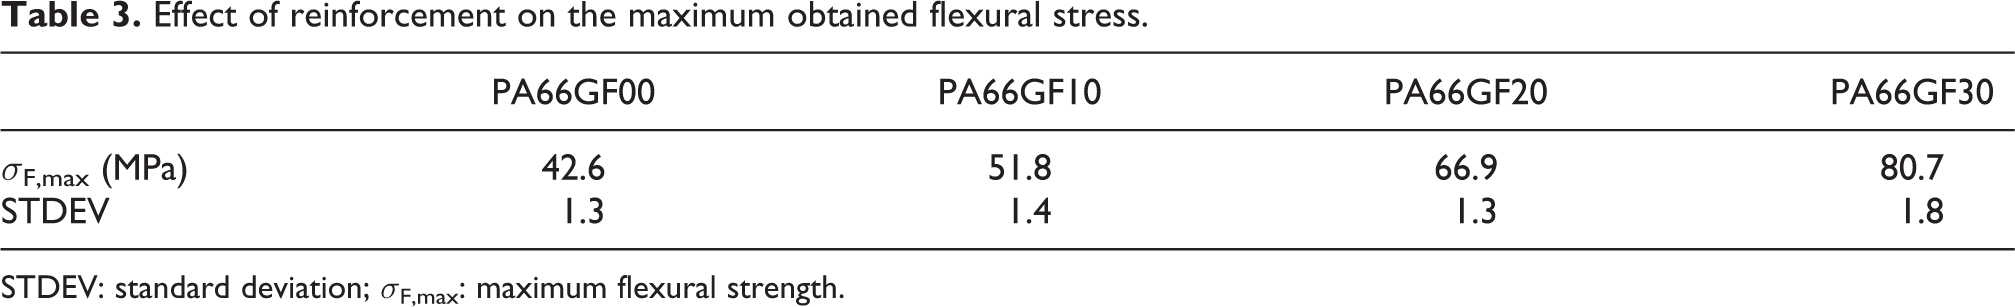
STDEV: standard deviation; σ F,max: maximum flexural strength.
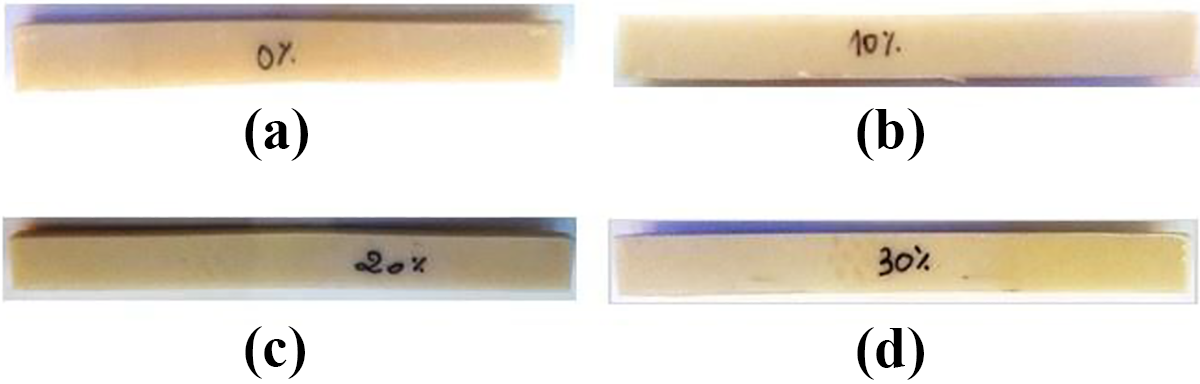
Modes of failure after flexural tests for the different glass fiber contents: (a) PA66GF00, (b) PA66GF10, (c) PA66GF20, and (d) PA66GF30.
Friction behavior
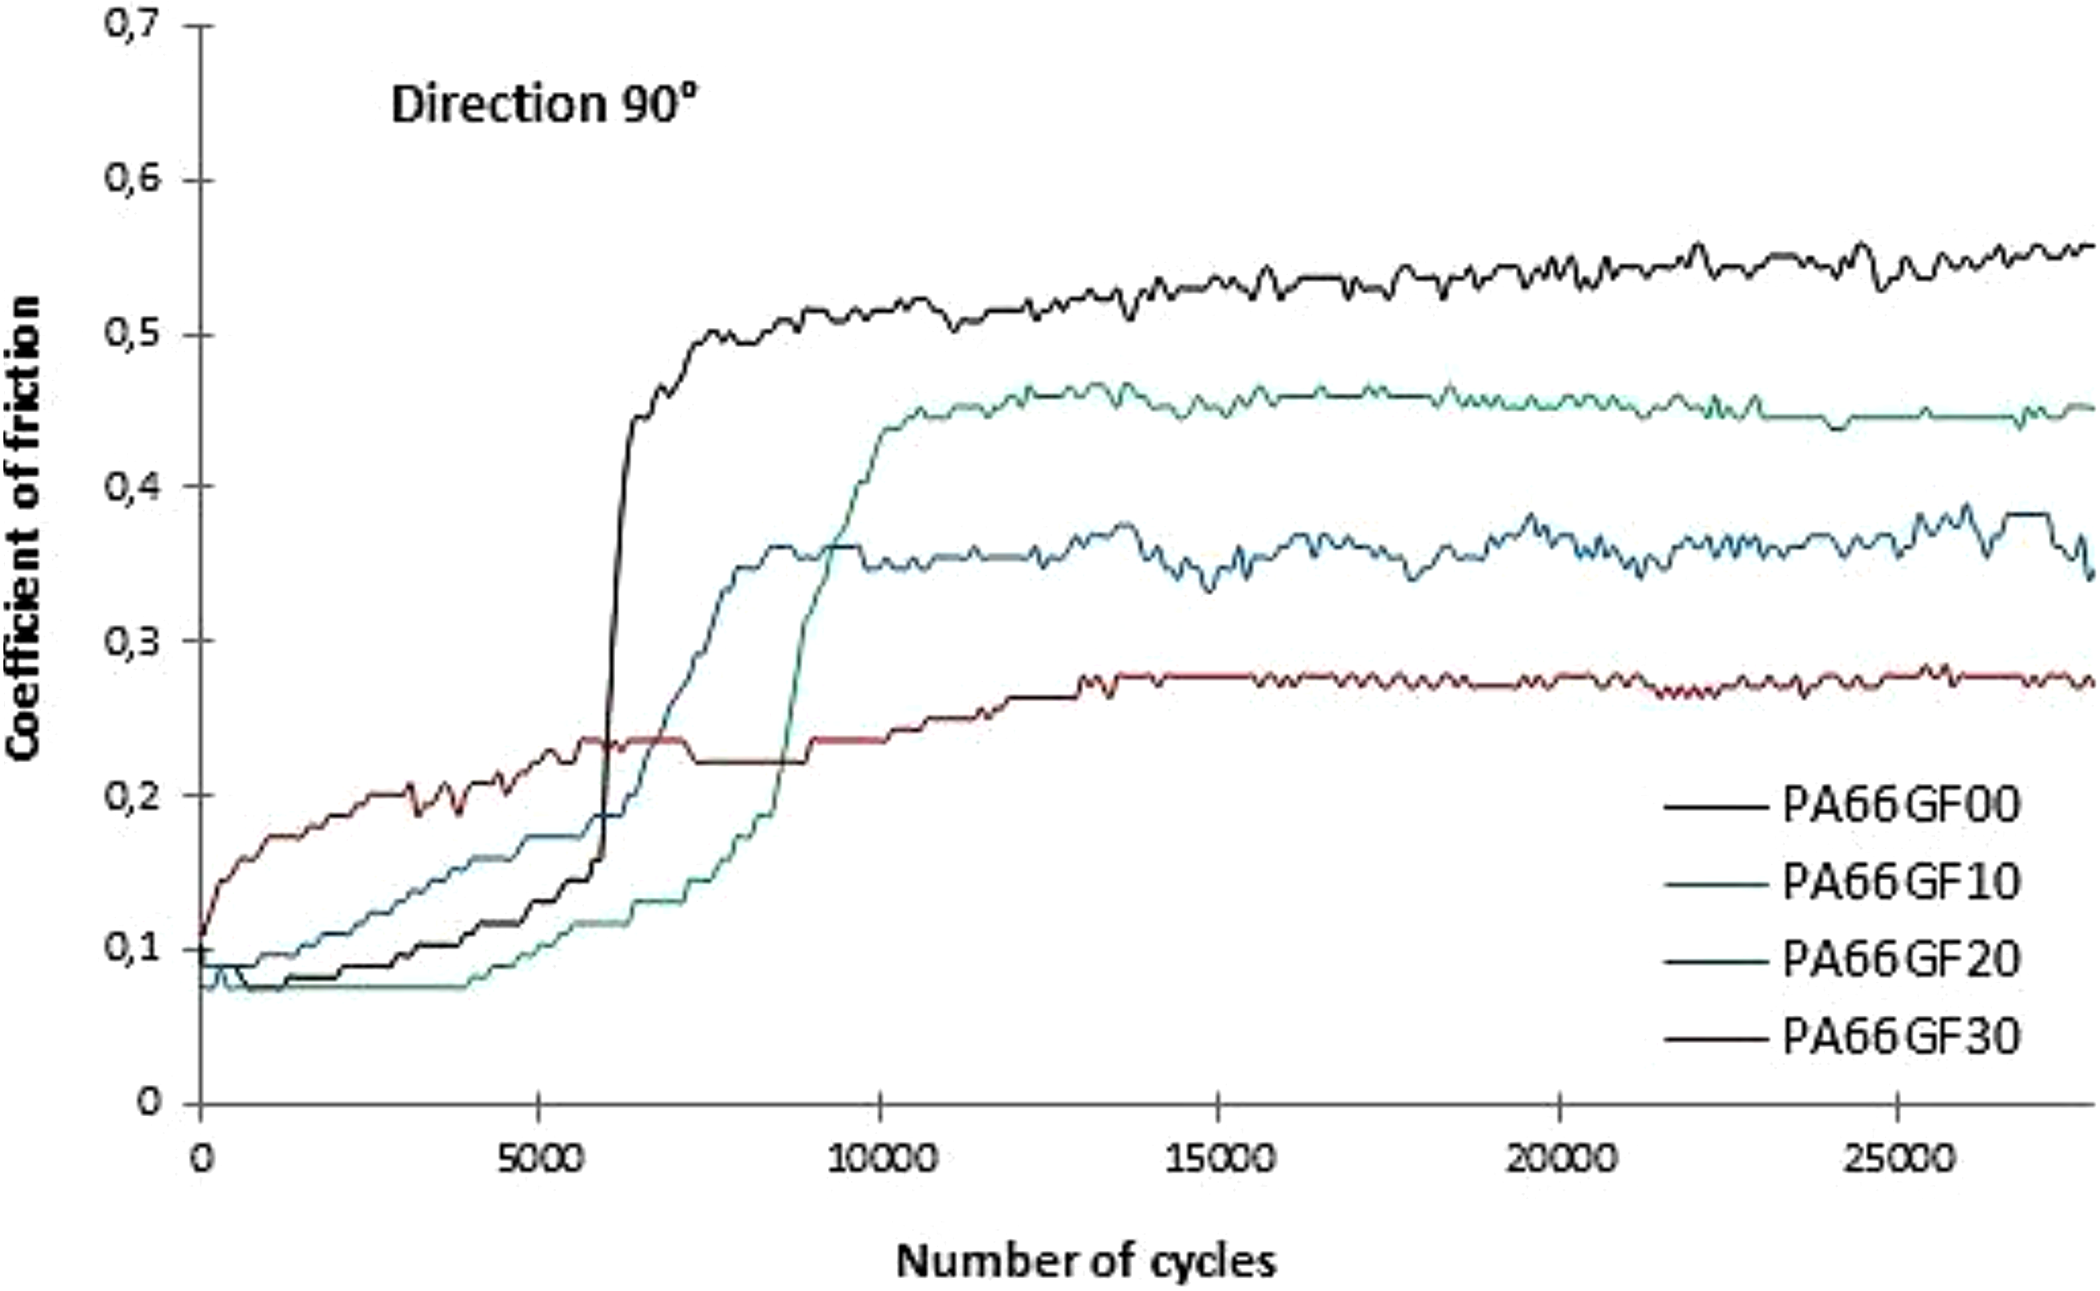
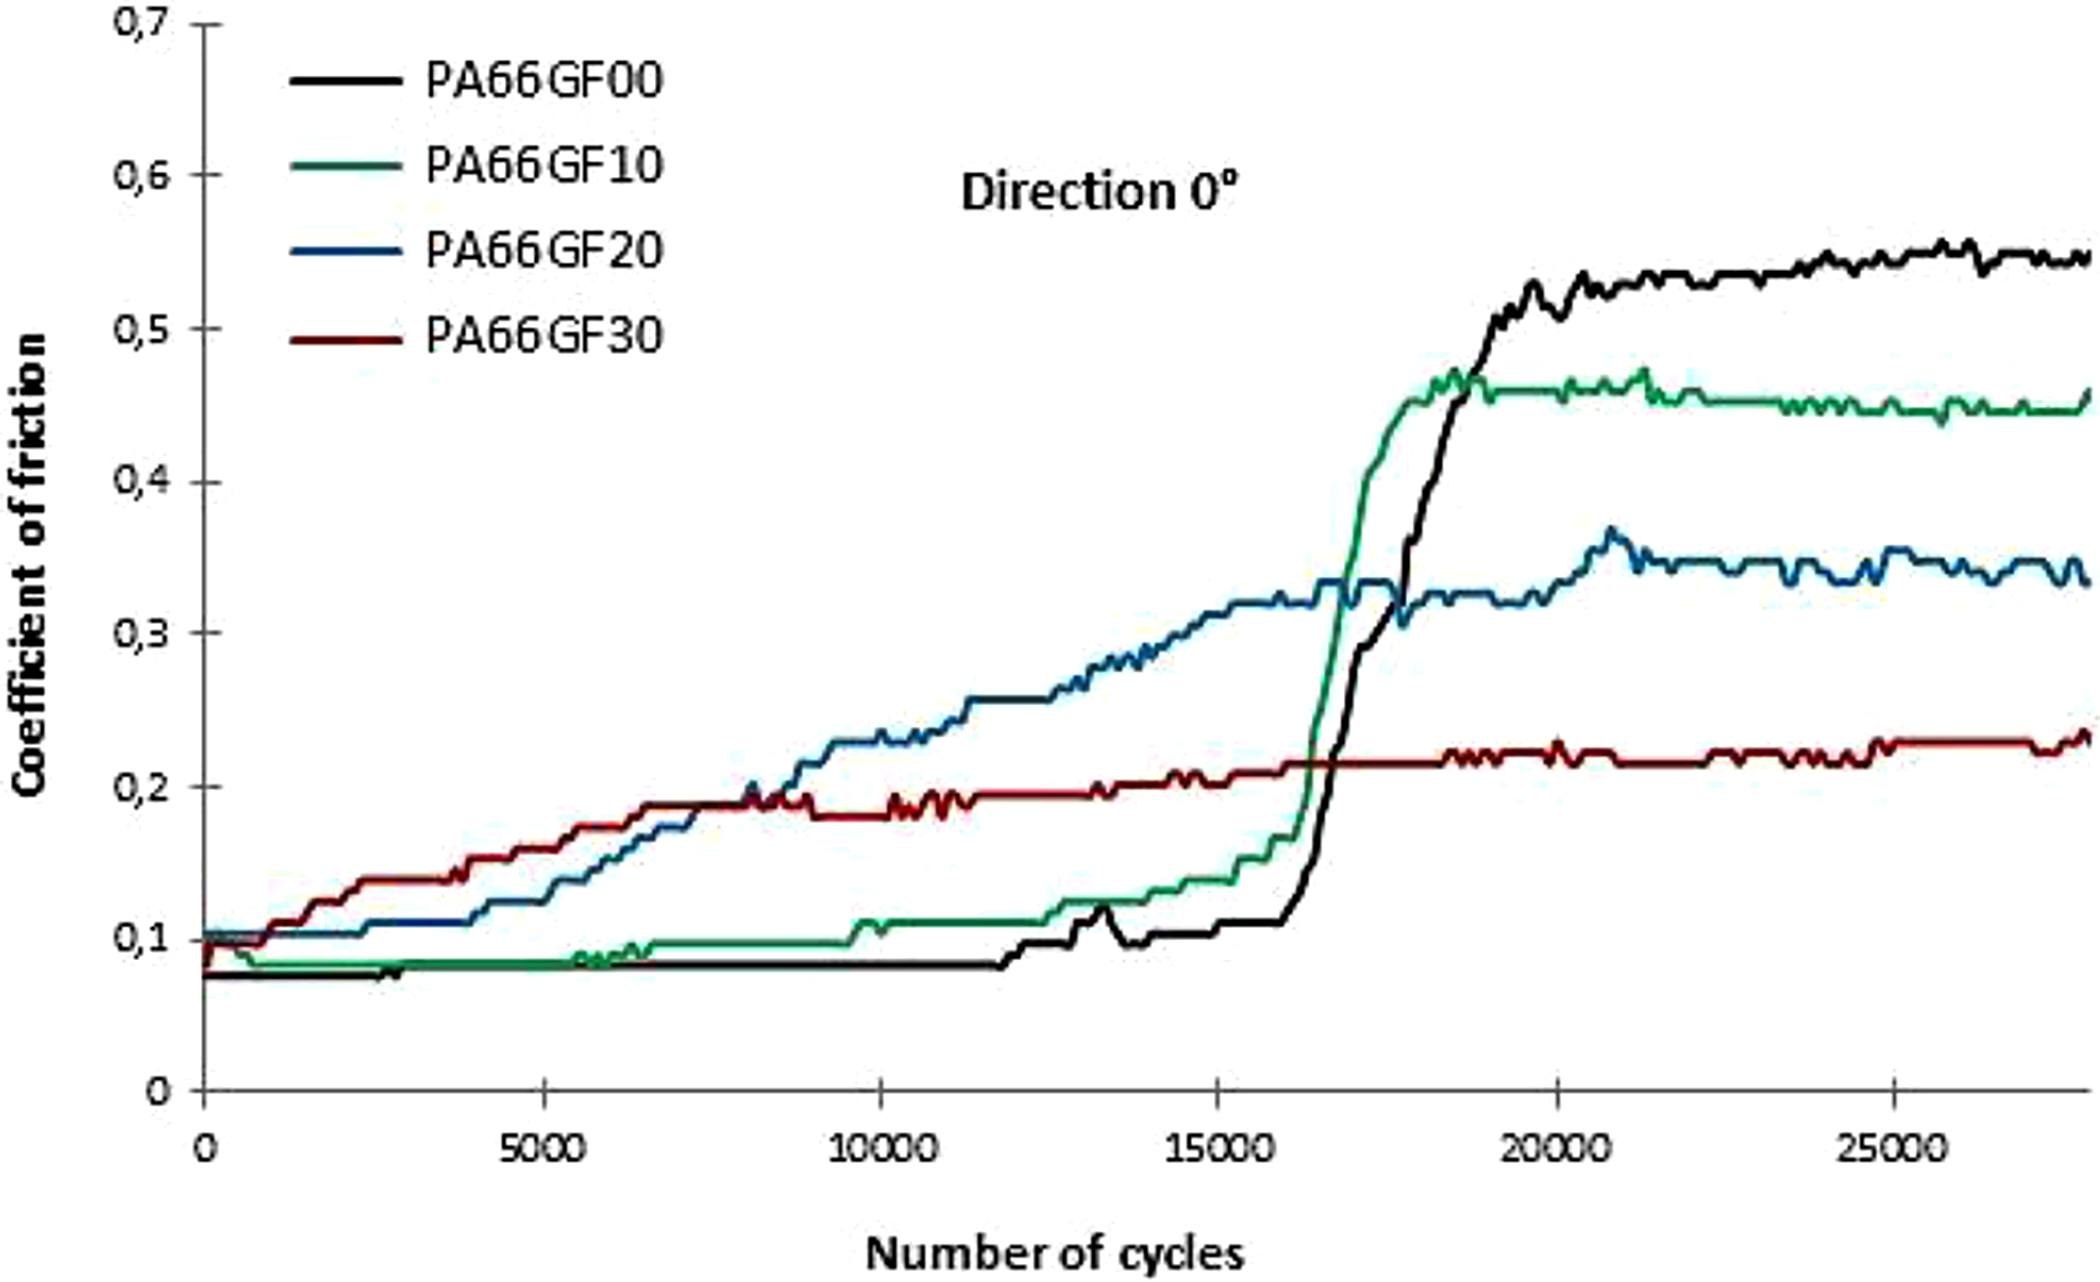
Figures 8 and 9 show that increasing the glass fiber content decreases the stationary coefficient of friction (obtained in the steady state after run-in period). These results are in disagreement with those found by Byett and Allen 3 for a reciprocating sliding contact against stainless steel. These results are, on the contrary, in agreement with those found by other researchers when sliding against stainless steel 4 or carbon steel 5 or against an identical material 6 under rolling–sliding contact.
Coefficient of friction versus glass fiber rate when sliding parallel (0°) to the fiber direction.
Coefficient of friction versus glass fiber rate when sliding perpendicular (90°) to the fiber direction.
Kim et al. confirmed these results and showed that the short glass fibers in the PA 66 composite decreased the friction coefficient by producing contact plateaus with a high density of glass fibers on the composite surface. 5 The change in friction behavior clearly arises because of the changing nature and properties of the interacting surfaces with increasing the glass fiber content. This behavior is probably due to the dominance of a friction mechanism relative to the other when increasing the glass fiber rate. Indeed, the contact between the two antagonists will evolve from a sliding contact between a hard surface (100Cr6) and another relatively soft (polymer) to a contact between two relatively hard surfaces (100Cr6 and glass fiber) when the fiber content increases. Consequently, the first case promotes a soft abrasive friction mechanism and the last one favors the predominance of a severe abrasive friction mechanism. Thus, the coefficient of friction decreases by increasing the percentage of reinforcement in the PA 66 matrix. Similar results are obtained when the direction of glass fiber is changed from 0° to 90°. For high weight fractions (20 and 30 wt %), when sliding parallel to the glass fiber direction, the coefficient of friction is smaller than which is measured in the perpendicular direction.
Wear behavior
Figure 10 shows an increasing wear rate as a function of rubbing time for all samples. Wear rate increases also when the content of glass fiber increases. These results are in agreement with those found by Kukureka et al. 6 in rolling–sliding contact against an identical material. However, they are in disagreement with other works when sliding against stainless steel 3,4 or carbon steel. 5

Wear rate versus rubbing time.
Kim et al. contradicted these results and showed that the short glass fibers in the PA 66 composite improve the wear resistance by a strong reinforcement. 5 The wear rate of the 30 wt% GF sample was significantly sharper than the lower weight percentage composites. This wear behavior is a consequence of the changing nature and properties of the interacting surfaces with increasing the glass fiber content in the PA matrix. The excessive fragility of this composite (PA66GF30) induced higher wear under dynamic sliding. Figure 11 shows that the smaller value of normal load has a minor effect on the value of the wear rate of all tested samples.
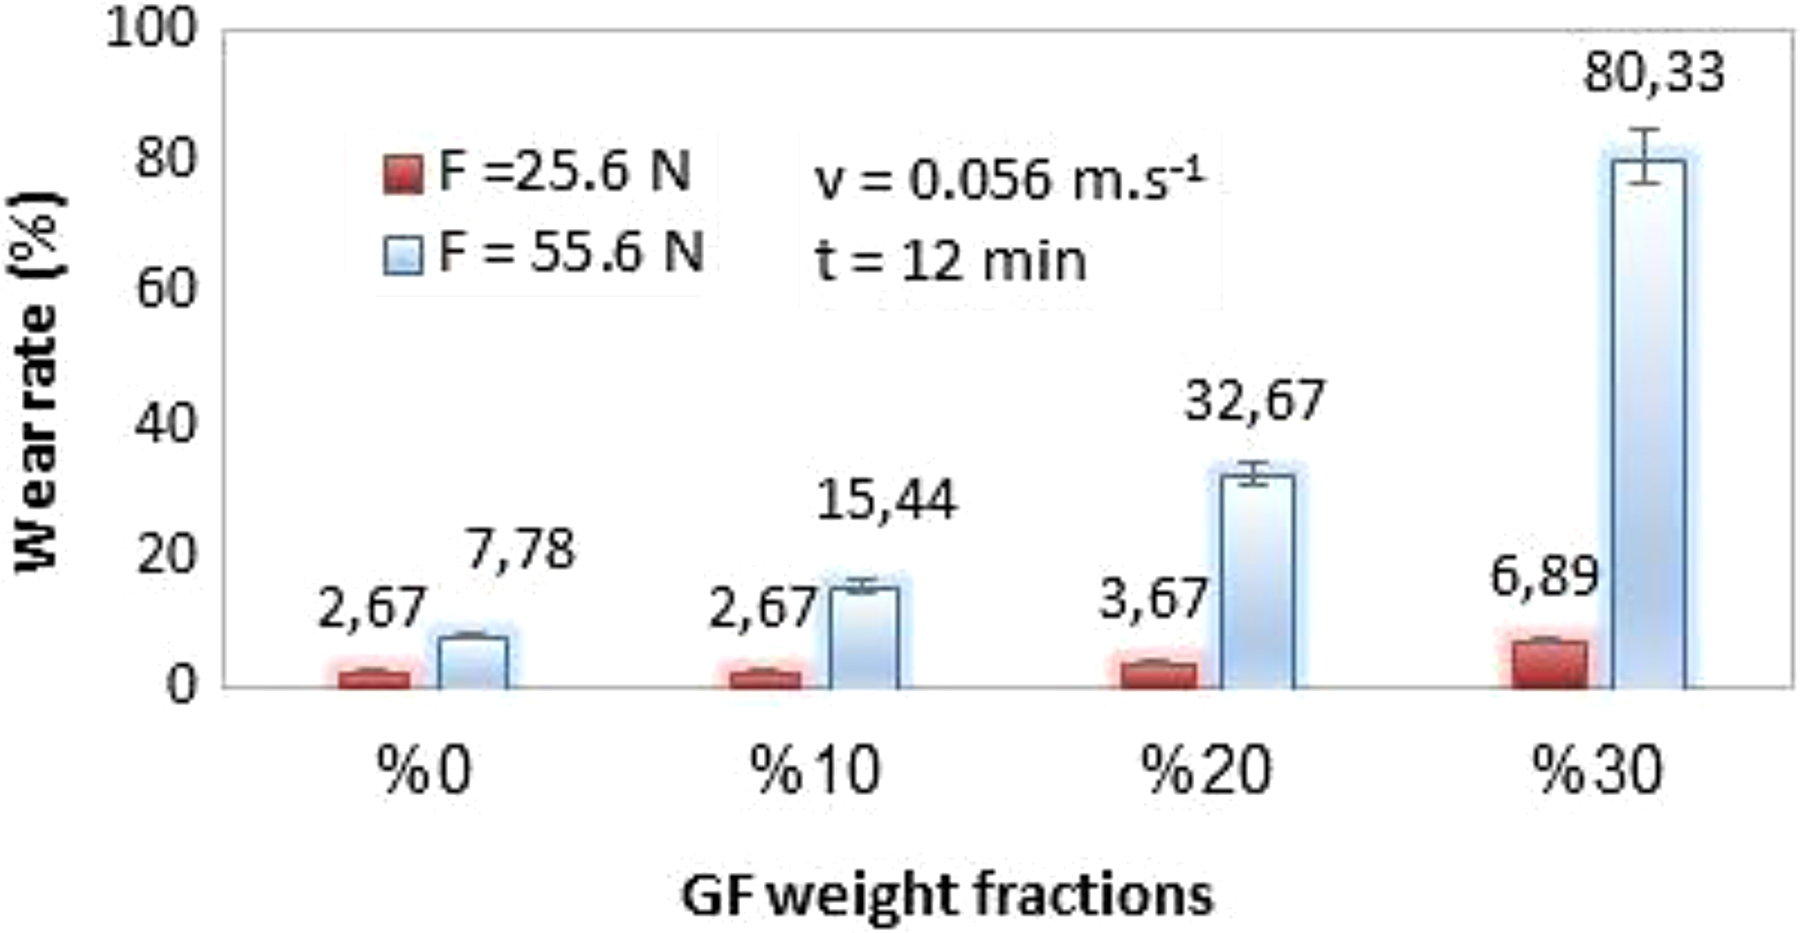
Wear rate versus weight fraction of glass fiber.
A significant gap is observed when the normal load is increased by 30 N, especially for the reinforcement rate of 30 wt%. Indeed, for the unreinforced samples, the wear rate, when applying a normal load of 25.6 N, is three times smaller than which obtained when applying a normal load of 55.6 N. The gap increased for reinforced specimens. At higher force, the wear rate increased by approximately 6 times for a rate of 10%, 9 times for a rate of 20%, and 12 times for a rate of 30%. Figures 12 and 13 show that the coefficient of friction is quasi-stable during rubbing time. The coefficient of friction for unreinforced samples is higher than the coefficient of friction for reinforced ones whatever the applied loads. The average values are between 0.5 and 0.6 for reinforced specimens and between 0.6 and 0.7 for unreinforced ones. Increasing the normal load has no significant effect on the average coefficient of friction. Reinforcement has also no significant influence on the friction behavior during rubbing.

Coefficient of friction versus rubbing time for F = 25 N.

Coefficient of friction versus rubbing time for F = 55 N.
Wear mechanisms
Figure 14 shows typical scanning electron micrographs (SEM), showing the effect of reinforcement and sliding time on the wear track during friction tests (ball-on-flat contact configuration). Zone A indicates the neat surface, zone B indicates the track of wear, and zone C indicates the wear debris. The arrow indicates the sliding direction, which is in these examples perpendicular to the fiber direction. The width of the abrasive wear track is smaller for unreinforced samples and increased when increasing sliding time. Indeed, the width of the wear track is about 1.3 mm for PA66GF30 and about 0.95 mm for PA66GF00 when the number of cycles is 30,600. When increasing the number of cycles to 43,200, the wear track increased to about 1.6 for PA66GF30. Figure 14(a) shows the surface of PA66GF30 before the friction test. SEM micrographs (Figures 14(b) to (d)) show that there is mostly an abrasive process of friction for reinforced and unreinforced specimens. Adherence of debris to metal counterface decreases under high abrasive conditions. Larger asperities on metal counterface deform polymer surface, giving rise to plowing, microcutting, and formation of abrasive wear tracks. For unreinforced nylon (PA66GF00), essentially plastic deformation of polymer occurs during sliding friction.

Typical SEM micrographs showing the effect of reinforcement and sliding time on the wear track: (a) PA 66GF30 (neat surface), (b) PA 66GF00 (30,600 cycles), (c) PA 66GF30 (43,200 cycles), and (d) PA 66GF30 (30,600 cycles).
Wear of glass fibers in reinforced samples is due to the abrasive action of metal asperities. Particles of glass debris also combined to accelerate this abrasive action. Typically, the diameter of the glass fibers is reduced prior to fracturing into shorter lengths due to the effect of the alternating stress system, followed by debonding from the polymer matrix.
Conclusions
In this study, the mechanical and tribological behaviors of monolithic PA 66 and three glass fiber-reinforced PA 66 were investigated. The results showed that increasing the glass fiber weight fraction increased the strength properties, such as elastic modulus, flexural modulus, ultimate strength, and flexural strength, but decreased the ductility (elongation at break). When the glass fiber weight fraction is increased, the coefficient of friction decreased (ball-on-flat contact configuration). For high weight fractions, when sliding parallel to the glass fiber direction, the coefficient of friction is smaller than the coefficient of friction measured in the perpendicular direction. Abrasive friction mechanisms were revealed for reinforced and unreinforced PA 66. When the glass fiber weight fraction is increased, the wear rate increased (flat-on-flat contact configuration). This increase in the wear rate is significant at higher loads (55.6 N) and more noticed for higher glass fiber contents (30 wt%).
Footnotes
Declaration of conflicting interests
The author(s) declared no potential conflicts of interest with respect to the research, authorship, and/or publication of this article.
Funding
The author(s) disclosed receipt of the following financial support for the research, authorship, and/or publication of this article: This work was supported by the Ministry of Higher Education and Scientific Research, Tunisia.