
Abstract
Due to the increase in prevalence of fibre-reinforced polymer matrix composites (FRPMC) in aircraft structures, the need for adaption of failure prediction tools such as fatigue spectra has become more pertinent. Fracture toughness is an important measure with regard to fatigue, while adequate techniques and an ASTM standard for unidirectional FRPMC exist, there are mixed opinions when investigating woven FRPMC. This study describes a three-dimensional finite element model developed to assist in determining the mode II interlaminar fracture toughness (G IIc) of fibre-reinforced woven composites, validated by an experimental and numerical comparison of G IIc determination for unidirectional FRPMC. Experimental testing mirroring the ASTM D7905 resulted in a measure of 1176 J m−2 for the unidirectional specimen, while comparisons made with the literature achieved an average value of 1459.24 J m−2 or the woven specimen. Three numerical methods were employed due to their prominence in the literature: displacement field, virtual crack closure techniques and the J integral. Both the J integral and the displacement field three-dimensional models produced satisfactory unidirectional G IIc estimates of 1284 and 1116.8 J m−2, respectively. Displacement field had a 5% uncertainty in G IIc when compared with experimental results, while J integral had an approximately 8.5% uncertainty. Extending the analysis to the woven specimens, values of 1302.8 and 1465.3 J m−2 were obtained from J integral and displacement field methods, respectively, both within 10% of the experimental values. Hence, numerically determined unidirectional G IIc values were verified with experimental results, leading to the successful employment and extension to woven composites which displayed similar agreement.
Introduction
Composite materials are continually being developed as a means to reduce weight in structures particularly in the aerospace industry. As such this signals a need for understanding their common failure modes and how to efficiently test their properties, so that damage tolerance guidelines can be produced. Delamination is a predominant mode of failure in polymer matrix composites, which consists of layers separating due to matrix failure resulting in crack propagation. 1 As the crack spreads, energy is dissipated during the creation of fracture surfaces, a means of measuring this is the strain energy release rate (SERR). 2 Mode II delamination (shearing) specifically has been broadly analysed with testing methods such as the end notch flexure (ENF) test and ASTM D7905-14 test being developed for unidirectional carbon fibre composites. 3 Kunigal N Shivakumar et al. 4 compared the ENF, ASTM and Japanese Industrial Standard (JIS) standard testing methods. Shivakumar et al. found the JIS method to be a mixed-mode I–II test which underestimated mode II fracture toughness (G IIc), while values for G IIc measured by ENF and ASTM methods were close to equal. The ASTM test has the benefit of an equation for compliance which assists in examining crack growth under fatigue. 4 Studies have been conducted with the compliance methodology mimicking that of the ASTM D7905 for woven specimens, such as Pereira and De Morais 5 who initially conducted finite element analysis (FEA) to choose stacking sequence for woven fabric glass/epoxy multidirectional laminates. Pereira and De Morais performed experimental testing to implement two mode II compliance calibration (CC) reduction schemes, both of which were affirmed for G IIc measurements by finite element (FE) compliance and using virtual crack closure technique (VCCT) results. His findings showed that G IIc increased with ply angle for θ/−θ and 0°/θ specimens. 5
While numerous studies have looked into measuring the SERR of composites under mode II, 5,6 there is a need for comparing experimental and numerical procedures between different kinds of composite materials to cast light on potential means for simplifying SERR determination. Salpekar et al. 7 studied delamination in graphite/epoxy laminates of differing stacking sequence through three computation techniques including VCCT, equivalent domain integral and global energy balance techniques. It was found that VCCT yielded accurate results when compared to other methods along with test results previously published. 8 This study aims to compare experimentally obtained values of G IIc for one type of unidirectional fibre-reinforced polymer matrix composites (FRPMC) with that of numerically obtained values through VCCT, displacement field and the J integral method using ABAQUS CAE. This technique is then used to validate a comparison between previously mentioned numerical methods and experimental CC results for a woven FRPMC.
Experimental and modelling methods
Composite material setup
A number of ENF specimens measuring 177.8 mm in length (7 inch) were manufactured using two different materials. Both of which contained a 76.2-mm (3-inch) long crack, achieved using a 0.0127-mm thick polytetrafluoroethylene (PTFE/Teflon) insert located midplane of the laminate to simulate a 3-inch long initial crack. The recommended specimen layup which was followed during manufacturing is shown in Figure 1.
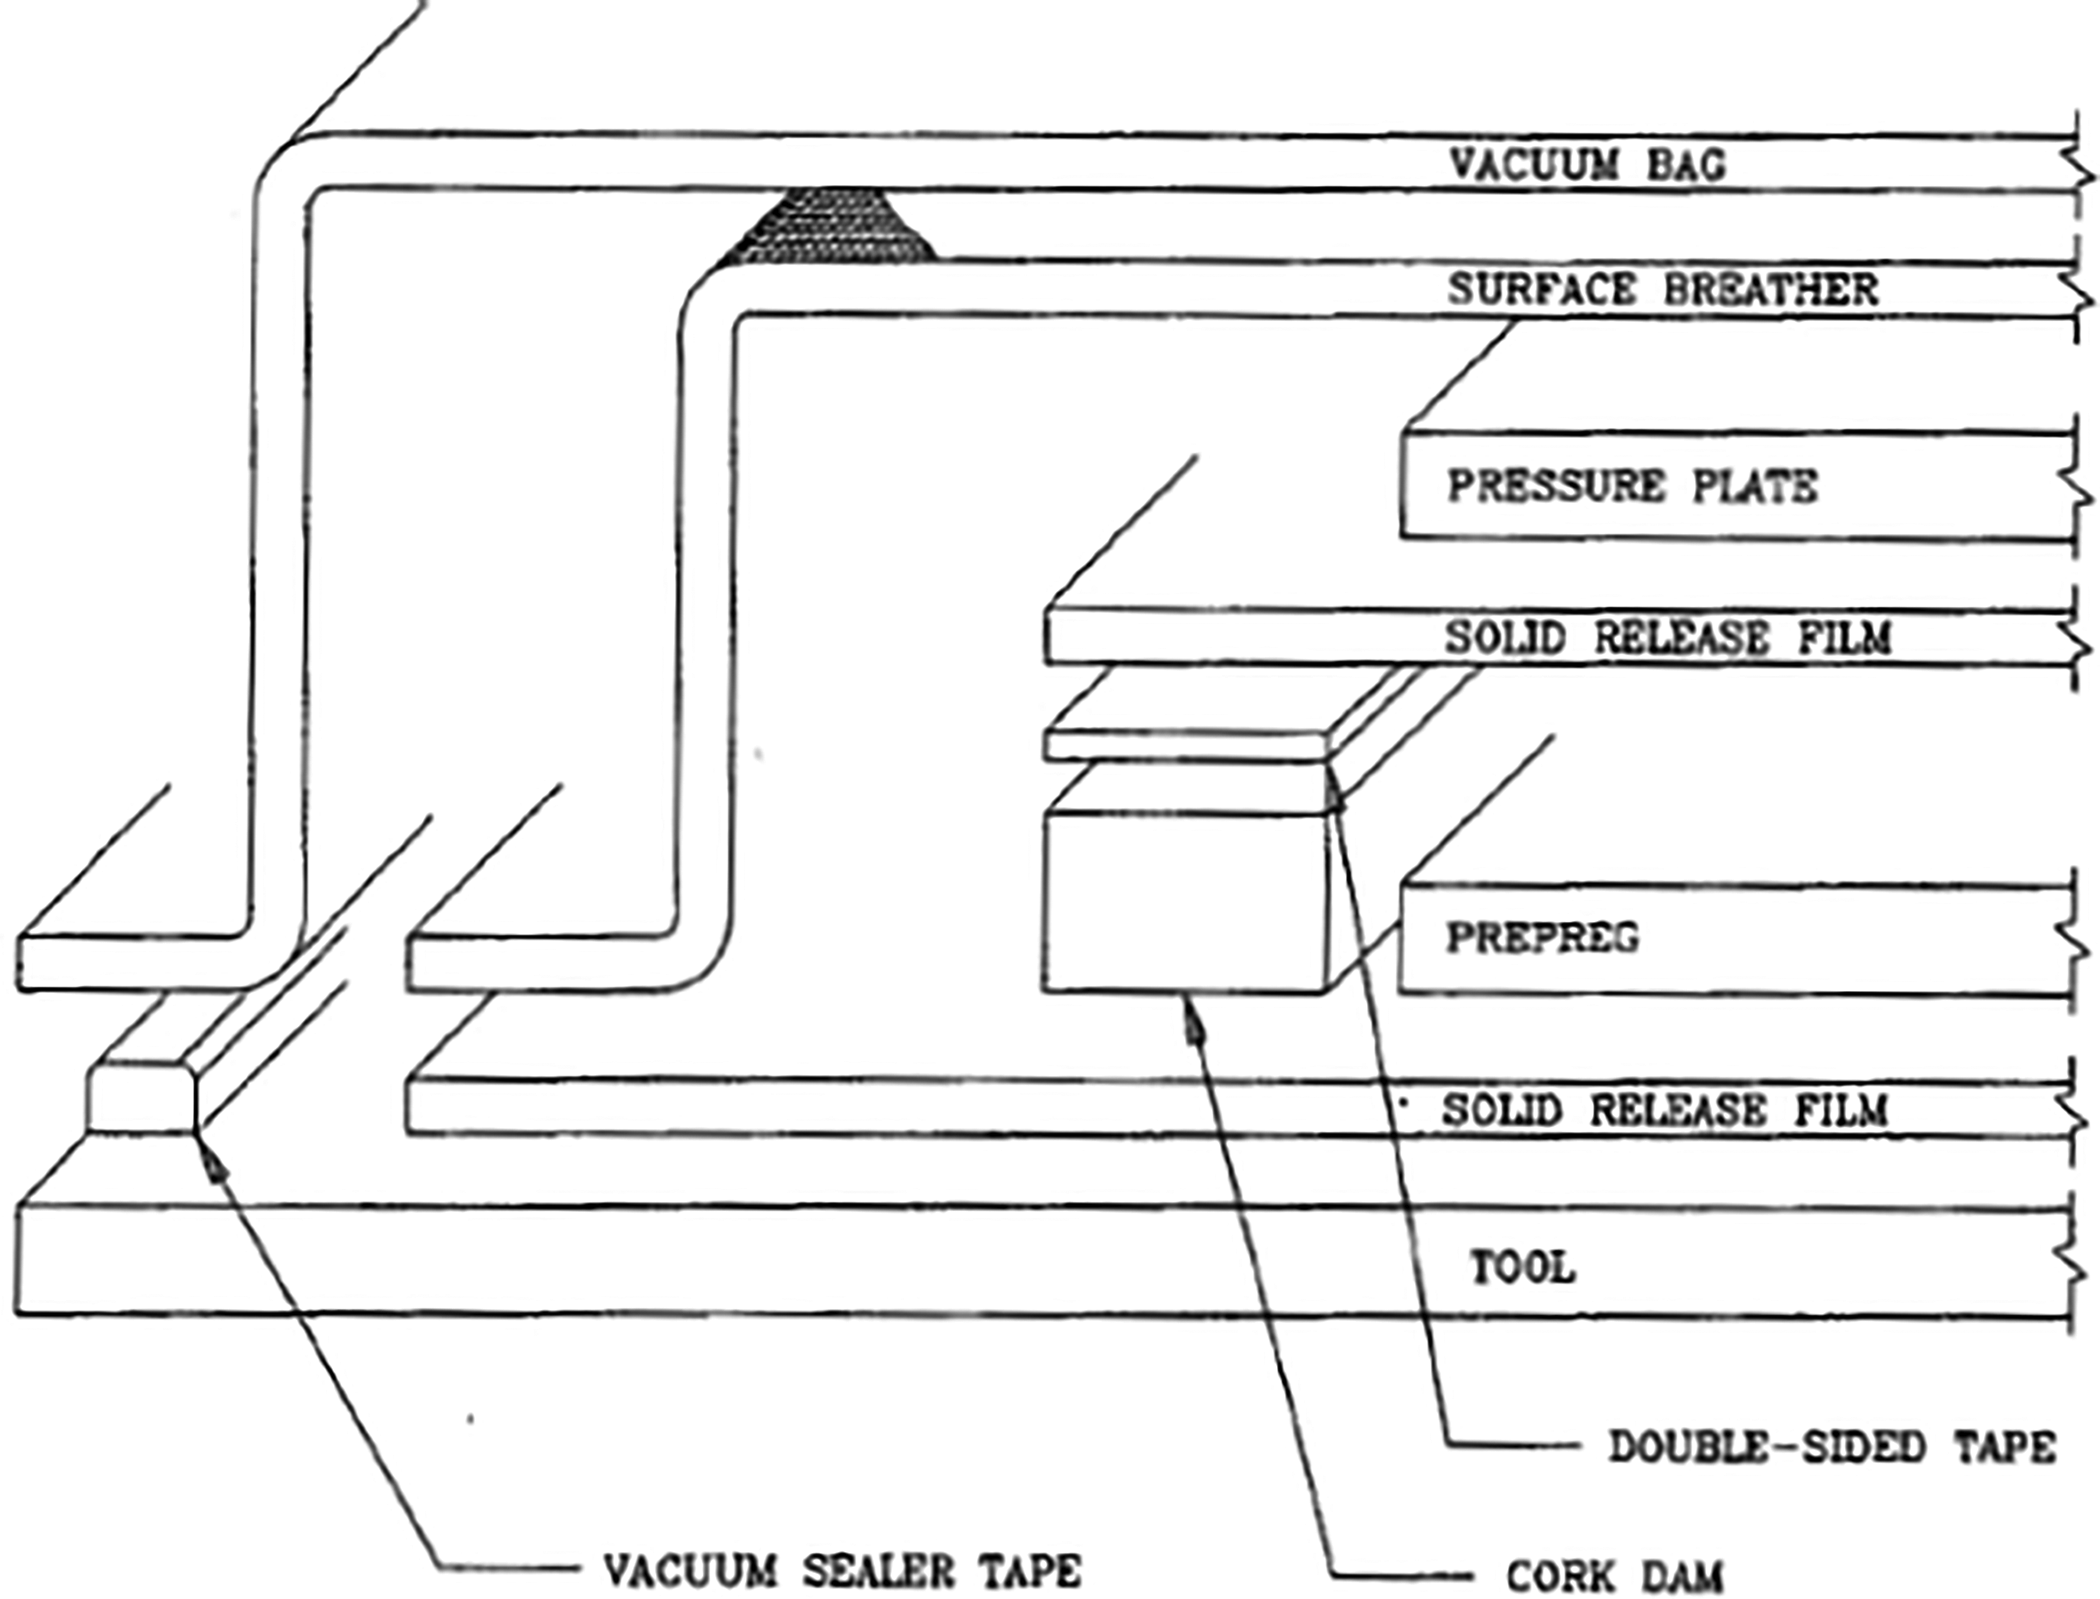
Recommended lay-up for CYCOM® 977-3. 10
The unidirectional specimen consists of IM7/977-3 carbon fibre prepreg. 9 All specimens are 30 plies thick with uniform thickness at each step with a stacking sequence of [0]30 in accordance with the ASTM standard D 5687/D 5687M. 10 It was cured at approximately 177 C (350 F) for 6 h after being heated up at a rate between 0.56 C min−1 and 2.78 C−1 (1–5°F), and it was then cooled down at 2.78 C min−1 (max). 11
The woven specimen comprises a M18/1/G939 carbon fibre prepreg with a satin weave 9 with a fibre volume fraction of 57%. All specimens are 16 plies thick with uniform thickness at each step with a cross-ply stacking sequence of [(0/90)/(+45/−45)]4S in accordance with the ASTM standard D5687/D5687M. 10 Specimens were ramped at a rate of 2 C min−1 and then cured for 2 h at 120 C before being ramp again at 2 C min−1 and further cured for 2 h at 180 C, after which they were cooled at 2 C min−1. 12
Experimental setup
Static tests were carried out using an Instron 1342 machine with a 100-kN load cell enabling the recording of load and displacement values. A reversible three-point bending test rig (Figure 2) was held in position by the actuator machines and specimens were then placed in the rig at positions coinciding with the ASTM standard D7905/D7905M 3 testing procedure for fracture testing and CC. The experimental testing performed uses the pre-cracked specimens for CC.
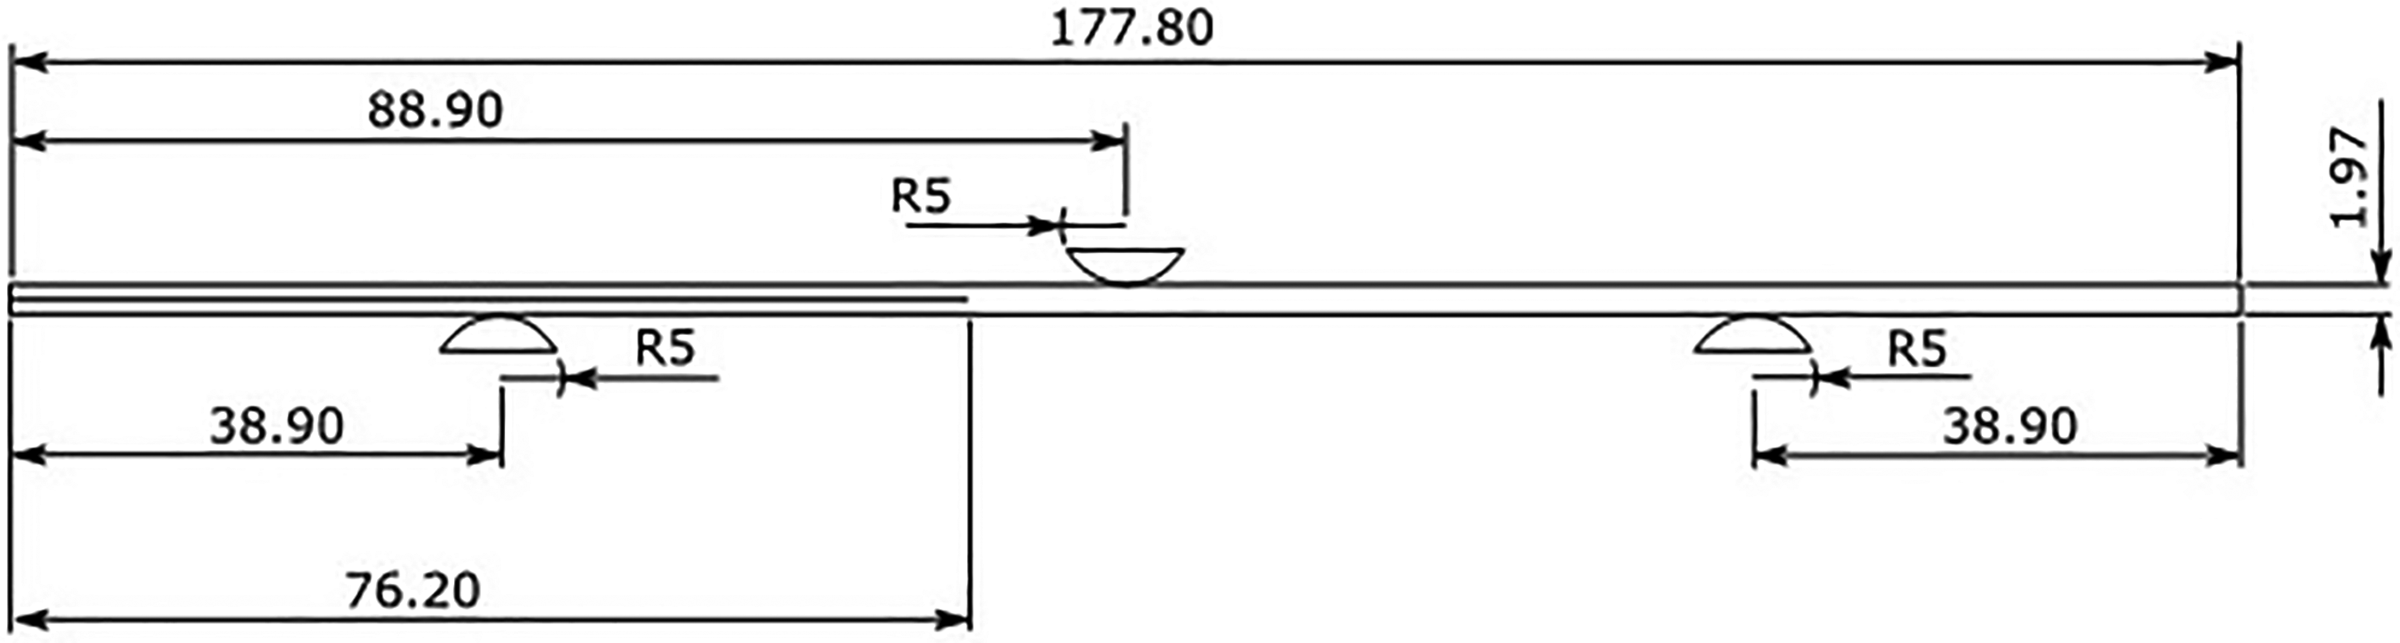
2-D view of the specimen positioned in the three-point bending setup with measurements corresponding to a crack length of 37.3 mm.
Fracture testing was performed by loading the specimens at a rate of 0.5 mm min−13 until delamination propagated to the centre of the specimen and then further until catastrophic failure.
Prior to testing specimens, an optical microscope was used to detect the initial crack tip (end of the Teflon).
CC was carried out by positioning the specimen with a crack length corresponding to 20, 30, 37.3 and 40 mm3 and then loading at a rate of 0.5 mm min−1 until a position corresponding to ≤50% of the critical displacement was reached. The specimen was then unloaded and repositioned at a different crack length and retested. 3
Three-dimensional numerical models
An ABAQUS model of the specimen was created to perform a numerical comparison to experimental results, with the intent of validating numerical determination of G IIc. The model was constructed by defining four separate parts: A specimen part with a section missing above the midplane to enable interactions to be applied to different sections of the midplane along the specimens length, which had a 30-ply lay-up (unidirectional) which was a solid extrude with composite lay-ups. The removed section of the specimen had the same constituents as the remaining section.
Rollers were also modelled as solid half cylinders using the known dimensions of the experimental system with material properties of hardened steel. The friction coefficient between the rollers and the surface of the specimens used was 0.01 14 to prevent sliding of the specimen.
The crack was modelled by a crack seam, located 3 inches away from the left edge (crack front). The purpose of this was to create a gap between the seam and the surface interface allowing for a PTFE interface (normal hard contact) to be enforced between the two specimen midplanes. A two-dimensional model was initially created to guide testing of the three-dimensional model, and the results were collected for both for comparison.
The area around the crack tip (approximately 10 mm) is seeded with a fine mesh using biased seeding with a sweep control to properly capture the localised stress and displacement as a result of displacement-controlled loading. 15 A pinned boundary condition was applied to the two supporting rollers preventing translational movement, while a displacement boundary condition was enforced on the centre of the specimen to prevent sliding. The unique meshing to each method will be discussed in their respective section in the results.
Simulations were performed for the fracture testing, J integral, displacement field and for the manual application of VCCT. VCCT assumes that the energy required to create surfaces through crack propagation is equivalent to the energy required to close those created surfaces. 16
When carrying out numerical analysis, two-dimensional trials were initially conducted as a timely method for accessing the accuracy of the techniques. As VCCT and J integral required different mesh setups the two-dimensional testing assisted in selecting the method with superior accuracy (and numerical efficiency is the results were similar).
Results
Fracture testing
Mode II fracture testing was performed as set out in the ASTM D7905 3 ; the span between the support rollers of the three-point bending test rig was 100 mm with rollers of radius 10 mm, and the test was conducted at a 0 = 37.3 mm. Both IM7/977-3 and M18/1/G939 specimens were then loaded and unloaded at the same rate after catastrophic failure. During testing, the displacement and corresponding force data weer recorded. The resulting data are shown in Figure 3, where the load displacement curves for several unidirectional and woven continue for the entirety of testing.

Average load displacement curves for fracture testing of unidirectional and woven specimens until catastrophic failure.
At the first peak of the curves the crack proceeds to the centre roller hence resulting in a ‘drop’, which corresponds to a change in the material compliance, 3 ASTM D7905 takes 50% of the peak values to model the CC testing parameters to ensure that delamination does not propagate, allowing for multiple tests to be conducted on a single specimen.
ABAQUS fracture testing
Numerical simulation of fracture testing was performed by applying a boundary condition on the loading roller to displace itself by 2 mm such as to load the specimen by displacement control. As the specimen parts were modelled with only elastic material properties (i.e. Young’s modulus, Poisson’s ratio and shear modulus) from Table 1 only a linear relation between load and displacement is calculated, as matrix failure requires knowing the SERR value. Overall, this method is acceptable as only the gradient of the linear region is of interest when considering the compliance of the specimen at a given crack length. All reaction forces (in loading direction) which comprised the curved surface of the loading roller were summated to determine the total force applied as the roller was displaced, resulting in the curve displayed in Figure 4.
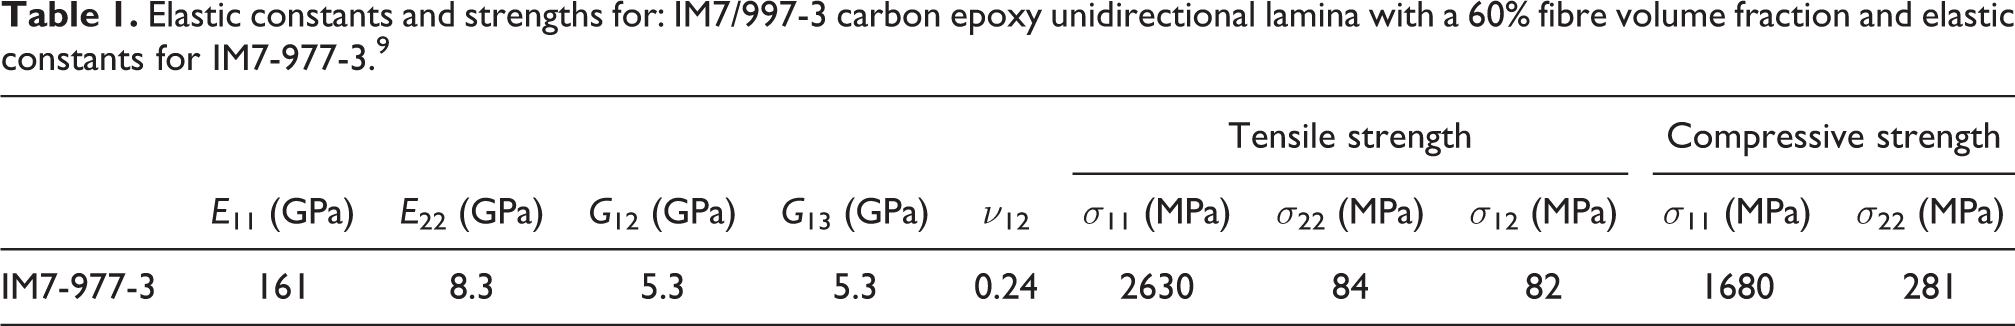
Elastic constants and strengths for: IM7/997-3 carbon epoxy unidirectional lamina with a 60% fibre volume fraction and elastic constants for IM7-977-3. 9
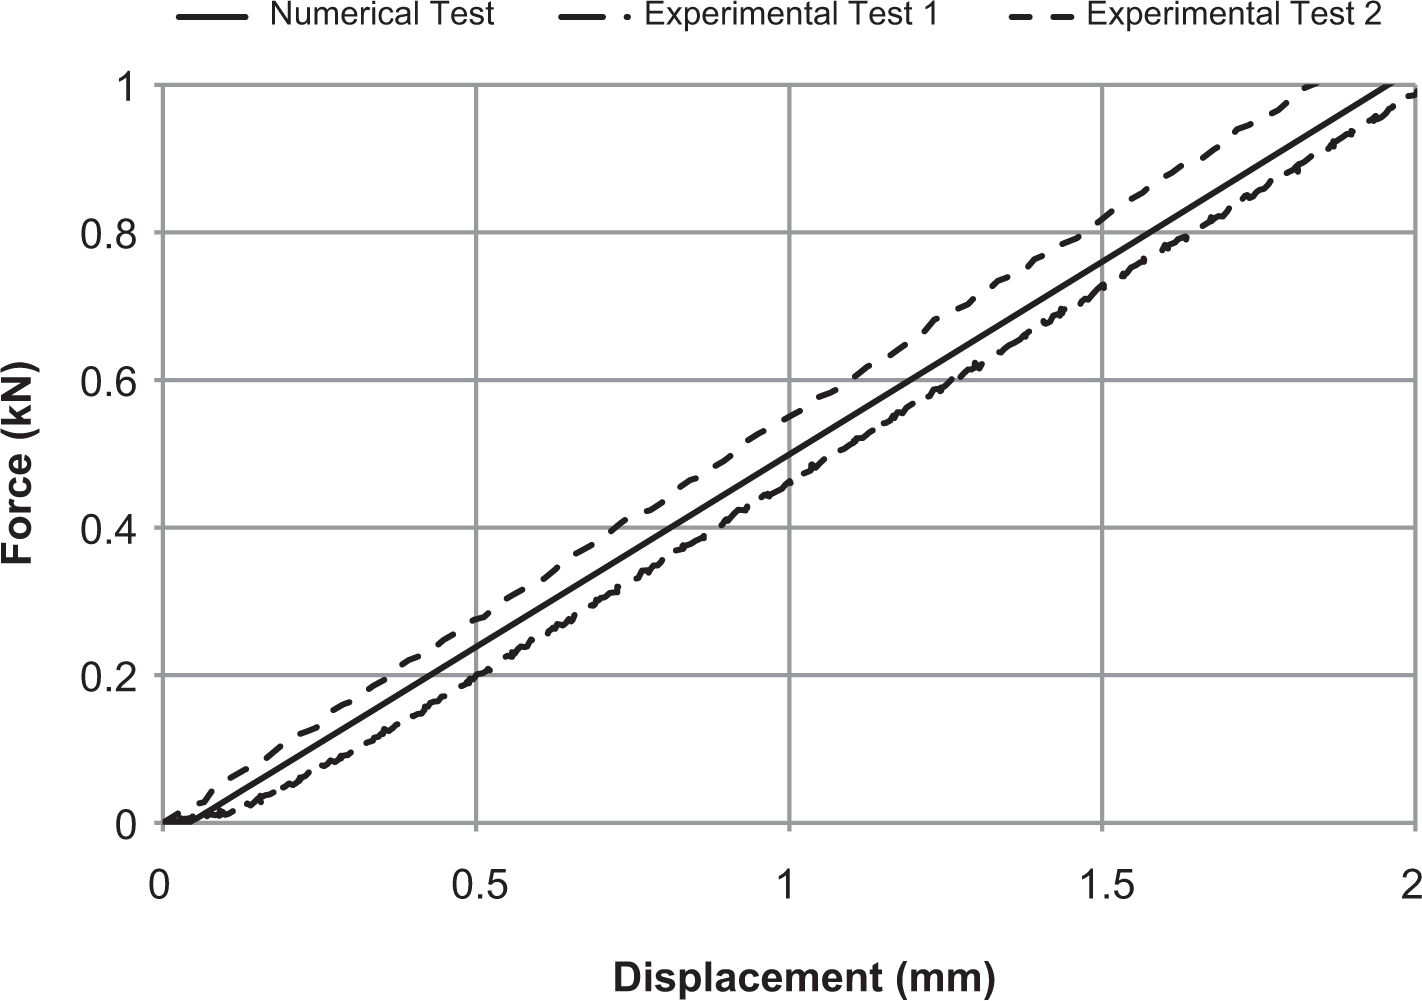
Comparison of experimental and numerical load displacement curves for the unidirectional specimens within the elastic region.
Compliance calibration
CC for the pre-cracked specimens was completed according to ASTM D7905, 3 with three specimens being tested for the IM7/977-3. Specimens were loaded at a nominal rate of 0.5 mm min−1 and unloaded at the same rate, while maximum loading conditions were determined from the fracture results. Hence several crack lengths were tested. Force displacement curves were constructed for CC as they were for fracture testing (Figures 5 and 6), and the difference in gradient (compliance) follows with the change in crack length.

Load displacement curve for unidirectional specimens under static loading at varying crack lengths.

Load displacement curve for woven specimens under static loading at varying crack lengths.
Next, the CC coefficients were calculated for each crack length, with only the linear region of load–displacement data being utilized and not potential nonlinearities present at the beginning of testing. 3 The resulting parameters of A and m were found using a linear least squares linear regression as well as the correlation coefficient r 2. This analysis enabled for the fitting of the force versus displacement data at each individual crack length, corresponding to discrete values of both displacement and force.
The compliance for each crack length C was then plotted with the cube of the crack length a 3 and subsequently fitted by the same statistical method. 3,17

This produced a relation between the compliance and the crack length which can be used to determine the SERR using equation (2):

The ASTM D7905 assumes that the SERR distribution along the crack front is uniform, and this behaviour is not exhibited by multidirectional laminates due to the effects of bending–extension/bending–shearing/twisting–extension coupling. 18 Hence, relations developed for carbon/epoxy woven composites by Pereira and De Morais 5 which have seen much applications were utilised for the woven specimens: 19 -21

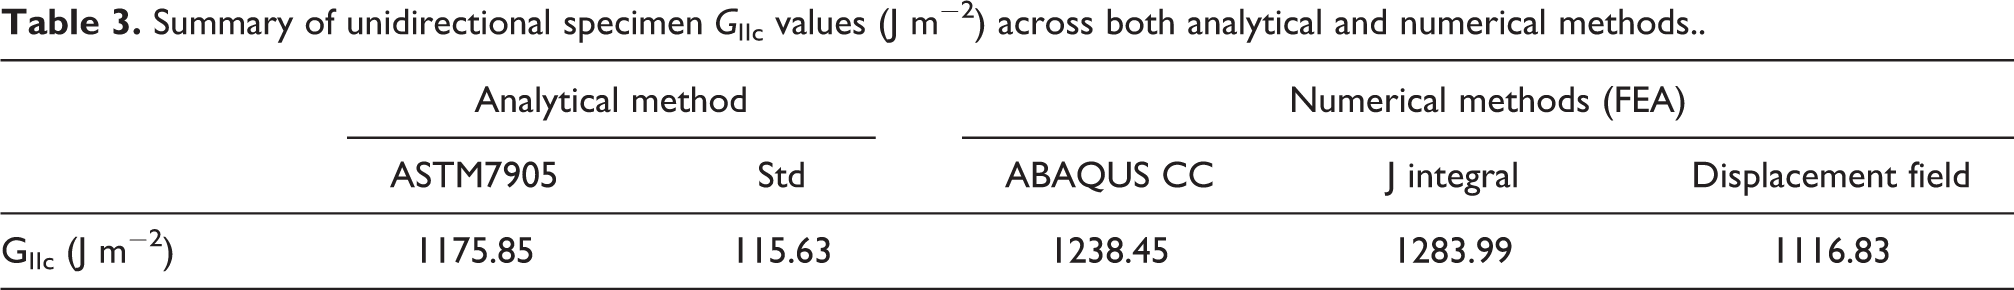
Figure 7 shows CC curves for both types of specimen, though only the unidirectional variants were used with equation (2) to find G IIc. Notably, both curves possessed similarities of at least 98.8%. The gradient of the unidirectional curve (m) resulted in a G IIc value of approximately 1175.85 J m−2, while equations suiting the woven specimen which were described by Reis et al. 22 produced a G IIc value of approximately 1408.11 J m−2.

Least square linear fit of compliance and the cube of the crack length data for the unidirectional and woven specimens.
ABAQUS compliance calibration (unidirectional)
Similar to the compliance testing carried out experimentally, the previously created models were altered to adjust the crack length of the specimens. The unidirectional specimens were then loaded under displacement controlled boundary conditions to obtain load displacement curves. As with the experimental procedure, the compliance was calculated from the curve which was then fitted to enable the calculation of G IIc (see “Compliance calibration” section for relevant formula). A G IIc value of 1238.45 J m−2 was obtained, which is within approximately 6% of the experimental value.
ABAQUS displacement field (unidirectional)
The displacement field method uses the relative change in horizontal and vertical displacement of nodes after application of a load. By probing before and after the loading roller was displaced, the following formulae were utilised to determine the mode II interlaminar fracture toughness: 14


where r is the distance between the crack tip and nodes that are immediately in front of the crack tip along the direction of propagation, μ is the shear modulus, κ is an adjustment dependent on plane stress and plane strain, ν is Poisson’s ratio, E is Young’s modulus, θ is the angle the crack propagates along relative to the initial crack tip and ux and uy are the nodal displacement between two nodes in coincidence before crack propagation. 14 Edges were seeded from the end of the refined region enclosing the crack tip using a single bias from 0.0005 m to 0.005 m, with hex controlled mesh control. Elements inside the refined region were consistently of size 0.0002 m with a hex sweep mesh control. The element type was C3D8R for the entirety of the specimen model.
The resulting G IIc estimates at each node were plotted against the corresponding distance from the crack tip. A linear extrapolation was then performed to find the y intercept which corresponds to the G IIc approximation. As the radial distance decreases, the calculated value of G IIc approached a singularity, 23 hence the values far enough from the crack tip were chosen for the linear fit (similarity of 95%), such that no exponential behaviour was present. The resulting G IIc value was determined to be approximately 1116.83 J m−2 for the three-dimensional unidirectional model.
ABAQUS J integral (unidirectional)
The J Integral is a two-dimensional contour integral which encloses the crack tip, while possessing starting and finishing points on the crack faces. It is commonly used to determine the energy release rate observed with the growth of a crack. 24 ABAQUS has an inbuilt user interface which enables J Integrals to be calculated, though the mesh close to and inside the contour needs to be tailored for consistent results. ABAQUS requires that inside the contour a sweeping mesh algorithm is used. A region on either side of the crack tip had its mesh refined to ensure that there was no significant discontinuities in the mesh sizing, 25 a biasing factor 1.2 was applied along the radius of a circle of radius 0.005 m with the mesh concentrated towards the crack tip comprised nine elements, with C3D6 elements. The circle was split into four quarters each with 13 elements (no bias), and a smaller circle surrounding the crack tip (radius of 0.00004 m) just as the larger circle had a wedge sweep mesh control. All circles surrounding the crack were enclosed by a square which restricted the element size to 0.0001 m. The remainder of the model was comprised of C3D8R structured elements that were at largest 0.005 m and at smallest 0.0005 m, with single bias applied from the crack tip region outwards.
Due to the J integral functionality in ABAQUS, a sweeping mesh was implemented around the crack tip rather than a structured mesh as shown in Figure 8. This was beneficial because contour integrals are calculated as layers of elements surrounding a crack front. Five contours were constructed to produce five G IIc (J integral) values, each had a circular/curved shape.
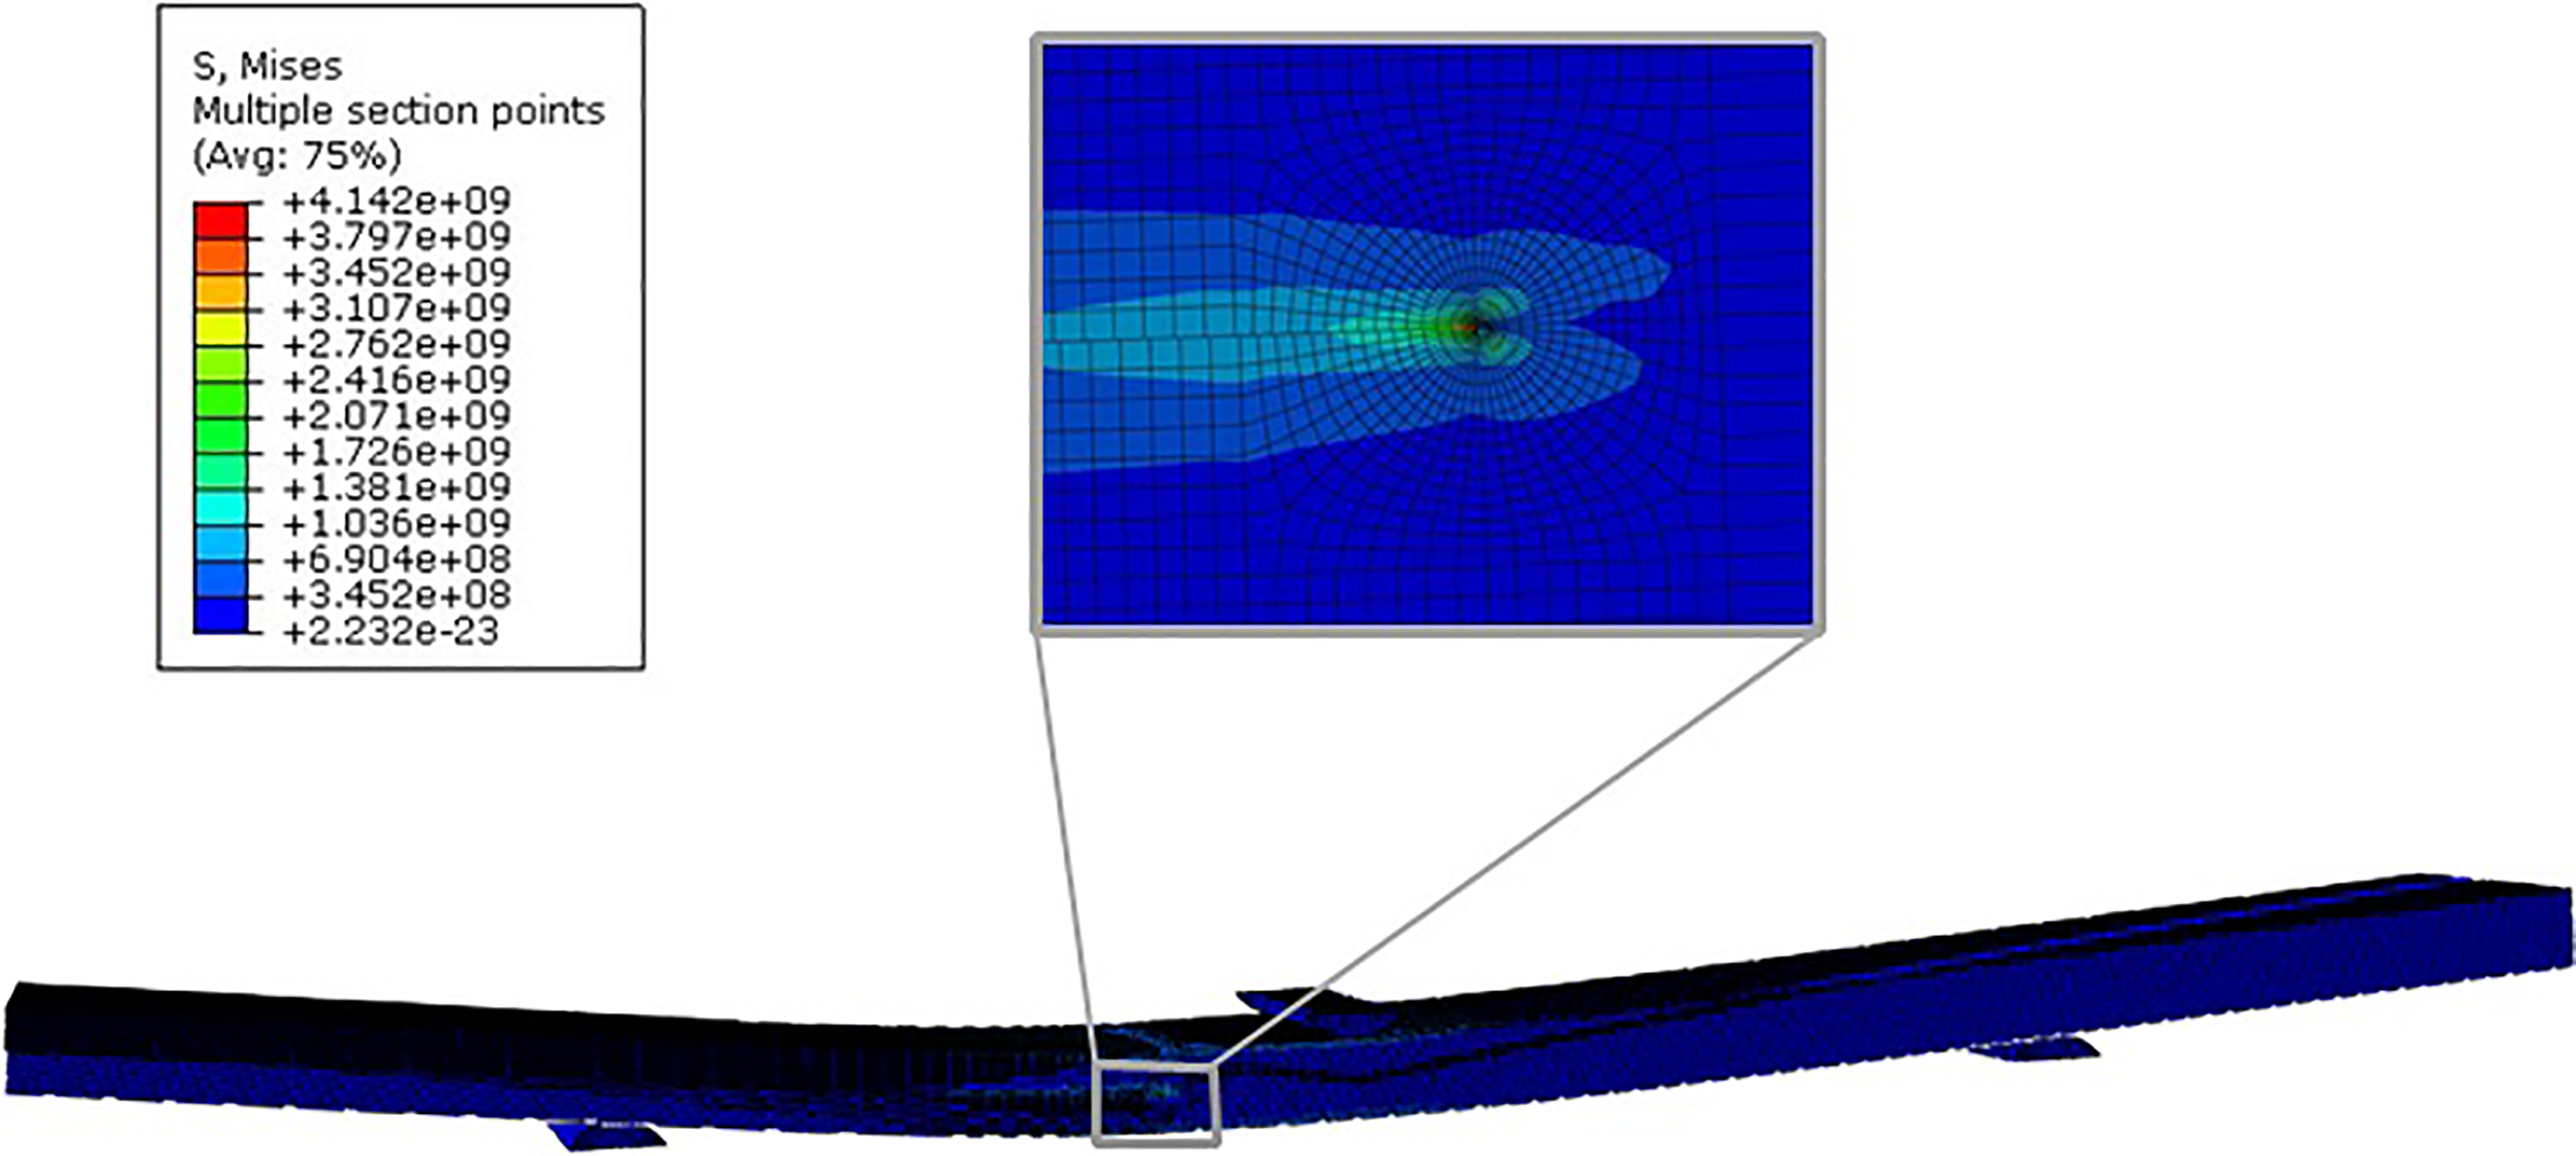
A zoomed in view of the mesh pattern close to the crack tip used when performing the J integral in ABAQUS.
All corresponding unidirectional contours throughout the width of the specimen displayed a standard deviation less than or equal to 2.5. The average unidirectional G IIc value of all contours were 1283.99 J m−2 with standard deviation of 84.5 between contours.
ABAQUS woven
Following the unidirectional numerical testing, the material properties of the FEA model were modified to determine G IIc for the woven specimens using values provided from Table 2. Numerical load displacement curves were checked with experimental curves and were all found to be representative. Several analytical methods were implemented to determine G IIc; Reis et al. utilised a modified crack length measure which was calculated from the specimen compliance. 22 Ogasawara et al. used the more common conjugate beam analysis which takes the peak load and displacement into account. 26 Morais and Pereira fit the CC data to a third-order equation and using the resulting parameters calculated G IIc, 27 and the ASTM D7905 standard which was intended for unidirectional ENF specimens. Both displacement field and J integral were performed for the woven specimen as similar results were found for the unidirectional case, which are shown in Tables 3 and 4.
Material properties of HexPly M18/1/G939 carbon fibre prepreg. 13

Summary of unidirectional specimen G IIc values (J m−2) across both analytical and numerical methods..
Summary of woven specimen G IIc values across both analytical and numerical methods.

All analytical methods (except the ASTM D7905) fall within 10% of each other giving a reasonable range for the numerical results to reside in. The ASTM D7905 demonstrated a significant underestimation of G IIc with a value of 995.07 J m−2. The J integral and displacement field elastic results both fell within the analytical range with values of 1302.78 J m−2 and 1465.3 J m−2, respectively.
Discussion
The experimental static results demonstrated the behaviour described by the ASTM standard, with Figure 3 showing an initial linear relation between load and displacement, followed by a steep drop corresponding to crack growth to the loading roller. Although the woven specimens do exhibit a shallower drop than the unidirectional, the followed change in gradient confirms the specimens experienced damage. Using the critical points of the fracture tests as a means for safely loading within the linear region, CC was performed with a peak displacement of approximately 2 mm (unidirectional) and 3.8 mm (woven). The unidirectional specimen achieved a similarity of 98.8% with the linear fit on the compliance curve implying strong correlation, this validated retaining the CC results and using equation (2) to calculate G IIc (1174.9 J m−2). The woven specimen displayed equally good linear behaviour with a 99.4% similarity, however, the ASTM 7905 was designed for unidirectional FRPMC specimens not for woven FRPMC specimens hence equation (3) described by Reis et al. 22 (among others) was utilised to calculate G IIc to be 1408.1 J m−2. As both specimen values were determined by experimentally dependable means, they were used as a basis by which to compare the numerical results.
Two-dimensional numerical models were initially setup using ABAQUS CAE to obtain G IIc estimates in a timely manner. These results agreed with experimental data but to ensure a more representative FEA model with the intention of implementing progressive damage in a three-dimensional model, focus was placed on three dimensions. In a similar vein, results for the unidirectional specimens were sought after first to validate the numerical model before extending to the woven specimens. The two-dimensional results for both VCCT and J integral were within 5% of the experimental G IIc values. Thus only one of the methods, J integral, was used in three-dimensional analysis due to its numeric efficiency. The J integral displayed high accuracy through the width of the specimen (i.e. comparing Contour ‘X’ at different depths), with all contours having a standard deviation (σ 2) approximately less than 2.53, indicating the transition from two to three dimensions did not adversely reduce the accuracy of J integrals. However, the accuracy when comparing the contour to each other did return a more sizable σ 2 of 84.45 with an average G IIc of approximately 1284 J m−2. While within 10% of the experimental value, this indicates that the model is excessively stiff, signalling for implementation of a progressive damage model. The displacement field method on the other hand produced three-dimensional results which were within nearly 5% of the experimental results (1116.83 J m−2 with both two- and three-dimensional models generating similar results (within 9%).
Of the three numerical techniques implemented, displacement field displayed results that most closely represent the unidirectional experimental G IIc values. However, as the displacement field estimate was less stiffer than the experimental value, implementation of a progressive damage model was expected to result in a larger difference between the two.
The agreement between the experimental and the numerical unidirectional results was justified using the ABAQUS FEA model with woven material parameters. As the literature devoted to fibre-reinforced polymer matrix, woven composites is significantly less prominent than unidirectional composites and there is no standard for determining G IIc for woven composites, and several methods described in the literature have been implemented for comparison. Of the three analytical methods examined, 22,26,27 all are within 10% of each other and the Reis and Pereira values are within 1%. As with the unidirectional material, the woven FEA results were similar to the analytical values with both values being within 15% of all values.
Conclusion
A series of static experimental tests were carried out in line with the ASTM D7905 to determine a value G IIc of 1175.85 J m−2 for IM7/977-3 subjected to three-point bending. This experimental measure was then used as a means for comparing three numerical methods which aimed to determine G IIc using ABAQUS CAE. Of the three techniques implemented, displacement field produced the most experimentally accurate results with G IIc found to be 1116.83 J m−2. While the J integral produced results within 10% of the experimental results, the notably high variance between the inner and outer contours (σ 2 = 84.45) suggests sensitivity to mesh density (in three dimensions) as the contours increase in size so does the estimate of G IIc. Similarly the J integral results also indicated that implementation of a progressive damage model would likely benefit G IIc numerical predictions due to the relatively high stiffness exhibited (1284 J m−2). The general agreement between experimental and current numerical results justified extending the numerical modelling to the woven specimen. The resulting woven analysis demonstrated agreement between several analytical sources and the implemented numerical methods. The intended use of this comparison and extension is to provide an alternative to experimentation for determination of G IIc, enabling specimen allocation to be more heavily weighted to fatigue testing.
Footnotes
Acknowledgements
This work was conducted using facilities provided by Monash University with technical assistance and specimen manufacturing provided by DST Group.
Data availability
The raw/processed data required to reproduce these findings cannot be shared at this time as the data also forms part of an ongoing study.
Declaration of conflicting interests
The author(s) declared no potential conflicts of interest with respect to the research, authorship, and/or publication of this article.
Funding
The author(s) received no financial support for the research, authorship, and/or publication of this article.