
Abstract
The moisture sorption isotherm of wheat gluten/epoxydized sesame or sunflower oil resin was determined at 25, 40, and 55°C. The resin was prepared by cross-linking epoxydized oil and wheat gluten using 1, 2, and 3% zinc chloride as the catalyst. The experiment was carried out over 0.1–0.9 water activity (a w) range using gravimetric sorption analyzer (Q 2000, TA Instruments, New Castle, PA, USA). The resin isotherms were found to be type III shape where the equilibrium moisture content (EMC) was higher at lower temperatures. The EMC of gluten epoxy resin was dependent on the degree of cross-linking because more cross-linking decreased EMC. The Guggenheim Anderson-de Boer (GAB) parameters support the theory of the free volume as it relates to monolayer absorption. This could be attributed to the decrease in the number of water binding sites due to the development of dense areas during cross-linking and increase in the free volume. The GAB and Brunauer–Emmett–Teller were found to be suitable for predicting the water sorption isotherm for gluten protein resin because it provided low root mean square error. The heat of sorption based on the Clausius–Clapeyron equation (qst) increased with decrease in moisture content.
Introduction
Consumer demands and rising petroleum prices are inspiring the development of an alternative to nonrenewable resources originating from agricultural sources. Regardless of the widespread research, major drawbacks of thermoplastic prepared from plant-based materials are water stability and brittleness compared to synthetic plastics. 1,2
Moisture sorption isotherm refers to the relationship between water activity, moisture content, and temperature. The adsorption of water into the structure of polymers destroys its structure and functional properties. Therefore, numerous studies were published describing the effect of moisture on the thermomechanical properties of epoxy resin network. 3 –6 Disruption of hydrogen bonding between segments of the polymer was proposed as mechanism for the effect of water on epoxy resin. Generally, water desorption studies are considered a better indicator of how water absorption affects epoxy resins. 7 –18 The occurrence of epoxy resin degradation in the presence of water is due to the interaction between water and the polar groups present in the polymer side chains causing rupture of the initial network. 19 In addition to plasticization, water can cause resin cracking, swelling, and weight gain. The process of water absorption takes place in three stages, where water occupies existing free volume of the polymer, binds to the polymer network causing swelling, and finally attacks the dense region. 20 The free volume of the polymer is defined as the difference between the measured volume of a polymer and the occupied volume, which is to change during polymer cross-linking.
Resins prepared at different curing temperatures absorb the same amount of water in similar conditions and have similar water diffusion coefficient. 21 Solubility test of epoxy resins prepared from cross-linked epoxydized oils and plant proteins showed that some resins are more stable at low pH than others. 22 Resin stability can be attributed to the presence of more oxirane rings leading to more crosslinking sites. 20
Resin modification by both temperature and/or moisture is directly associated with the presence of unreacted binding sites during the gelation and setting of the resin. It has been established that even for a completely cured epoxy resin, many hydrophilic sites (groups) could be available on the surface of the final network of the resin. In fact, for the epoxy system, the cure reactions conditions are driven by the primary amino addition reaction (–NH2) and the oxirane group, producing hydrophilic hydroxyl groups (–OH). 23 For nonstoichiometric formulations with excess of epoxy monomer, the epoxy rings could, in principle, react with these hydroxyl groups, 24,25 but this secondary reaction will not contribute to the reduction of the number OH groups. Besides, amines are also strong hydrophilic groups, when in excess could contribute to moisture uptake. 26 Polymer cross-linking catalyst or hardener brings about a two-phase macromolecular structure composed of regions with high cross-link (dense regions) and lower cross-link. Therefore, varying amounts of catalyst makes it difficult to correlate water absorption behavior to the developed macromolecular structure. Epoxy-rich systems have a more open macromolecular structure with lower dense phase fraction than the amine-rich systems. 27
The most common models used for sorption isotherm determination for different materials are Guggenheim Anderson-de Boer (GAB) and Brunauer–Emmett–Teller (BET). The GAB model is represented by constants C and K (equation (1)). The constant C is a positive value represents the total heat of the first layer of sorption and takes a positive value due to the strong exothermic interaction of water vapor with the primary sorption sites on the surface of the material. The K constant symbolizes the properties of the multilayer molecules (bulk liquid). Negative C and K values more than unity are physically impossible and illogical. It is well established that the validity of a sorption model cannot be proved simply by fitting the experimental data, but a physical–chemical explanation is also required. 28 In some cases, the R2 of GAB or BET model can be >0.90, but the model may not fit the data. Therefore, some statistical models should be used to further verify the model fit, such as, percentage root square error. Sorption data can be gathered at different temperatures, which permits the determination the heat of sorption at various moisture contents using the best fitting equation. 29
The objectives of this work were to determine experimentally the equilibrium sorption isotherm of cured epoxy resin prepared from epoxydized oils and vital wheat gluten. The amidolysis of oxirane of epoxydized sesame and sunflower oil was catalyzed by zinc chloride. The experimental data are applied to BET and GAB isotherm models. From the temperature dependence of the sorption, the isosteric heat of sorption (IHS) was calculated according to Clausius–Clapeyron equation.
Materials and methods
Materials
Sunflower and sesame oils were purchased from the local market and vital wheat gluten (VG) was obtained from Midwest Grain Products (Pekin, IL, USA).
Development of epoxydized oils
The epoxydized oils were prepared by reacting sunflower or sesame oil with hydrogen peroxide in formic acid. The oil of interest (about 280 g) was placed in a three-necked flask with a heating jacket where on the top of the flask, a mechanical stirrer for good mixing, and stable temperature was placed. After adding 25 ml of formic acid and 200 ml of 50% peroxide, the temperature was increased from 40°C to 70°C. 30 The mixture was stirred continuously for 7–9 h. The product was washed with saturated ethyl acetate and sodium chloride at pH 7.5 and dried at 60°C in a vacuum oven.
Analysis of epoxydized oils
The yield of the reaction was tested by Fourier transform infrared (FTIR)–attenuated total reflection (ATR) method (Bruker Alpha-Eco ATR-FTIR; Bruker Optics Inc., Ettlingen, Germany). The epoxy ring bonds C–O–C stretching was detected at 824–842 cm−1 using the FTIR. 31 The end of the reaction was determined by monitoring the size of the oxirane peak and amide I and II bands.
Development of epoxy resin
The cured epoxy resin reaction was carried out by adding epoxydized oil (50 g) in a jacketed glass reactor at 70°C, three levels of zinc chloride (1, 2, or 3% of ZnCl2), and a little nitrogen purge. The VG (20 g) was added slowly at 650 r min−1 and then increased to 750 r min−1 until the reaction reached completion. The product thickness, disappearance of the C–O–C bonds, and reduction in amide I and II bands were used as indicators to decide the end of the reaction. The most obvious indicator of the end of the reaction is the upsurge of the product thickness, where the material becomes thick enough to prevent the stirrer from turning. This is in addition to the disappearance of the C–O–C band at 845–824 cm−1 as mentioned earlier and the reduction of amide I at 1655 cm−1 and II at 1533 cm−1 on the IR spectrum.
Sorption isotherms determination
Epoxy resin moisture sorption isotherms were determined gravimetrically using sorption analyzer Q5000 SA (TA instruments, New Castle, DE, USA). Samples (∼10 mg) were loaded using quartz pans and the relative humidity (RH) was automatically set between 10% and 90% (0.1–0.9 water activity (a w)) at 25, 40, and 55 °C. The testing under each temperature included three levels of zinc chloride two types of oil (sunflower and sesame). All runs were carried out in triplicates, and the average was used. The instrument monitors the RH automatically and provides the equilibrium moisture content (EMC) directly after each RH step. The EMC will be used to determine the GAB and BET parameters.
Sorption isotherm models
So as to determine the best fit corresponding to a w at the selected temperatures, GAB and BET models were applied.
The GAB model is represented by the following:

where a w is the water activity and mo is the monolayer moisture content. C and K are GAB constants derived from the following polynomial equation:
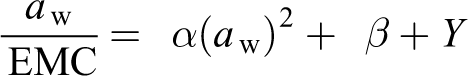
where a w is the water activity and EMC is the equilibrium moisture content. The terms α, β, and γ can be obtained from the nonlinear regression of the experimental EMC as a function of a w. Therefore, the C and K values are the result of the following set of equations:

where

The EMC can be estimated by rearranging equation (1).

where m o is the monolayer moisture content obtained from equation (1) and EMC is predicted equilibrium moisture content.
The BET model is:

After arrangement, the BET equation is as follows:

Model validation
The validation of the models (GAB and BET) was reached by fitting the data to a nonlinear regression by the Sigma Plot software version 10.0. In addition to the R 2 of the nonlinear regression, the goodness of the model fit was tested using the percentage root square error (RMS). 32

where m p is the predicted value, m e is the experimental, and N is the number of experimental data.
Isosteric heat of sorption
The IHS is calculated according to Clausius–Clapeyron equation (4). 33 IHS is a good indicator of the degree of water heat of sorption (energy), while binding to the polar sites on the surface of the material reveals the intensity of binding water vapor during sorption.

q st is the IHS (kJ mol−1 k−1), R is an universal gas constant 8.314 (kJ mol−1 K−1), a w is the water activity, T is the temperature in kelvin. Plot of ln aw versus 1/T and the slope which is equal to q st/R, therefore, q s t = −R × slope.
Results and discussion
Characteristics of the moisture sorption isotherms
The experimental moisture sorption data for VG were obtained for water activity range from 0.1 to 0.9 at 25, 40, and 55°C are shown in Figure 1. The moisture sorption isotherm of VG showed upward shape (type III isotherm). 34 At higher water activity, the increase in temperature from 25°C to 55°C led to lower EMC (Figures 1 and 2). The reason for that was the higher water vapor pressure in the VG, which accelerated the transfer of moisture from the samples to the surrounding air in the chamber of the instrument. This indicates dynamic equilibrium changes between water vapor and the absorbing surface of the material due to temperature change. This occurrence is observed for most materials rich in hydroxyl groups such as starch, some proteins, or any other polar groups located on the surface. Therefore, the implications of higher temperatures are well-known to increase microbial and enzymatic activities instigating quality deterioration because water activity increases at the same EMC. 35 The EMC of sunflower oil VG epoxy resin decreased significantly compared to the EMC of VG at the same a w (Figure 2). This could be attributed to the limited number of water binding sites due to the development of dense areas and reduced binding surface subsequent to cross-linking. It is obvious that the EMC drop is a w dependent, because the resin exhibited lower EMC at 0.6 a w and lower. Therefore, at higher than 0.6 a w, the EMC of the 1% zinc chloride samples exhibited higher EMC than that of the control. Greater levels of zinc chloride had significant effect on the reduction of EMC at a w lower than 0.5 (Figure 3). Cured cross-linked epoxy resin is a two-phase system. The network structure of cross-linked resin is not truly homogeneous, but it is a mixture of highly cross-linked regions (dense) entrenched in less cross-linked region. Because of the dense structure, highly cross-linked regions are less likely to be penetrated by water. This explains why the EMC of the VG-resin relative to VG was reduced, because cross-linking generated dense regions less penetrated with water. The remaining free volume of the resin can absorb water easier and requires higher EMC. The EMC of cross-linked sunflower oil resin material was very similar at a w < 0.5, which means that the 1% zinc chloride or less can give similar results at low a w, but at high a w, the EMC was zinc chloride dependent (Figure 3). In the same figure, the EMC increased gradually before 0.4 water activity, but at higher water activity, a sharp increase in EMC was observed, whereas gradual increase was noted for VG through the range of aw as shown in Figure 2.

Adsorption isotherm of pure VG at 25, 40, and 55°C.
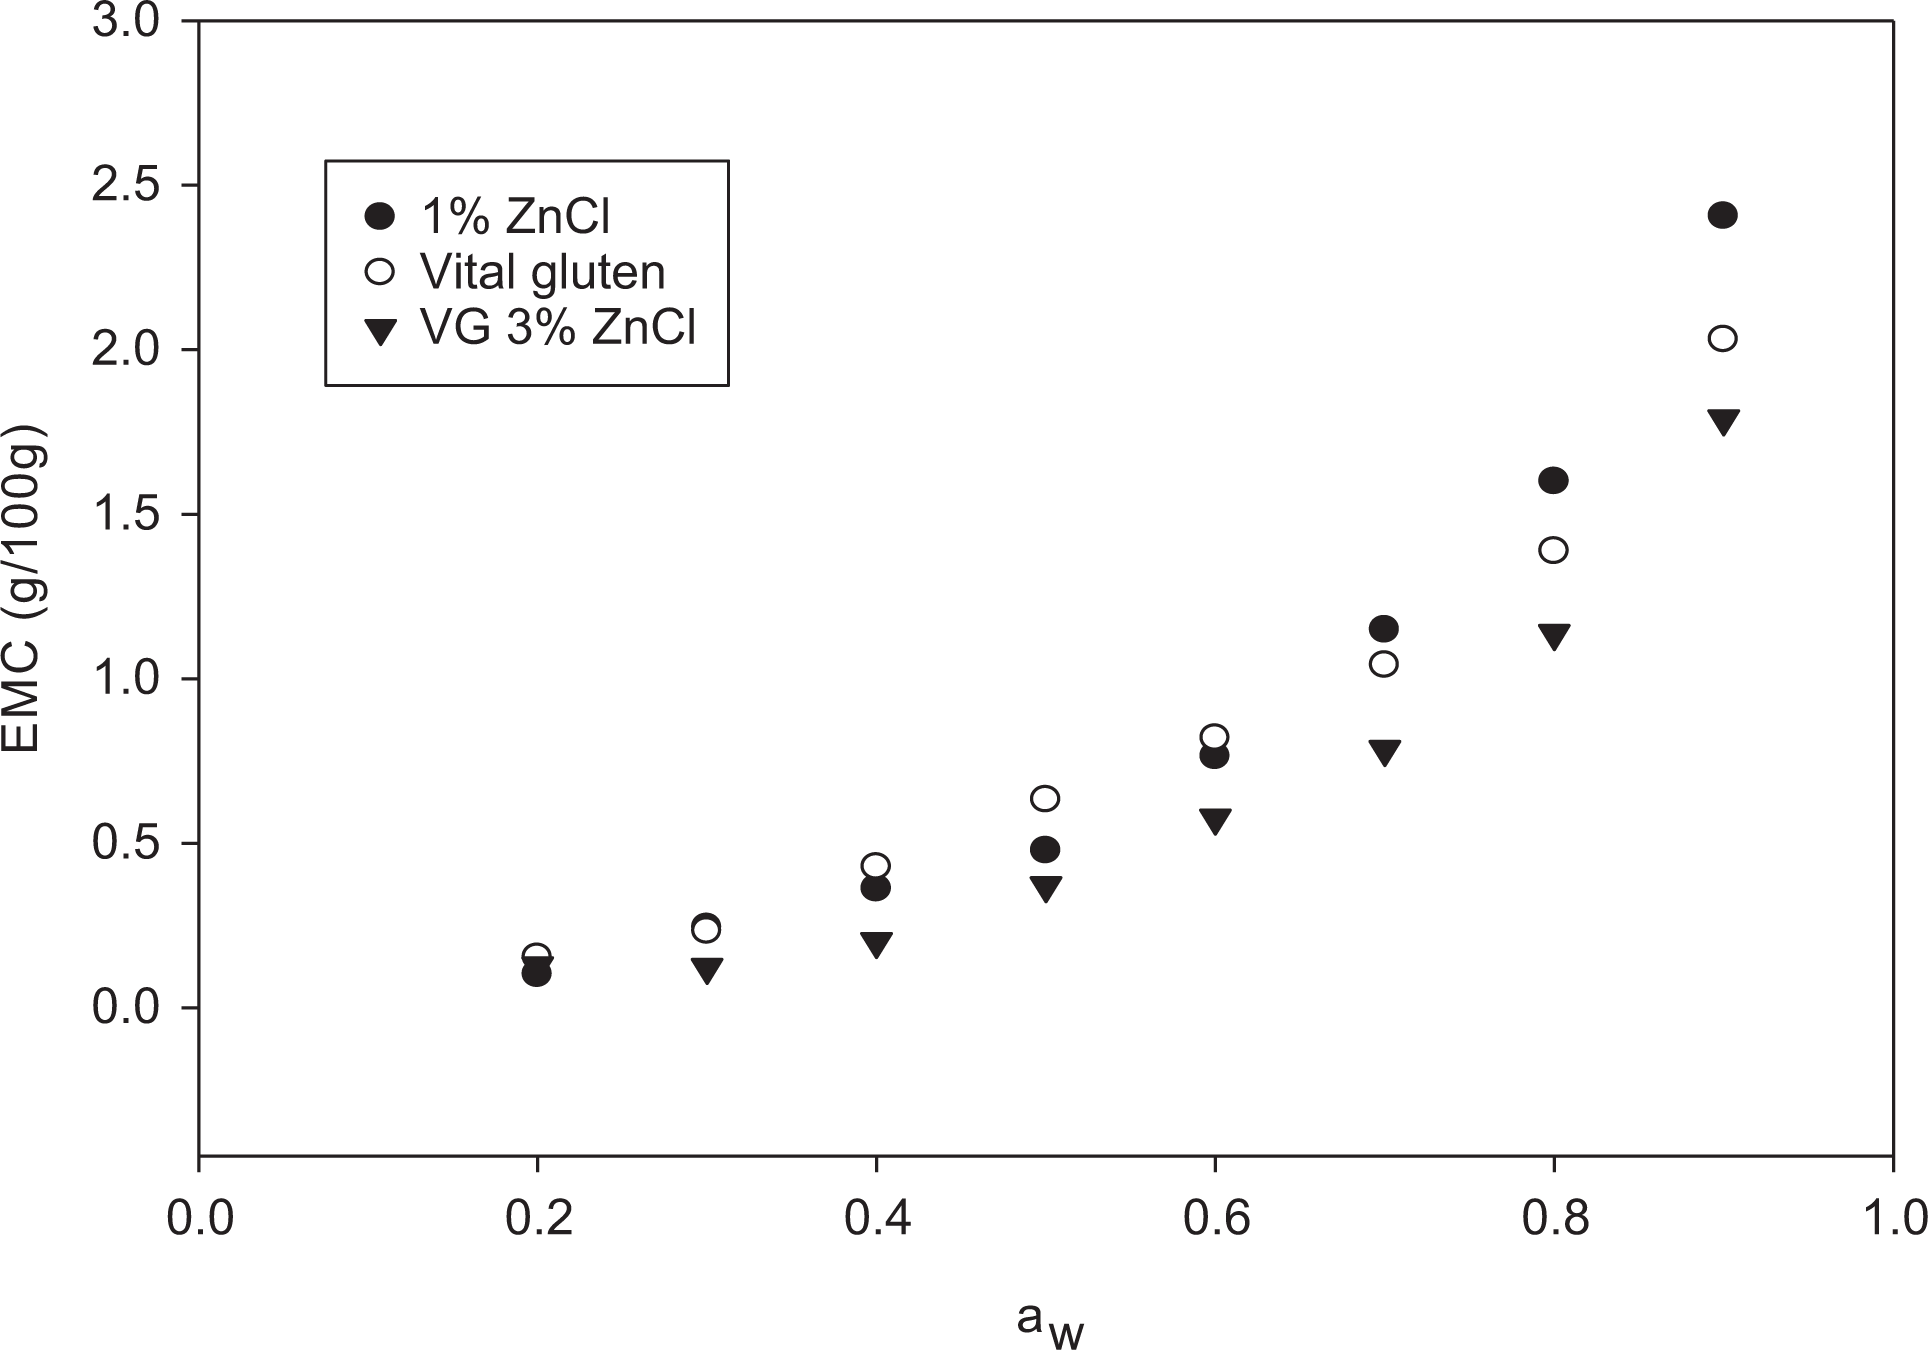
Sorption isotherms for VG sunflower oil resin prepared with 1% and 3% zinc chloride.

Sorption isotherms of VG/sunflower oil resin at 1, 2, and 3 g zinc chloride.
Sesame oil resin (SA) exhibited different sorption isotherm profiles compared to sunflower oil. SA resin showed no significant effect of zinc chloride at a w < 0.3, in addition to the different behavior of the resin compared to the VG profile (Figure 4). This behavior was not detected for the sunflower oil resin (Figure 1). Nonetheless, higher temperature seemed to reduce the EMC of the resins with little difference between 40°C and 55°C, whereas in Figure 1, the effect of the temperature was subtle and the isotherms showed lower EMC at higher temperature. This can be attributed to the difference between sunflower and sesame oils with respect to the number of oxirane rings, which propagated to the resin properties. The difference between the two oils continued when sesame resin isotherms were compared to VG isotherm (Figure 5). Higher EMC was observed for the resin at a w < 0.5 compared to the VG, whereas at a w > 0.6 resin exhibited EMC lower than VG.

Sorption isotherms of sesame oil resin prepared with 2 g at 25, 40, and 55 °C.

Sorption isotherms for VG/sesame oil resin prepared with 1 g and 2 g zinc chloride.
Modeling of moisture sorption isotherms
The experimental moisture isotherms data were fitted to GAB and BET models using nonlinear regression analysis at 25, 40, and 55°C. The GAB and BET equations allow the calculation of the monolayer moisture content (m o), which is the measure of the expected sorption property of the material. Generally, the monolayer values calculated from GAB and BET (Tables 1 and 2) were influenced by the temperature and the level of zinc chloride (ZnCl2). At higher temperatures, the m o values decreased, whereas at higher ZnCl2 content, it increased (Tables 1 and 2). Sunflower oil resin material exhibited higher m o than sesame oil at all three temperatures and 1% ZnCl2 indicating more binding sites due to low cross-linking reaction efficiency of sunflower oil resin (Tables 1 and 2), but at 3% ZnCl2 sesame oil showed higher m o values. Therefore, at low m o values, less binding sites were available on the sesame oil resin which could be due to efficient cross-linking of sesame oil resin. This can be attributed to less unsaturated fatty acids of the sunflower oil which generated limited oxirane rings during epoxydization. Oxirane rings can be considered as the limiting factor of the cross-linking reaction. Nonetheless, sesame oil resin exhibited higher m o at 3% ZnCl2 at all three temperatures. It was obvious that m o has the tendency to decrease at higher temperatures due to the reduction in the number of water binding active sites induced by temperature. 35 The prediction of m o is critical because the water beneath m o is strongly bound to the material and does not participate in any biochemical reactions. Hence, this information is important for the storage and the use of the resin material presented here because the remaining portion of the gluten that did not participate in the cross-linking process is available for moisture absorption which will cause deterioration of the resin. The cross-linking between epoxydized oil and proteins (oxirane ring and amide) leave out the remaining composition of the gluten which is rich in hydrophilic hydroxyl groups (–OH). Within the same temperature, m o values were greater at higher ZnCl2 except for sunflower oil resin at 55°C (Table 1). Usually, cross-linked materials are not homogenous which could cause variations on the size of the dense area with respect to the less dense because higher dense regions tend to reduce the mo.
GAB and BET parameters for moisture sorption isotherms for wheat vital gluten/epoxydized sunflower oil resins (m o g/100 g water, dry basis).

ZC: zinc chloride; m o: monolayer; GAB: Guggenheim Anderson-de Boer; BET: Brunauer–Emmett–Teller.
a C and K are GAB parameters related to monolayer and multilayer properties, respectively.
bRMS is the mean relative percentage deviation.
cAverage of three replicates.
GAB and BET parameters for moisture sorption isotherms for wheat VG/epoxydized sesame oil resins (m o g/100 g water, dry basis).

ZC: zinc chloride; m o: monolayer; GAB: Guggenheim Anderson-de Boer; BET: Brunauer–Emmett–Teller.
a C and K are GAB parameters related to monolayer and multilayer properties, respectively.
bRMS is the mean relative percentage deviation.
cAverage of three replicates.
The constant C is a measure of the total heat of sorption of the first layer of water vapor bound directly to the active binding sites, whereas K represents the multilayer water molecules pertaining to the bulk water rather than vapor. The C value is always positive and K is less than unity. The values of K and C presented here showed that GAB and BET are suitable for fitting the gluten epoxy resin data (Tables 1 and 2).
The goodness-of-fit of GAB and BET was verified by testing the percentage root square error of the predicted EMC, RMS 32 against the experimental isotherm data. The R 2 of the nonlinear regression of the plot of EMC as a function of water activity will also be considered in approving the model. The RSM of the GAB model for the sunflower oil resin at 25°C ranged from 0.80 to 1.64, at 40°C from 1.54 to 1.78, and at 55°C from 1.13 to 2.65, whereas BET exhibited similar RSM values compared to GAB as shown in Table 1. Sesame oil resin exhibited RMS vales higher than sunflower resin (Table 2) which could be due to the difference in the cross-linking process discussed above. Nonetheless, both resins showed values that can be considered adequate verification of the goodness of GAB and BET model fit. Both of the resins listed in Tables 1 and 2 showed differences in C and m o values which is reflected in the RMS. Usually, low RSM values are considered a good indication of the effectiveness of the GAB model for determining the water sorption isotherm of any material. Hence, the data in Tables 1 and 2 of the GAB and BET models can be used for predicting the EMC of sunflower and sesame oil resins.
Comparison between the experimental EMC, GAB, and BET isotherms was presented in Figures 6 and 7. In these figures, GAB appeared to have an extended range of application relative to BET at a w > 0.8. Each model gave good fit, where sunflower resin profile gave better fit at a w < 0.5 after which an upward swerve was observed. The sesame resin fit was better at a w > 0.6, which further signifies the difference between sunflower oil and sesame oil observed for the m o. In addition, sunflower oil resin exhibited EMC higher than sesame oil as shown by both GAB and BET (Figures 6 and 7). This sharp deviation indicates that less water vapor is absorbed on the surface than that indicated by the models. The sunflower oil resin showed gradual increase in EMC by both models; however, the EMC of sesame resin started slower before sharp increase. The sharp upward deflection in EMC for sunflower oil resin at a w > 0.6 was much lower than that of sesame resin. This observation was clear when the slope of the line up to a w > 0.6 for both resins was compared. The two models exhibited slope <4.0 for the sunflower oil and > 0.8 for sesame oil resin.

Comparison between experimental, GAB, and BET isotherms of vital gluten sunflower resin (2% zinc chloride) at 40°C.

Comparison between experimental, GAB, and BET isotherms of vital gluten sesame resin (3% zinc chloride) at 40°C.
Isosteric heat of sorption
By plotting ln a w versus 1/T using the data derived from the sorption isotherms, the data in Figure 8 showed water activity ranging from 0.044 to 0.90 for the sesame oil and sunflower oil. The slopes of these lines represent the IHS (q st) values. The maximum q st for sunflower oil resin was 95.1 kJ mol−1 at 0.2 a w and the minimum was 9.3 kJ mol−1 at 0.9 a w (Figure 9); however, sesame oil resin exhibited 70.1 kJ mol−1 maximum value at 0.044 a w and minimum as 7.5 kJ mol−1 at 0.9 a w. The data presented here showed that q st decrease with increase in moisture content (Figure 9). Therefore, the isosteric heat is strongly dependent on moisture content, where the energy necessary for water sorption was high at low EMC. Similar effects have been detected for nylon10n − 6 water absorption and for several poly(alkyl-methacrylate) materials. Soles et al. 36 suggested a model, where water transport in epoxies occurs via the free volume, allowing access to neighboring polymeric hydrogen bonding sites. The prompt increase in IHS at low moisture content is due to the existence of active binding sites on the surface of the material covered with water molecules forming monolayer. When these active sites are covered with monolayer water, they become less active generating lower heat of sorption. 37 By looking at the slopes of the descending portion of the q st (Figure 9), the decrease in q st of sesame oil resin was steeper than that of the sunflower oil, which means less absorption energy compared to sunflower oil resin. This indicates less binding sites on the sesame oil resin surface. Morsch et al. 38 described the water intake by epoxy resin is totally dependent on the degree of cross-linking where more cross-linking increased the water intake because of the increase on the void volume. The data presented here are in agreement with what Morsch et al. have indicated, because higher zinc chloride, which means more cross-linking, increased the monolayer value as shown in Tables 1 and 2.

Isosteric heat of sorption. Plot of ln a w as a function of 1/T (K−1) for gluten epoxy resin at constant moisture content.

Isosteric heat of sorption of epoxidized sesame and sunflower oils and gluten at EMC.
Conclusions
Absorption isotherms of wheat gluten/epoxydized sesame or sunflower oil resins exhibited type III isotherm. The EMC decreased with increase in temperature. The resin showed slower change in EMC with increase in water activity before 0.5 a w and after that a sharp increase was observed. Zinc chloride reduced EMC of VG at water activity <0.5. In general, more cross-linking causes increase in the free volume of the resin which can lead to more water binding sites. The mean relative percentage deviation (RMS) values indicated that GAB was more suitable to predict the isotherm at lower temperatures, while BET was better at higher temperatures. The BET appeared to have extended range of application relative to GAB, but both models provided good fit at a w < 0.6 after which an upward swerve is observed. It is concluded that wheat gluten resin must be used below 60% relative humidity. From the data presented here, it was shown that the isosteric heat decreases with increase in the amount of water absorbed which is in agreement with literature reports. In addition, the energy necessary for sorption increases at low EMC because of the availability of binding suites.
Footnotes
Declaration of conflicting interests
The author(s) declared no potential conflicts of interest with respect to the research, authorship, and/or publication of this article.
Funding
The author(s) disclosed receipt of the following financial support for the research, authorship, and/or publication of this article: This project was funded by the National Plan for Science, Technology and Innovation (MAARIFAH) (Grant No. 11- AGR-1602-02), King Abdulaziz City for Science and Technology, Kingdom of Saudi Arabia.