
Abstract
Polysiloxane with amino group as the functional side chain was prepared via equilibrium polycondensation reaction. It was modified with salicylaldehyde and then incorporated with lanthanide ions (Dy3+ and Sm3+) to obtain two luminescent functionalized polysiloxane–lanthanide composite materials. The structures and properties of products were characterized by Fourier transform infrared spectroscopy, proton nuclear magnetic resonance spectroscopy, ultraviolet–visible absorption spectroscopy, fluorescent emission spectroscopy, and thermogravimetric analysis. The results show that two kinds of lanthanide ions were all incorporated successfully with the functionalized polysiloxanes. The coordination effect exists between the nitrogen atoms on the ligand and the lanthanide ions. In addition, the green and red light emissions that are characteristic of Dy3+ and Sm3+ were achieved.
Introduction
Lanthanide complexes have many unique properties such as rich number of energy levels, long-lived excited state characteristics, and efficient strong narrow-width emission bands in the visible region. 1 –3 However, unmodified lanthanide complexes are usually not suitable for practical applications because of their poor thermostability and mechanical properties. 4 -6 The coordination of lanthanide complexes into the backbone or side chains of organic polymer hosts is a good method to solve these problems. 7 –10 Organic groups in the host could strongly absorb ultraviolet light, and then the luminescence of lanthanide complexes could be sensitized by transferring the energy of the excited state to the lanthanide ions via no radiation transition. 11 –13
Polysiloxane has been used widely in many applications because of their excellent thermal stability, flexibility, and processibility. 14 –16 The presence of amino groups in the amino polysiloxanes imparts new properties such as reactivity, surface activity, and adsorption properties. 17 –19 The polysiloxane–lanthanide complex can be prepared by introducing the fluorescent groups into the polysiloxane chain using the reactivity of the amino group. Polymer–lanthanide complexes not only have the unique optical properties of lanthanide ions but also have good mechanical properties such as easy processing formability, impact resistance, and lightweight. So the complexes are expected to become a new type of polymer luminescent materials. Although the amino groups in the aminopropyl polysiloxane and the pseudo silicon–oxygen double bond could directly coordinate with the lanthanide ions, the high energy level and desired transition energy caused weak energy level matching with lanthanide ions and low energy transfer efficiency. To solve this problem, the amino-functionalized polysiloxane–lanthanide composites were prepared by first modifying the amino polysiloxane with a carbonyl compound containing a fluorescent group and then coordinating with the lanthanide ions.
To the best of our knowledge, the synthesis of amino-functionalized polysiloxane–lanthanide composites has not yet been performed. In the present work, polysiloxane with amino groups as the functional side chain was first prepared by the equilibrium polycondensation using octamethylcyclotetrasiloxane (D4) and 3-aminopropylmethyldimethoxysilane (AMDE) as starting materials. The amino-functionalized polysiloxane was modified with salicylaldehyde to obtain a Schiff base compound containing imine structure. And then it was incorporated with lanthanide ions (Dy3+ and Sm3+), resulting in two luminescent functionalized polysiloxane–lanthanide composite materials. The products were characterized by Fourier transform infrared (FTIR) spectroscopy, proton nuclear magnetic resonance (1H-NMR) spectroscopy, ultraviolet–visible (UV-vis) absorption spectroscopy, fluorescent emission spectroscopy, and thermogravimetric analysis (TGA). The resulting polysiloxane–lanthanide composite materials have potential applications in optical or electronic fields.
Experiment
Materials
D4 (analytical reagent grade (AR)) and AMDE (AR) were purchased from Aladdin Biochemical Technology Co., Ltd (China). Potassium hydroxide (KOH) (AR), dimethylsulfoxide (DMSO) (AR), and acetic acid (AR) was commercially obtained from Sinopharm Chemical Reagent Beijing Co., Ltd (China). Tetrahydrofuran (THF) (AR) and salicylic acid (AR) were purchased from the Beijing Chemical Plant (China). THF was purified by distillation prior to use. Others were used as received.
Synthesis of polysiloxane containing aminopropyl side chain
Aminopropyl side chain (APS) could be prepared via the equilibrium polycondensation between D4 and AMDE under the catalysis of KOH. The synthetic route of APS is shown in Figure 1.

A synthetic route of APS.
To a 100-mL three-necked flask with a reflux condenser and stirrer bar, 60 g of D4, AMDE, 0.1 g of KOH, 2.0 g of deionized water, and 0.8 g of DMSO were added. The reaction mixture was heated to 80°C and stirred for 4 h under nitrogen atmosphere. Then the mixture was evaporated by a rotary vacuum evaporator at 50°C to remove water and ethanol produced during the reaction. Afterward, the reaction system was stirred at 80°C for another 6 h. In this case, the reaction will continue in the positive direction after removing water and ethanol. Subsequently, it was cooled to 50°C, and a certain amount of acetic acid was added. Finally, the low boilers produced in the reaction were distilled under reduced pressure at 140°C, yielding a transparent oily liquid. Here, low boilers refer to monomers that do not participate in the reaction, oligomers, water, and ethanol.
Synthesis of polysiloxane-containing side chain of salicylidene aminopropyl
A 8 g of APS was dissolved in 40 mL of tetrahydrofuran and then charged into a 100-mL three-necked flask with a magnetic stirrer and a spherical condenser. About 1.14 g of salicylaldehyde was added, and the reaction mixture was refluxed at 75°C under nitrogen atmosphere. The progress of the reaction was monitored by thin layer chromatography (TLC) till the raw material disappeared. The solvent was removed by a rotary vacuum evaporator, and then the resulting mixture was dried under vacuum at 50°C for 2 h to give a light yellow oily liquid, which was SAPS. The synthesis route is shown in Figure 2.
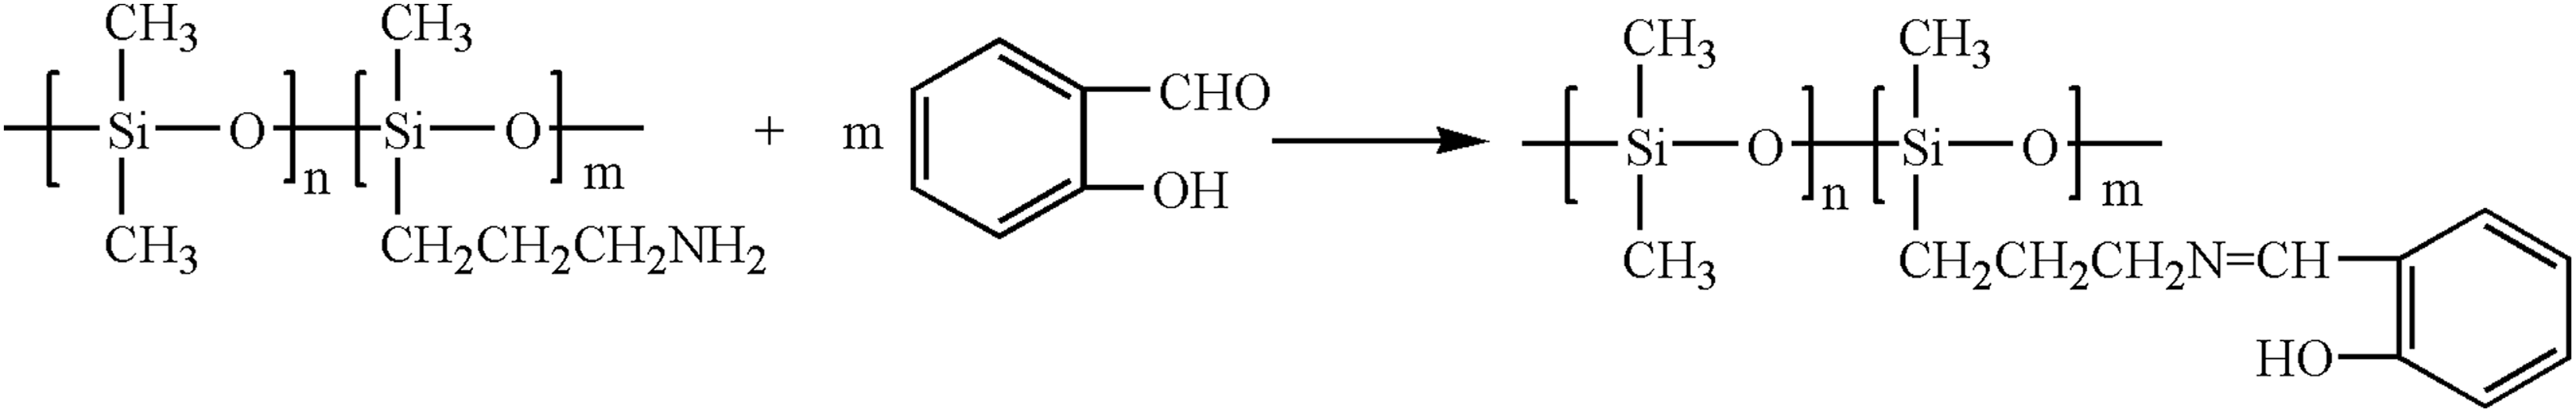
A synthesis route of SAPS.
Synthesis of SAPS-Dy and SAPS-Sm composites
In total, 20 mL of THF and 0.60 g of SAPS were slowly added into a 100-mL three-necked flask equipped with magnetic stirrer, reflux condenser, and constant pressure funnel under the stirring. After SAPS was dissolved completely, 0.09 g of Dy(NO3)3·6H2O in 20 mL of THF solution was slowly added into the mixture within 5 h by stirring at 70°C. Subsequently, the mixture was evaporated by a rotary vacuum evaporator at 50°C to remove THF and dried in a vacuum oven at 50°C for 3 h to obtain SAPS-Dy composites. SAPS-Sm composites were prepared using the same process. The synthesis route is shown in Figure 3.

The likely synthesis route of SAPS-Dy or SAPS-Sm composites.
Characterization
The structure of samples was determined by FTIR and 1H NMR. FTIR spectra were measured within the region of 4000–400 cm−1 on a Bruker VECTOR22 FTIR (Germany) apparatus with potassium bromide matrix. 1H NMR spectra were recorded on a Bruker Ultrashield 500 MHz spectrometer (Germany), using tetramethylsilane as an internal standard and deuterated chloroform as a solvent at 25°C.
The UV-vis absorption spectra and fluorescence spectra (excitation and emission) of samples were analyzed with a UV-2450 UV-visible spectrophotometer (Japan) and a PerkinElmer LS 55 spectrofluorometer (USA), respectively.
The thermal properties of samples were measured by TGA, which was carried out with a Shimadzu DTG-60 H system at 10°C min−1 under nitrogen atmosphere.
Results and discussion
FTIR spectra
Figure 4(a) to (c) shows the FTIR spectra of APS, SAPS, and SAPS-Sm, respectively. As shown in the FTIR spectrum of APS (Figure 4(a)), the absorption bands at 3356 cm−1 and 3291 cm−1 were attributed to N–H stretching vibrations. C–H stretching vibration appeared at 2968 cm−1 and 2912 cm−1. The peak at 1602 cm−1 was assigned to N–H bending vibration. The absorption bands at 1410 cm−1 and 1265 cm−1 were attributed to Si–C bending vibrations. It could be clearly seen that a strong and broad absorption peak appeared at 1098 cm−1, which was ascribed to the stretching vibration of the Si–O–Si. The vibration peak of Si–C was located at 765 cm−1.

FTIR spectra of APS (a), SAPS (b), and SAPS-Dy (c).
FTIR spectrum of SAPS is shown in Figure 4(b). Compared with that of APS, the N–H stretching and bending vibration in the FTIR spectrum disappeared and a weak absorption peak appeared at 3058 cm−1, which was assigned to C–H bending vibration in the benzene ring. A strong absorption peak at 1598 cm−1 and a plurality of absorption peaks at 1548–1345 cm−1 belonged to the stretching vibration of C=N and the skeleton vibration of the benzene ring, respectively. All of the above changes indicated that C=O of salicylaldehyde had a condensation reaction with –NH2 of APS, forming a C=N functional group.
From the FTIR spectrum of SAPS-Dy (Figure 4(c)), we could see that the stretching vibration peak of C=N were blueshifted from 1598 cm−1 to 1623 cm−1. And the absorption peak attributed to skeleton vibration of the benzene ring also underwent a blueshift. These indicated that the nitrogen atom in the C=N functional group was coordinated with the lanthanide ion. The reason for the blueshift may be that the delocalization effect between CH=N and benzene ring was destroyed, which strengthened the nature of double bonds and then caused the blueshift. 20 The new absorption peak appearing at 1381 and 576 cm−1 were assigned to the stretching vibration of NO3− and Sm-N coordination bond, respectively. 21,22 The stretching vibration of the Si–O–Si appeared at 1097 cm−1, which was consistent with that in Figure 4(a) and (b). The same results were observed in the FTIR spectrum of SAPS-Sm.
1H-NMR spectroscopy
1H-NMR spectroscopy results of APS and SAPS are presented in Figure 5(a) and (b), respectively. As shown in Figure 5(a) that the absorption peaks at 0.07 and 0.52 ppm are, respectively, ascribed to proton signals of methyl and methylene attached to silicon. The peak at 1.48 ppm is attributed to the hydrogen of the intermediate methylene group of the aminopropyl group. The chemical shift of the hydrogen in the methylene group connected to the nitrogen atom appears at 2.67 ppm. This reason is that the nitrogen atom has a large electronegativity and the methylene hydrogen is less shielded by the surrounding environment. Therefore, the chemical shift of the intermediate hydrogen is larger than that of the other two methylene groups.
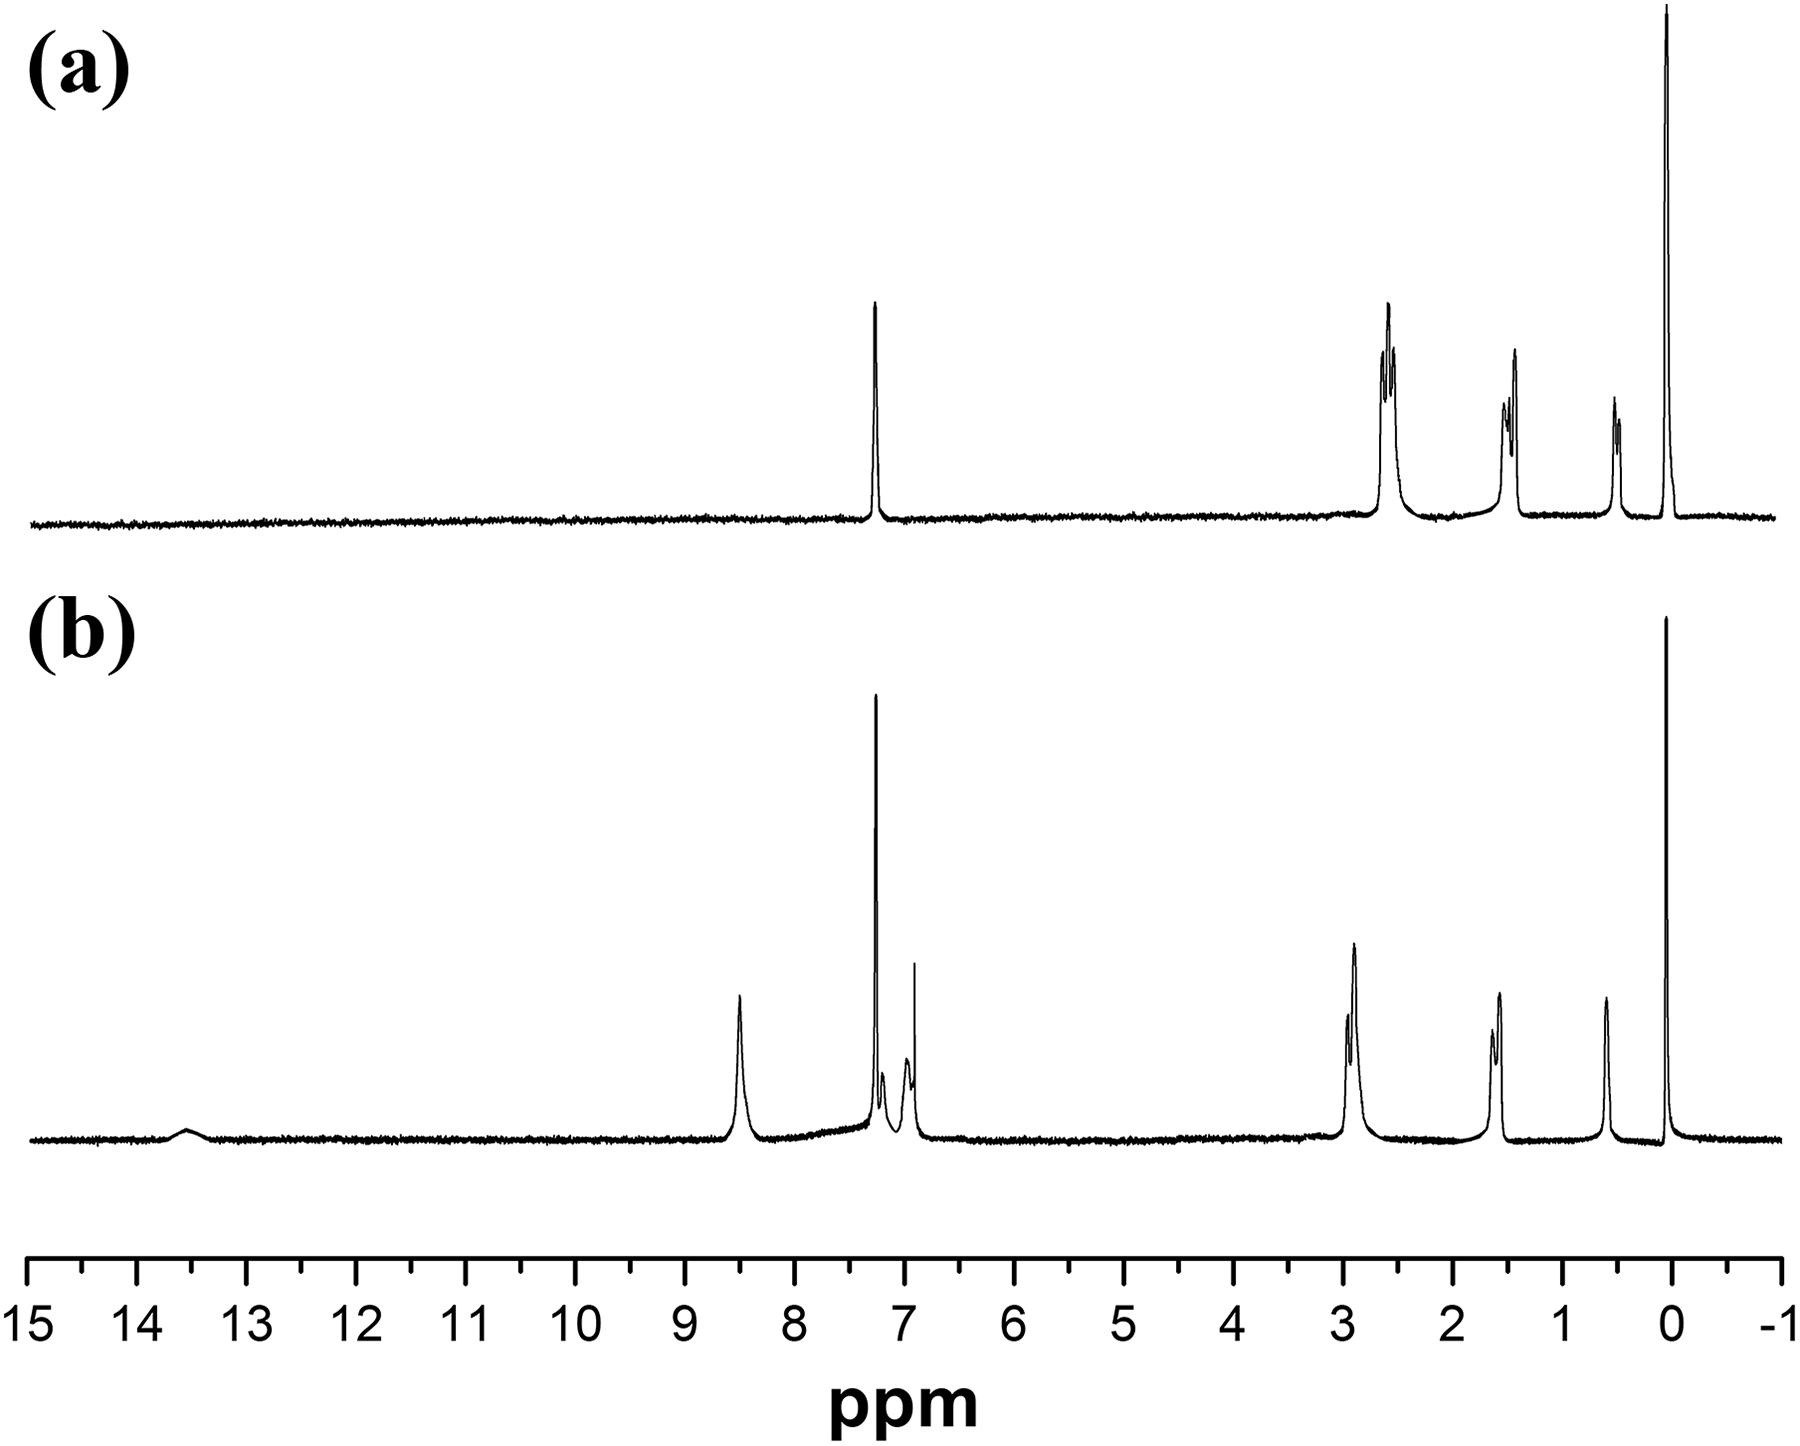
1H-NMR spectra of APS (a) and SAPS (b).
As shown in Figure 5(b), the single peak appearing at 8.26 and 13.52 ppm are attributed to the –CH=N– and –OH attached to the benzene ring of the SAPS, respectively. The plurality peaks appearing at approximately 6.77–7.39 ppm are chemical shift of the protons on the benzene ring.
UV-vis absorption spectra
UV spectra of SAPS, SAPS-Dy and SAPS-Sm were determined in a 10−5 mol L−1 HTF solution, and the anhydrous HTF was a reference with a measurement range of 200–800 nm. Figure 6(a) to (c) shows the UV spectra of SAPS, SAPS-Dy, and SAPS-Sm, respectively.

UV spectra of SAPS (a), SAPS-Dy (b), and SAPS-Sm (c).
It was found from the three curves that the well-defined absorption peaks located at 227 and 252 nm were attributed, respectively, to E2 and B bands of benzene ring, both of which were the typical absorption bands of benzene ring caused by π–π* transition. Besides, there was a weaker and broader absorption band at 311–314 nm, which was the π–π* transition of the C=N group. However, new weaker and broader absorption bands appeared at about 396 nm in both UV spectra of SAPS-Dy (Figure 6(b)) and SAPS-Sm (Figure 6(c)). These new absorption bands may be related to the n–π* transition of lone pair electrons on the nitrogen atom of the C=N group or the charge transfer transition from the ligand SAPS to the lanthanide ions because of the coordination.
Fluorescence spectra
The fluorescence spectra of SAPS, SAPS-Dy, and SAPS-Sm are shown in Figure 7(a) to (c), respectively. After monitoring the excitations at specific wavelengths, the aromatic π–π*/n–π* transitions bands (range: 300–400 nm) were observed. So the selected excitation wavelengths were 295, 298, and 270 nm for SAPS, SAPS-Dy, and SAPS-Sm, respectively.

Excitation and emission spectra of ligand SAPS (a), SAPS-Dy (b), and SAPS-Sm (c).
As shown in Figure 7(a), a broad emission peak of SAPS was found around 376 nm which was associated with characteristic emission of the organic groups. It could be found from the emission spectrum of SAPS-Dy (Figure 7(b)), the narrow width emission bands appearing at 482 and 569 nm were assigned to 4F9/2 → 6H15/2 and 4F9/2 → 6H13/2, which were related to the f–f transitions from the higher energy level of Dy3+ to the different lower levels. 23 The stronger emission peak, 4F9/2 → 6H13/2 transition (569 nm), was located in the visible region of green light. Therefore, the complex SAPS-Dy emitted green fluorescence under the ultraviolet light. Figure 7(c) shows the emission spectrum of SAPS-Sm, which presents a three-peak emission. Red emission bands were observed at 565, 610, and 648 nm, which are attributed to the 4G5/2 → 6H5/2, 4G5/2 → 6H7/2, and 4G5/2 → 6H9/2 transitions, respectively. These were related to the transition between the different levels of Sm3+.
Thermal properties
TGA was employed to evaluate the thermal properties of the samples. All the samples were heated under nitorgen atmosphere from room temperature to 700°C at a scan rate of 10°C min−1. Figure 8 gives the TGA traces of APS, SAPS, SAPS-Dy, and SAPS-Sm. It was easy to see that all of the samples presented the similar change trends in their weight loss. There were two main thermal degradation stages in all of the TGA curves. These two weight thermal degradation stages may be attributed to the degradation of amido groups in side chains and the degradation of the main framework (Si–O and Si–C bonds) in polysiloxanes, respectively. 24 Thermal stabilities of the samples were determined from the temperature at 5% weight loss, which was defined as the onset degradation temperature. 25

TGA curves of APS (a), SAPS (b), SAPS-Dy (c), and SAPS-Sm (d).
In the TGA curve of APS (Figure 8(a)), the onset decomposition temperature of APS was 200°C. When the ligand SAPS formed, the large group-containing phenyl group was introduced. This increased the steric hindrance and weakened the backbite reaction. Therefore, the onset thermal decomposition temperature of the ligand appearing at 232°C (Figure 8(b)) was higher than that of APS. From Figure 8(c) and (d), we could find that the clear mass loss processes of SAPS-Dy and SAPS-Sm start at temperature of about 280°C, which shifted to a higher value compared with that of SAPS. This indicated that the addition of lanthanide ions (Dy3+ and Sm3+) significantly improved the thermal stability of composites.
Conclusions
Two kinds of functionalized polysiloxane–lanthanide composite materials (SAPS-Dy and SAPS-Sm) were prepared in this article. The structures and properties of products were characterized by FTIR spectra, 1H-NMR spectra, UV-vis absorption spectra, fluorescent emission spectra, and TGA. It was confirmed by infrared spectroscopy that the nitrogen atoms in the ligand were coordinated with the lanthanide ions. Green and red narrow-width luminescence have been observed. In addition, the resulting SAPS-Dy and SAPS-Sm composite materials had high thermal stability. It is predicted that these functionalized polysiloxane–lanthanide composite materials would attract interests for their utilizations in optical or electronic applications.
Footnotes
Declaration of conflicting interests
The author(s) declared no potential conflicts of interest with respect to the research, authorship, and/or publication of this article.
Funding
The author(s) disclosed receipt of the following financial support for the research, authorship, and/or publication of this article: This research was financially supported by Hebei Province Science and Technology Support Program (16211234), Tangshan Science and Technology Bureau (18130227a) and Tangshan Normal University (2016B02).