
Abstract
This article presents a feasibility study where fibre-reinforced structural elements are assembled into long slender columns using adhesive bonding. The columns are intended to be part of an externally guyed high-voltage transmission tower where they are subjected to a combination of compressive and transverse loads. The article has shown that 25-m long poles can be made with small tolerances in both angularity and concentricity. Previous published scientific work on buckling of composite columns was applied to predict the behaviour of the pole as it was being loaded in compression to 1200 kN or within 5% of its critical load in a bespoke horizontal test jig. The confidence in the material, the structural elements, the analysis method and the quality of the test equipment has shown that there is a potential in further optimization of the structure that will ultimately be a part of a high-voltage composite tower.
Keywords
Introduction
Fibre-reinforced polymer composite materials (FRP) are being increasingly used in various engineering structural applications. The reason for this is a combination of attractive properties like high strength, low weight, good corrosion resistance and, in general, good weather resistance. One well-known application is the distribution grid where glass fibre composite poles have replaced aged wood poles and in new applications where modular systems offer large flexibility, fast installation and low maintenance. In Canada, transmission towers for 132 kV lines have been in use since 1995. However, the use of glass fibre–reinforced materials (GRP) in much larger high-voltage transmission towers is less studied, although there are some recent works on this topic.
Li et al. 1 compared different composite materials and the performance of the glass fibre–reinforced polyurethane was found to be superior to the other reinforced resin systems due to better environmental and ageing resistance as well as acid and alkaline corrosion resistance. Towers for a 110 kV line with a nominal height of 18 m were studied.
Various tower designs with single or double poles were made and subjected to different load conditions. Even though the towers passed all mechanical tests, the deflections under certain operation conditions needed further verification. Selvaraj et al. 2 studied the performance of a 66 kV overhead transmission line tower with a total height of 16.6 m using composite materials. The tower was made from pinned pultruded truss sections joined by steel plates and fittings. The composite tower reduced the weight and height to a comparable steel lattice tower by 56% and 16%, respectively.
Some towers for a 226 kV line in the United States were made from glass fibre–reinforced vinyl ester resin pultruded composite members with only two cross sections. 3 –5,6 These towers utilized a special snap-together principle (referred to as fir tree) where neither adhesives nor mechanical fasteners were needed. With the use of three different joint types, it was calculated that a 26-m high lattice tower could be assembled in less than 72 man hours, down from 400 for a conventional tower of similar size. The published weight was claimed to be one-third of a comparable 26-m height steel lattice tower and the tower accepted loads above the failure load of the steel version. Structural analysis using several failure criteria was investigated. Good agreement between tests and analysis showed that failure analysis of the tower could be carried out with confidence.
In Norway, 420 kV transmission towers are often placed in remote areas not easily accessible from roads able to accept heavy vehicles. Hence, helicopters are used to lift subassemblies of traditionally built steel truss from an assembly site to the erection site. The cost of such transportation is high and safety of the workers could be improved if the number of lifts were reduced. Furthermore, the weather window where such operations can be carried out efficiently is not overly large, putting even more pressure on the time required for foundation work, subassembly, transportation and erection of the tower. Thus, a tower with as low weight as possible requiring a much lower number of helicopter lifts and being able to accept lightweight foundations is of high interest. One of the 420 kV concepts being studied by Statnett in Norway is an externally guyed tower with two main legs, a lightweight cross-arm and earth wires carried by a spire. An example of such a prototype tower is shown in Figure 1.

Prototype of externally guyed tower utilizing composite materials in the tubular legs and the cross-arm.
Purpose of this article
The motivation for the present study and the basis for this article were to design and dimension a rig for testing and verification of a full-scale tower leg subjected to the dimensioning load case with the leg tested horizontally. This is a load case where the tower is loaded with heavy ice loads on the conductors resulting in compression loads in combination with high wind loads acting on the legs. Thus, the test jig and ancillary equipment should transfer high axial compressive loads, uniformly distributed loads in the transverse direction to the test object and reflecting the real boundary conditions. Furthermore, the test jig should be built with such accuracy that theoretical study of different leg designs including the effect of geometrical imperfections on the buckling resistance could be verified with experimental testing and released for tower design. Papers presenting bespoke full-scale test equipment in detail, and results from testing of large composite structural elements are rarely found in the literature.
To document the behaviour of the test jig and to serve as a technology demonstrator for a transmission tower leg, it was decided to develop a composite leg design using readily available glass fibre–reinforced tubular elements in the market that could fulfil the electrical and structural specifications. Extensive instrumentation would allow us to record and compare observed behaviour with predictions of critical buckling loads using well-proven analytical methods originally studied for pultruded composite material columns.
Design, fabrication and instrumentation of horizontal test jig
A prerequisite for the design of the test jig was the ability to load the leg with more than 1200 kN in compression and to transmit this force to the floor in the test hall via the steel lugs attached to reinforcements embedded in the concrete floor. The facility where the experiments were carried out was previously used for testing and commissioning of offshore equipment and well-suited for this purpose. The dimensioning load case for the tower leg which the jig was made to handle is presented in Figure 2.

Dimensioning load case and boundary conditions for one leg in an externally guyed transmission tower.
It was initially decided to focus on a 25-m long leg which is attached to the tower foundation and the cross-arm in a manner which greatly reduces the possibility to transfer bending moments, that is, the boundaries could be taken as pinned connections. The vertical compressive load, the transverse wind load and the boundary conditions are shown in Figure 2.
The compressive force with a return period of 150 years was estimated to be 800 kN and the transverse wind component with a return period of 500 years was 30 ms−1.For a leg consisting of a hollow cylinder with an external diameter of 920 mm, the wind action represents a constant linear loading of 484 N m−1.
Steel structures
All steel structures were designed according to Eurocode 1993 using standard steel box sections, mainly 200 × 200 mm. The structure was made in such a way that the horizontal axis of the test object was placed 1.5 m above the floor which means that the maximum transverse displacement during the testing of, for example, a 0.9-m diameter leg would be 1.6 times its diameter.
The dimensioning loads were as follows: 880 kN axial compressive loading; 90 kN in plane loading; 28 kN acting at an angle of 1.8°; and Weight of the composite test object assumed to be maximum of 2000 kg.
The structures were also cleared for up to 1200 kN of axial load with a much smaller in plane loading. The calculated axial displacements of the attachment of the composite test object were 9.3 mm at the front and rear. Both jigs are presented in Figure 3. The principal dimensions of these are given in Figures 4 and 5.

Front (right) and rear steel attachment jigs for test object (RSM Contract AS).

Principal dimensions of rear-welded steel structure for attachment of load cell (rear structure).
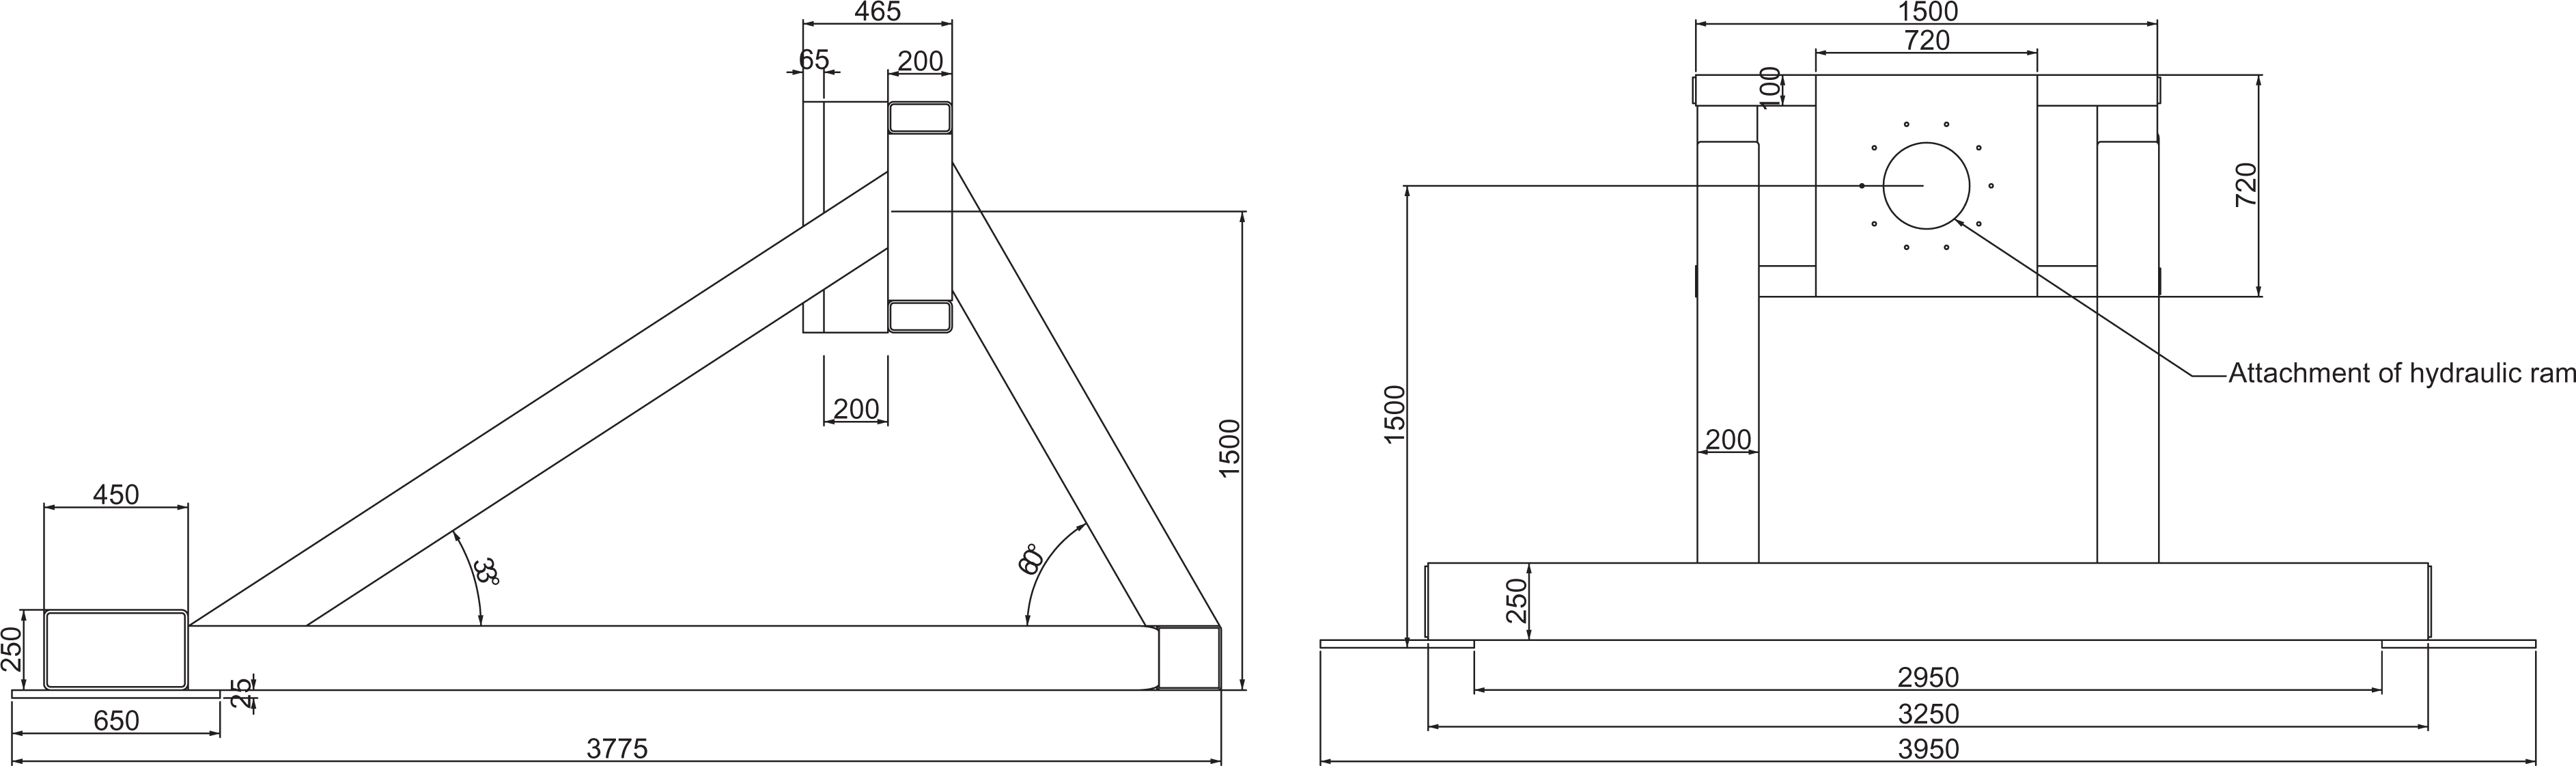
Principal dimensions of front-welded steel structure for attachment of hydraulic ram (front structure).
The front- and rear-welded structures were bolted to the floor and spacers were used to ensure that both concentricity and angularity of the attachment plates for the hydraulic ram and the load cell were as good as possible.
Ancillary equipment
To ensure pinned boundary conditions, two half-bearings of the type GE60-AW from INA were bolted to the load cell and the end of the hydraulic ram. The other ends of the bearings were bolted to the test object. The diameter to the centre of the bearing surface is 108 mm, the static axial load rating is 3680 kN and the maximum rotation angle is 7°. Care was taken in choosing the bearing and attaching it to the steel structure and the test specimen as friction in bearings has been reported to restrict rotations and delay the buckling phenomenon. 7 The hydraulic ram with a maximum capacity of 1200 kN was operated manually. Throttling the oil flow and monitoring the axial displacement versus time graph, a constant displacement of the ram was obtained after some practice. However, in some of the experiments, when the test objects started to exhibit Euler buckling, the speed was lowered.
Instrumentation
The design of the instrumentation system was such that the test specimen could be easily rotated once it was installed in the test jig without much work to disconnect and reconnect the sensors. The full-scale specimens were instrumented with Celesco SP1 string potentiometers where the string was attached to bonded brackets on the pipe and the sensor housing attached to the floor. Test data were used to check analytical predictions if the boundary conditions confirmed that pinned ends could be used in the finite element (FE) analysis with good approximation. Two displacement sensors were used in the axial direction to measure the effective length reduction of the tube. The attachment of these sensors was not on the neutral axis of the specimen. Large rotations were expected; hence, the slope of the deformed shape was calculated using the vertical displacement from sensor Y1 and used to correct the X1 and X2 reading, assuming a symmetrical deformed shape. The attachment positions are shown in Figure 6.

Dimensions of full-scale specimen and location of sensors. Note: scale is not correct. All dimensions are in millimetre.
Three sensors were connected to the sleeve at mid-span to check for twisting as well as sideways displacement (along z-axis). One sensor (Y5) was attached symmetrically with respect to mid-span to check whether the deflected shape was symmetrical about mid-span. The positions of all sensors are presented in Figures 6 and 7. The same sensors have been used in similar experiments in the literature. 8

Location of displacement sensors.
Four strain gauge rosettes were bonded to the outer surface approximately one diameter (0.9 m) from mid-span spaced 90° around the circumference. The strain gauges were of the type 1-LY11-10/120 with a 10-mm long active grid from Hottinger Baldwin Messtechnic (HBM). The grid was oriented in the axial (x-direction) and the hoop direction to enable the calculations of axial E-modulus, degree of bending as well as ovality. The gauges were zeroed when the specimen was installed in the rig and not re-zeroed between each test run. Hence, the strain gage reading had to be corrected for the effect of gravity and initial axial load to keep the specimen in between the bearings after installation. Rotating the tube 180° back and forth in the jig when subjected to an axial load of 35–40 kN showed that the readings on top and bottom were fully symmetric and that the reading from the axial gages at the 3 and 9 o’clock positions remained close to zero. Hence, the effect of varying eccentricity could be registered on the axial strain readings after each cylinder rotation during loading. Rotating the specimen was easily accomplished by one man without using any equipment, indicating low friction in the two spherical bearings.
HBM RTN 100-t load cell was used. One half of the GE 6-AW axial bearing was attached to the load cell. All sensors were connected to HBM Quantum X amplifiers and data were logged at 10 Hz using the HBM Catman Easy software (4.2.2.14).
Composite material and specimen production
Prior to the production of the full-scale specimens, the glass fibre material used in the tubular part was tested on coupon level for input to FE modelling of the complete leg and to predict transmission tower behaviour subjected to all load cases.
Material and laminate mechanical properties
The material in the tubes and the sleeves was an E-glass fibre–reinforced unsaturated terephthalic polyester resin made using the continuous filament winding process by Amiblu. The mechanical properties of the tube wall were tested by the manufacturer and are listed in Table 1. The layup was symmetric built up from plies of continuous/semi-continuous glass fibre rowing with a thin layer of randomly oriented fibres. The thickness in the inner and outer hoop layers was with 0.9 and 8.8 mm in the centre oriented close to the axial direction, that is, a total wall thickness of 10.6 mm. The in-plane shear modulus Glt was not measured but experience with this laminate as well as a micromechanical analysis yielded a value of 3.7 GPa.
Tube laminate mechanical properties from coupon tests.
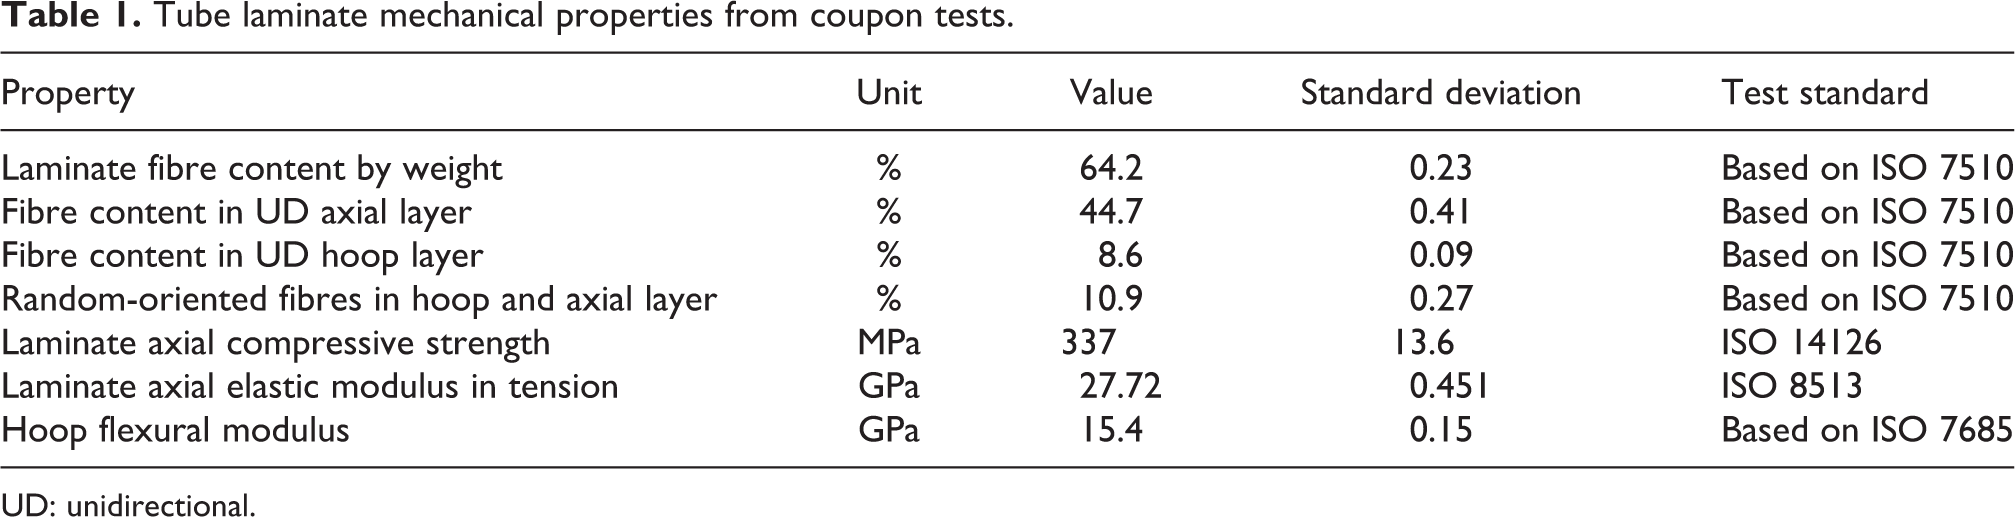
UD: unidirectional.
Full-scale specimens
Dimensions of the full-scale specimen are shown in Figures 6 and 7 with location of the different strain gauges and displacement sensors. Two specimens using the same materials and methods were made. These were labelled A and B. The specimens consisted of the following items: Two tubes with an internal diameter of 0.9 m and an average wall thickness of 10.6 mm and a linear weight of 52.1 kg m−1. The diameter-to-thickness ratio D/t of the tube was 86. Radius of gyration rg = 0.322 m and geometrical slenderness ratio λ = L/rg = 78. A centrally placed sleeve with a length of 0.6 m, internal diameter approximately 0.923 m and a wall thickness of 18 mm. The sleeve was made from the same material and with the same fibre layup as the long tubes. The internal diameter of the sleeve was increased slightly by turning to create space for a 2-mm thick bondline. Two end cones made from several parts of GRP laminated together by hand, overlapping the tube ends by 0.20 m. These parts were only made for the experiment to transfer the axial load into the specimen at the hydraulic ram end and from it at the opposite end to the load cell.
Efforts were made to keep the specimens straight during assembly avoiding excessive eccentric loadings in both ends. The effect of such loadings has been studied in detail by Mottram et al. 9 where eccentricities at both ends were used to study uniform single-curvature bending and uniform double curvature bending. However, the eccentricities expected to be present in the tubes in this work were very small compared to those used in their study.
The bonding operations for the end cones and for the central sleeve were the same. Holes were made in the sleeve at the bottom and at the sides and at the top for adhesive injection and venting. The tubes were inserted into the sleeve with a sealant on the ends. Concentricity was ensured using spacers. Then, the same sealant was used to seal the end of the gaps between the sleeve and the tubes. After the sealant had cured, Araldite 2031-toughened epoxy adhesive was injected through holes into the concentric gap between the parts staring at the bottom. Once the adhesive reached the check holes in the middle of the tubes, the bottom holes were plugged and further injection was made through the check holes. In this way, the whole gap was filled in a controlled manner with good bondline thickness control and filling. Backlight was used to follow the flow front. After bonding, the used volume of adhesive was checked with the theoretical volume of the gap as a quality control. The effective length of the specimens was 25.0 m with all parts bonded.
After curing, the distance from a string to the surface was measured from mid-span towards each end for specimen A, while it was supported on rollers. Then the tube was rotated 90° and the measurements repeated. The results are shown in Figure 8. For the tube axis laterally, the measured maximum eccentricity was 2 mm, which was less than L/10,000. However, when the tube was rotated 90°, it became evident that one end cone was bonded at an angle resulting in a non-concentric loading of 4 mm at the load-cell end and close to 10 mm at the hydraulic ram end. The eccentricity was still less than L/1000 but it would affect the bending from start of loading. 10 These numbers can be compared to the requirements for straightness for closed cross-section pultruded shapes as given in the standards EN 13706-2 and ASTM D3917-2015. The requirements are 0.0005·L2 and L/250, that is, 312 and 100 mm, respectively.
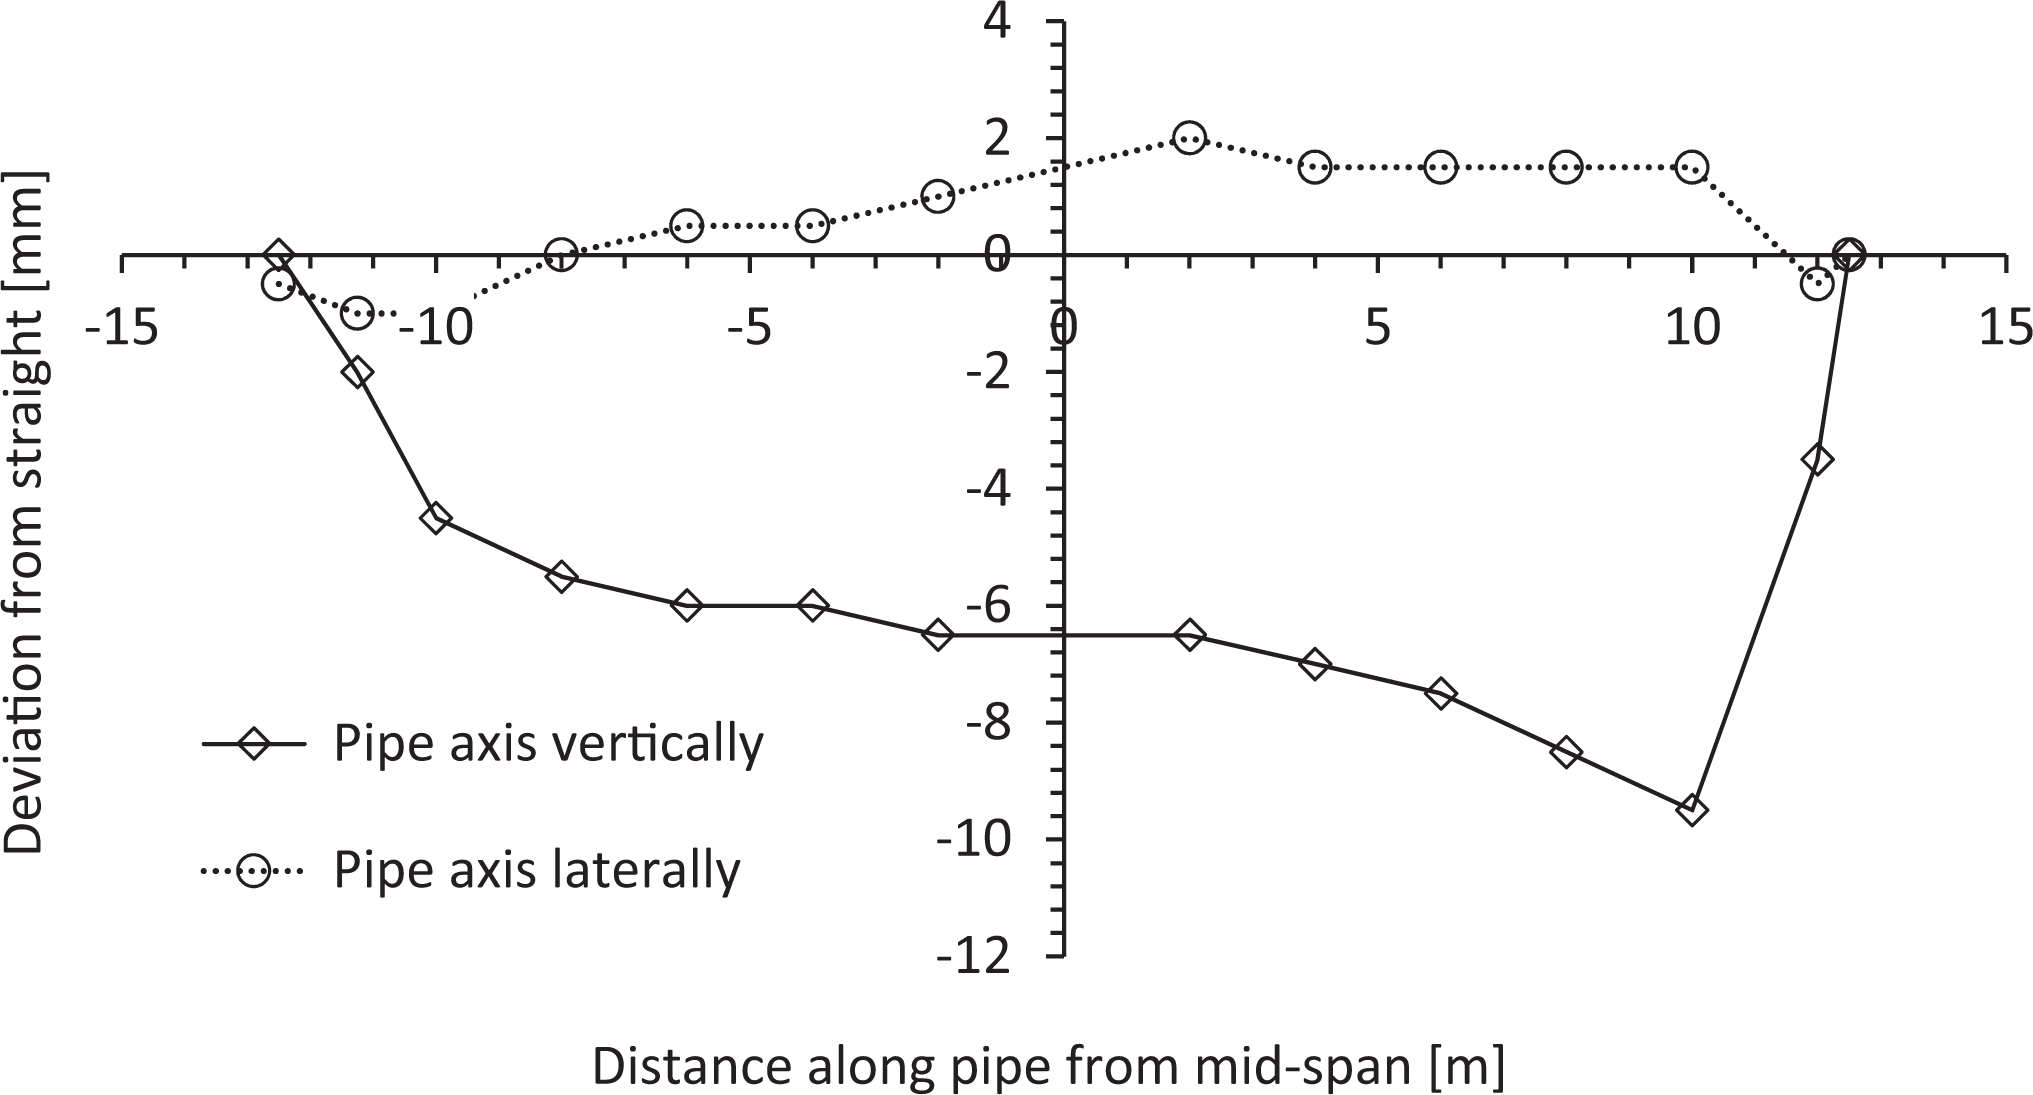
Measurement of straightness of specimen A.
The eccentricity of specimen B was also checked when it was supported on rollers approximately 5 m from each end. The straightness laterally was measured from end to end when the tube was rotated to four positions (0, 90, 180 and 270°). Maximum deviation was not more than 1 mm. The end cone concentricity was measured at the same time and was 2.5 mm at the hydraulic cylinder end and 1.5 mm at the load-cell end. Hence, specimen B was taken as practically concentric and straight.
The out-of-straightness of the tube would mean that the initial deflection would be different at different angular positions. Since the concentricity and angularity of the test jig were checked carefully, by rotating the specimen 180°, the effect of the measured deviation from straight and non-concentricity on the recorded mid-span deflection versus load could be established.
The assembled specimen is presented in Figure 9. The complete weight of the finished test specimen was 1620 kg where the end cones together weighed 320 kg. The end cones were not optimized with respect to weight as their sole role in these experiments was to transmit the load from the bearing to the tube and vice versa. The linear weight of the complete leg represents an average gravity loading of 511 N m−1 length. Using classical beam theory for a uniformly loaded beam with pinned ends, the initial deflection due to the gravity loading was estimated to 31.9 mm. A mid-span deflection of 32 mm was measured for specimen A installed in the test jig when an axial preload of 38 kN was applied to keep it in place between the bearings.

The two tubular GRP specimens, one being installed in the jig.
Axial compressive loading of column: Analytical solutions
Axial compressive loading of composite columns with varying slenderness ratio λ(λ = Le/rg) where Le is the effective length and rg is the radius of gyration of the cross section has been a subject for many studies. Most of these studies discuss the encountered failure modes in pultruded fibre-reinforced plastic beams and columns. For long columns, global or Euler buckling is the most likely failure mode, whereas for short columns local instability occurs first resulting in either large transverse deflections and global buckling or local material failure. The Euler buckling equation is given by

where Ea is the material elastic modulus and I is the moment of inertia of the cross section. The accuracy of this equation can be improved if the material elastic modulus is replaced by the axial compressive modulus of the material or even better and if the modulus can be measured directly from the initial linear portion of the stress–strain curve of the specimen when it is subjected to the compressive load. Zureick et al., 11 Scott et al. 12 and Yoon et al. 13 showed that the Euler equation can be used to provide a good estimate of the critical buckling load of primarily unidirectionally reinforced composite slender columns subjected to an axial loading. However, for composites with a high ratio of Ea/Glt, where Glt is the in-plane shear modulus of laminate, Zureick and Scott 14 proposed to use a modified version of equation (1)

where ns is a shear parameter for different cross sections and Ag is the gross cross section area. For a circular cross section, the shear parameter is 0.9. Due to the large cross section, relatively high in-plane shear modulus and a modest Ea/Glt ratio, Fc was in the present case not expected to be much different to FE.
Barbero and Raftoyiannis 15 and Barbero and Tomblin 16–18 applied analytical methods to predict local buckling modes under different loadings and experimental test programmes were conducted to verify modes. The structural members were mostly thin-walled I-beams. They also presented a design methodology for fibre-reinforced columns based on interaction between local and global buckling behaviour for a given cross section or family of similar cross sections. An interaction parameter was used to take imperfections (e.g. material variations) into consideration. Based on this, the overall buckling envelope was found which was proven to be valid for any I-beam pultruded cross section if the bending stiffness, the local buckling load and the interaction constant are known. Seangatith and Sriboonlue 19 also studied axially loaded glass fibre–reinforced pultruded profiles with different cross sections. Box sections failed in two different modes: short columns by material compressive strength failure and local buckling whereas the long columns failed in flexural buckling. The ultimate flexural buckling stress was found to be in good agreement with Euler’s flexural buckling equation σu,Euler = Π2 E/λ2, where E is the flexural modulus of elasticity.
Tomblin and Barbero 17 studied the effect of eccentricity as well as other imperfections on the long- and short-column critical load. The experimental curves for a column with initial imperfections are presented in Figure 10. Southwell’s method developed for global or Euler buckling was used in analysis of local buckling. The equation describing the deflection of a column with a bending stiffness D subjected to an axial load F with an initial imperfection w0 is given by

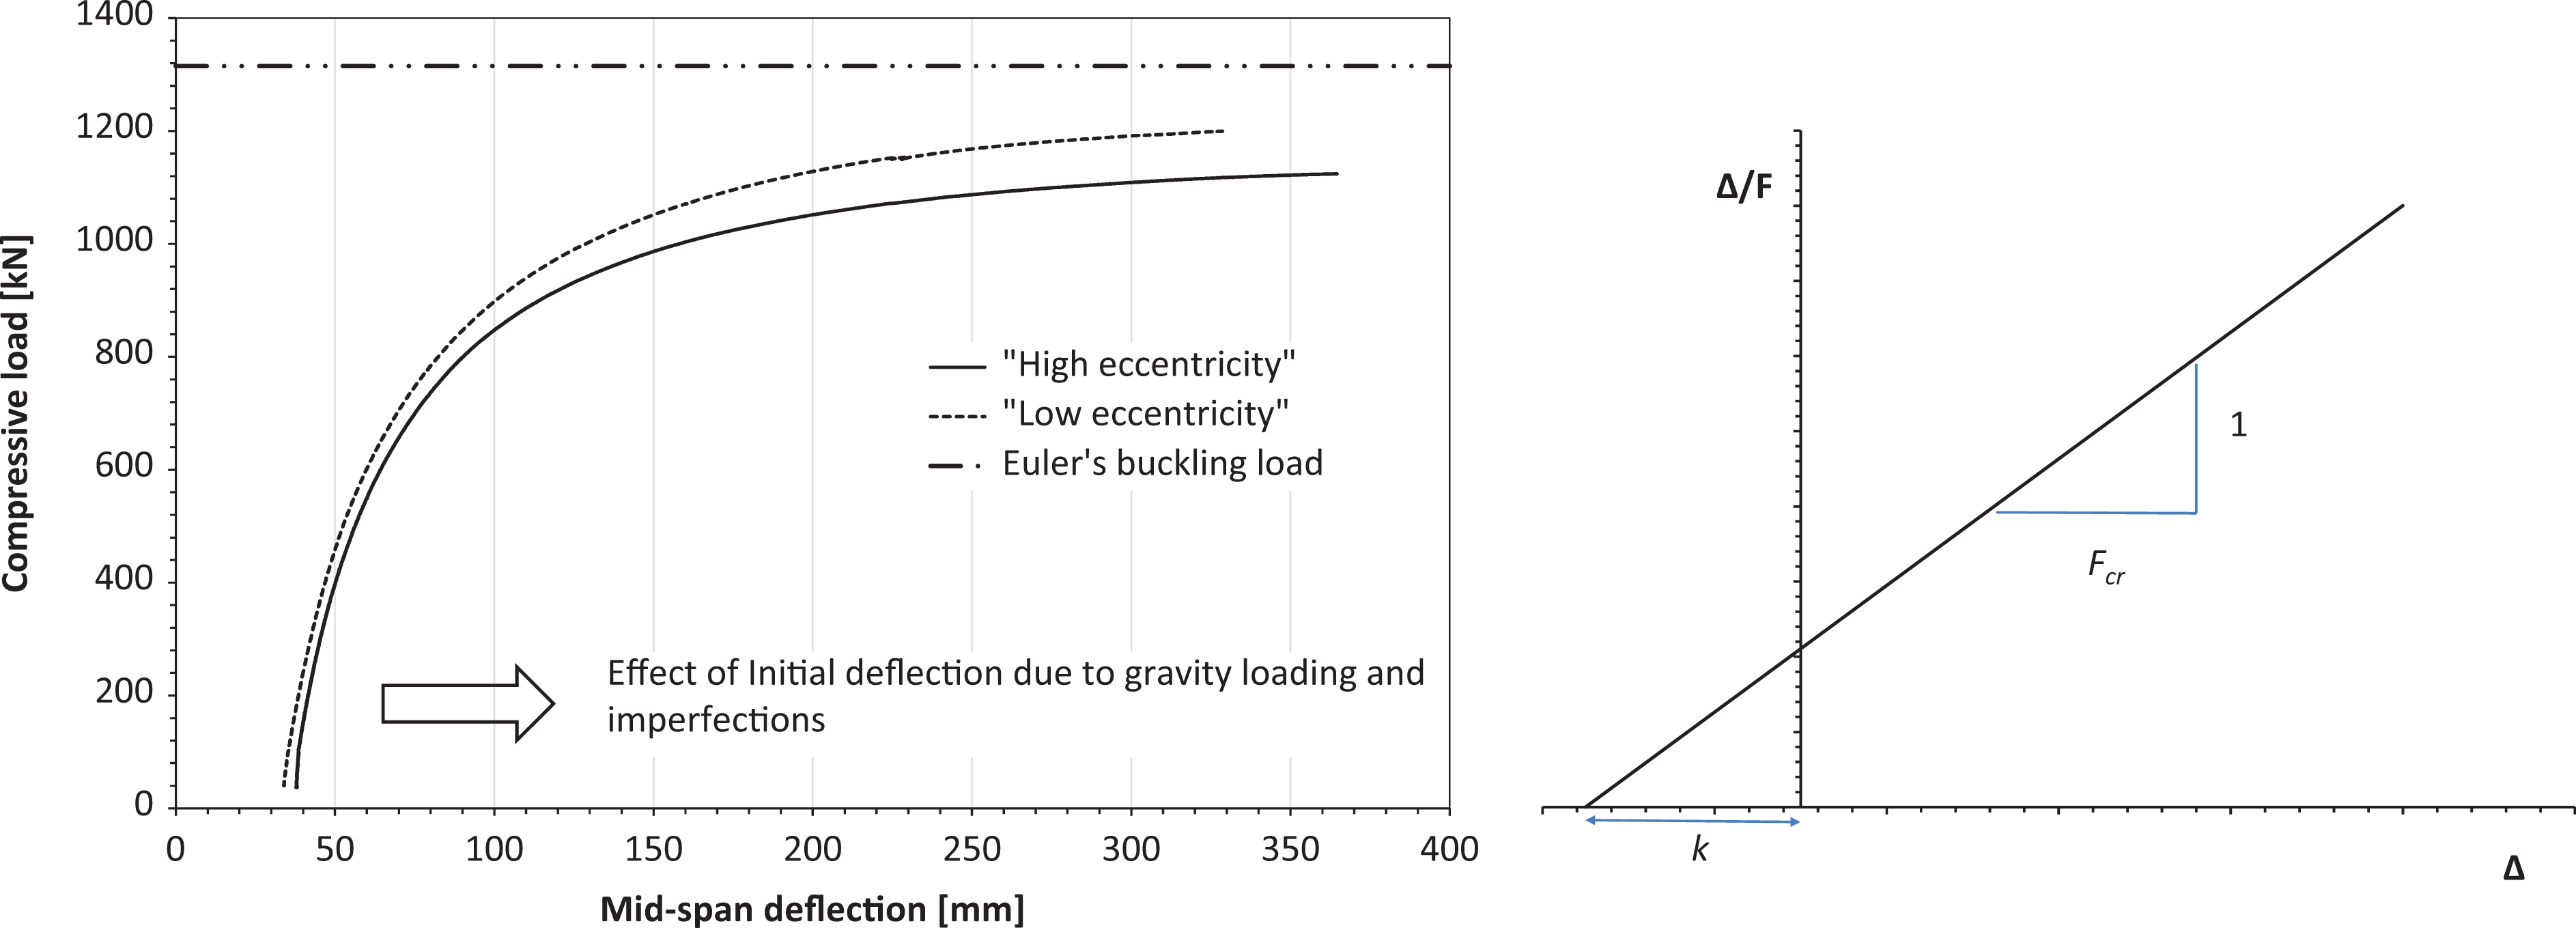
Effect of transverse loading and imperfections on mid-span deflection as well as a typical linearized Southwell plot. 16
The equation can be solved by Fourier series. Defining the true deflection as the difference between the centroid axes and the column axes in the initially deformed state, ▵ = w − w0, the linearized relationship between the ▵/F and ▵ can be written

where Fcr is the critical buckling load and k represents the apparent imperfection. Equation (4) is presented to the right in Figure 10.
To handle imperfections and initial transverse deflections due to, for example, eccentricities, the beams own weight and the effect of transverse loading, Southwell’s method 20 was used. The effect of imperfections is that the lateral deflections will start to increase from the onset of loading. Barbero and Tomblin 21 also studied Euler or global buckling of composite columns with thin-walled cross sections. Various I-beams of long length were tested and Southwell’s method was used to determine the critical buckling load about both the strong and weak axes. The theoretical critical loads were found solving the buckling equation in combination with a micromechanical approach to calculate the bending stiffness of the beam cross section about the two axes. Turvey and Zhang 22 also used the Southwell method in their study of nonlinear FE analysis to predict buckling, post buckling and initial failure of pultruded GRP columns.
Experimental programme on full-scale specimens
The test programme was carried out in two phases. The first phase of the test programme consisted of repetitive axial loading of specimens A and B to 1.1 times the design load, that is, 880 kN axially to study the behaviour of the test jig and to document the performance of the bonded tubes at the requested load.
The second phase utilized the same specimens; however, the load was increased to the maximum capacity of the test equipment, that is, approximately 1200 kN and to study the behaviour of the tubes close to the buckling load. The tubes were tested in a horizontal position with the gravity loading, representing the wind load as given in the original technical requirements.
Test runs
All test runs are listed in Table 2. For specimen A, the different test positions of the tube are shown in Figure 11. 0° position was the position when the specimen axis was above cone ends, that is, the position where the lack of concentricity reduced the initial central deflection due to the gravity loading. This test run would then produce the least mid-span deflection. For specimen B, an arbitrary position was taken as the 0° since this specimen was measured to be close to straight.
All test runs for specimens A and B.


The four test cases: 0°, 90°, 180° and 270° position of tube axis versus centre of rotation/load application for specimen A due to end cone angles resulting in various degree of eccentric loading.
One run consisted of a loading to target load, holding this load for 1 min, unloading to initial axial preload (35–40 kN) and then waiting for 1 min before stopping data logging. Test run 1 with specimen A was repeated three times and labelled A1(1), A1(2) and so on. After the initial test runs to 880 kN were finished, both specimens were subjected to the maximum compressive force available, that is, approximately 1200 kN. In test run 9, specimen B was loaded twice close to 1200 kN in the 90° position and then rotated 180° and repeated once in the other position. After these three tests, the specimen was removed from the test jig and specimen A reinstalled in the position having the largest initial eccentricity (180°).
Test results: 880 kN axial loading
Hysteresis in the test runs was small, that is, the strains and displacements returned to less than 1% of the maximum reading after one or two load cycles. In all test runs, it was observed that the two displacement sensors (y3 and y4, see Figures 5 and 6) recording the mid-span deflection were not indicating the same value, that is, as if the specimen rotated slightly in the clockwise direction. This is presented in Figure 12 for test run A1(3). For specimen A, the readings differed by 9–13 mm, which indicated that the specimen rotated 1.1–1.7°. The largest rotation occurred when the eccentricity was in the horizontal plane (tube A rotated 90° or 270°), which also introduced bending in this plane. The strains indicate that the main bending occurred in the vertical plane – as expected – and a much smaller bending also took place in the horizontal plane, mainly during the first part of the loading. This was confirmed by the transverse displacement at mid-span, which indicated that the cylinder moved initially to the left as seen from the hydraulic ram end (in the x-direction). Thereafter, further displacement measured by the sensor in the z-direction was due to vertical displacement of the tube.
Displacements and strains from a typical test run – specimen A, first test, third repetition.
The degree of bending in the horizontal plane was dependent on the orientation of the specimen eccentricity, that is, when specimen A was rotated ±90°, bending in the horizontal plane was at its largest. This behaviour was fully symmetric as the displacement in the z-direction (Z1), corrected for the mid-span deflection in the y-direction, was +10.4 mm when the eccentricity was to the right (rotated to the 90° position) and −10.5 mm when it was rotated in the opposite direction. Both measured at 880 kN. When tested in the 180° position, the specimen mid-span deflection was as expected, that is, the deflection from 0° position plus the effect of the eccentricity found in the opposite plane which yielded 75.5 mm, whereas the measurement from test run 3 showed 77.3 mm.
Table 3 shows the result for specimen A. The values shown from test run 1 are from the last repetition. Wmax is the maximum transverse displacement (average of y3 and y4) at the mid-span. The values are expressed in percentage of the tube diameter and tube length. K is the axial stiffness of the tube. Ea(disp) and Ea(sg) are the measured axial moduli of the tube between a load of 100 and 500 kN based on axial displacement and the slope of the stress versus strain curve where the strain was the average axial strain from gages located at 0° and 180° and 90° and 270°. There was a problem with the displacement transducer in the first test run; hence, no data were recorded.
Results for tests with specimen A loaded to 880 kN.a

aL is the specimen length, COV is the coefficient of variation and d the average diameter of the tube.
The calculated critical loads from Southwell linearized plots are also shown. The critical loads were found using a linear regression analysis of the last part of the curves in Figures 13 and 14. The average critical load Fcr for specimens A and B was 1200 kN versus 1260 kN. Listed is also the apparent imperfection – k. The reduction of the critical load should be due to differences in the eccentricity. Nunes et al. 7 showed that the ultimate load decreased with an approximative linear trend for small eccentricities in the testing of GFRP columns. Examining the results, one notes that the tube wall compressive modulus from strain gage readings is almost the same for the two tubes, whereas tube B seems to exhibit a stiffer response when the compressive modulus is based on the axial displacements. This could be due to differences in the attachment of the sensors as the tubes were installed, but it could be due to differences in the axial stiffness of the pipe itself, even though they were expected to be almost identical.

Specimen A. Axial load versus mid-span deflection and linearized Southwell plot for test runs at different angular positions.

Specimen B. Axial load versus mid-span deflection and linearized Southwell plot for test runs at different angular positions.
For specimen B, the difference between the displacements at mid-span was much lower at 7–8 mm. Even though specimen B was taken as ‘almost straight’, it exhibited bending in the vertical and horizontal plane indicated by the corrected displacements in the z-direction and the mid-plane strains (∊a,90 and ∊a,270). The detailed results are shown in Table 4. Specimen B showed less bending in most positions than specimen A for test run 1, even though the measured E-modulus based on strain gage readings was almost identical.
Results for tests with specimen B loaded to 880 kN.

Test results: Load up to 1200 kN
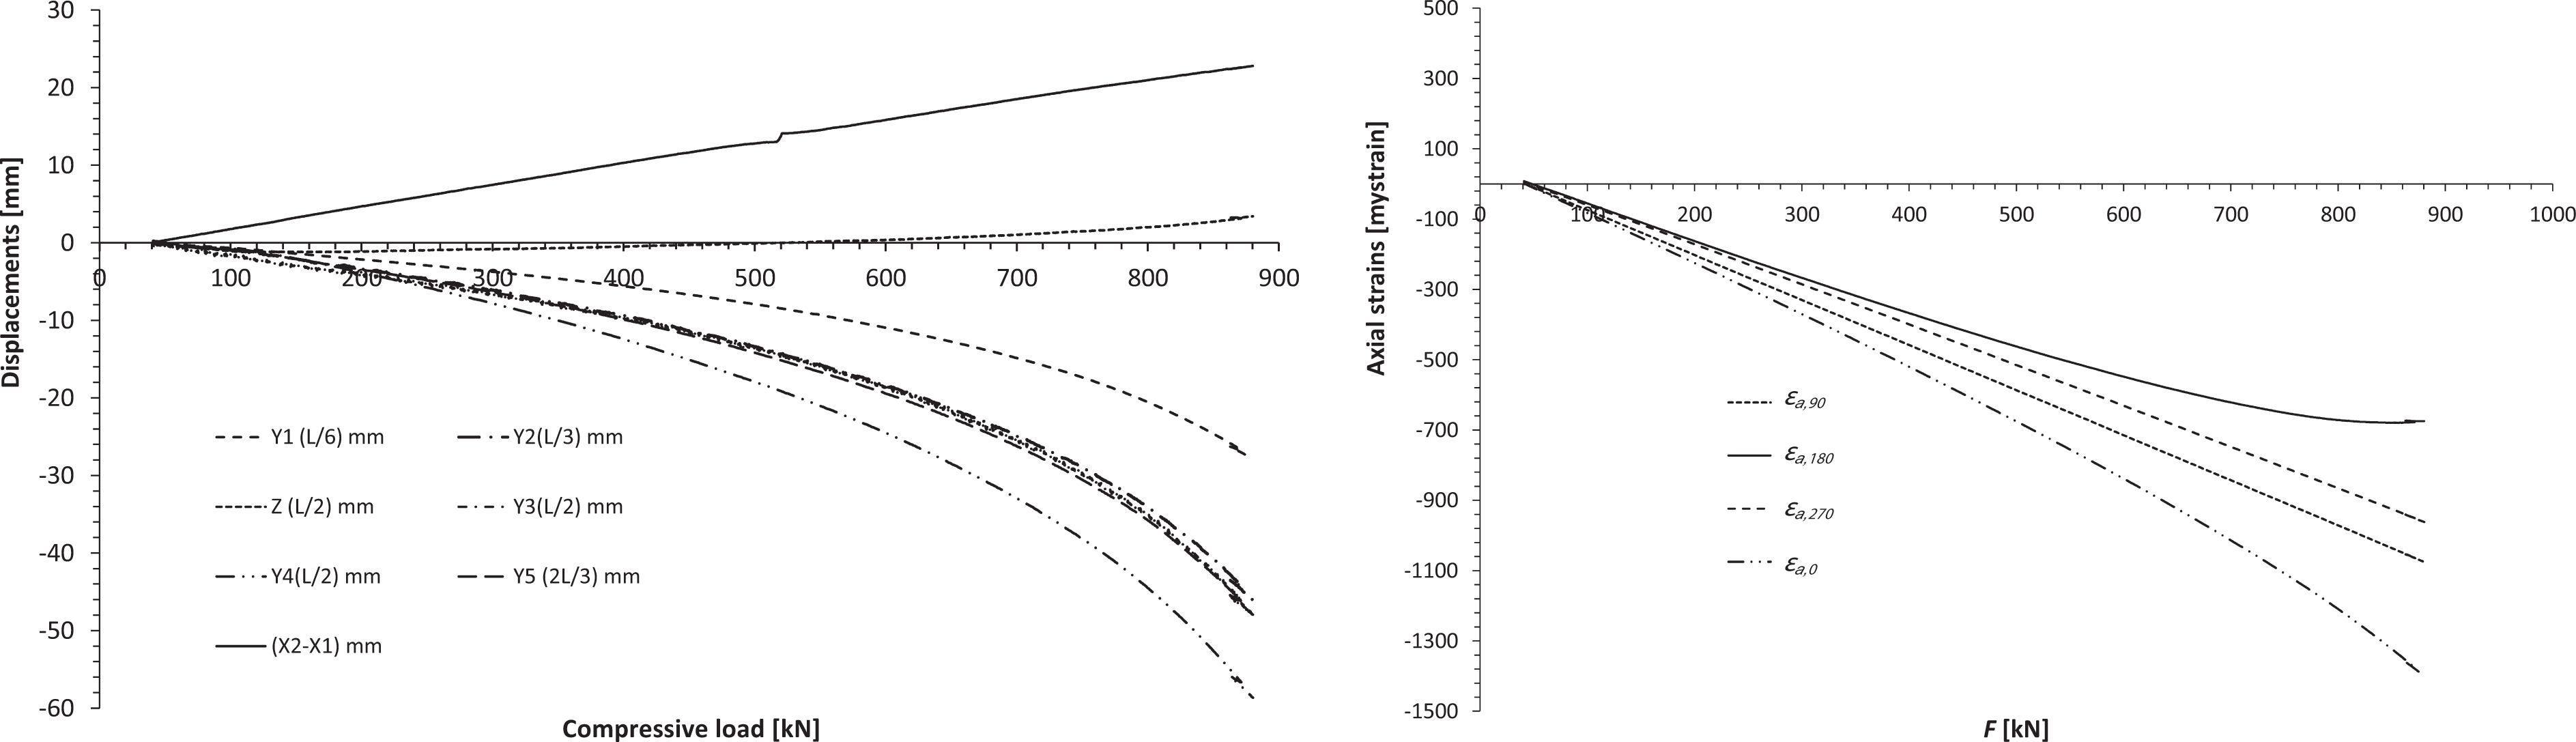
After all the initial tests, specimen B was first carefully loaded towards 1200 kN, oriented in the 270° angular position but the test was aborted at 1140 kN due to an obstruction. The second run in this position was terminated at a load of 1190 kN. In the last test run, the pole was rotated to the 90° position and loaded, finally, to 1200 kN. The reasons for carrying out the tests carefully were that the compression stresses in the end cones were approaching the failure stress of the GRP materials from which they were made. As load increased towards 1200 kN, it became evident that bending was dominating the deformation and even the smallest increase in axial displacement resulted in large transverse displacement making manual control of the hydraulics delicate. Load versus axial shortening for test run 9(2), 10 and 11 is shown in Figure 15. The curves show a classical global buckling phenomenon where the lower critical load for specimen A can be explained by a higher eccentricity.

Load versus axial shortening for specimens A and B loaded to 1200 kN.
The axial strains for test 10 are shown in Figure 16. Figure 17 shows the normalized mid-span deflection versus normalized compressive force. The buckling force FE and critical force from Southwell plots Fcr are the average values from the test to 880 kN, that is, 1323 and 1204 kN for specimen A, respectively, 1324 and 1265 kN for specimen B.
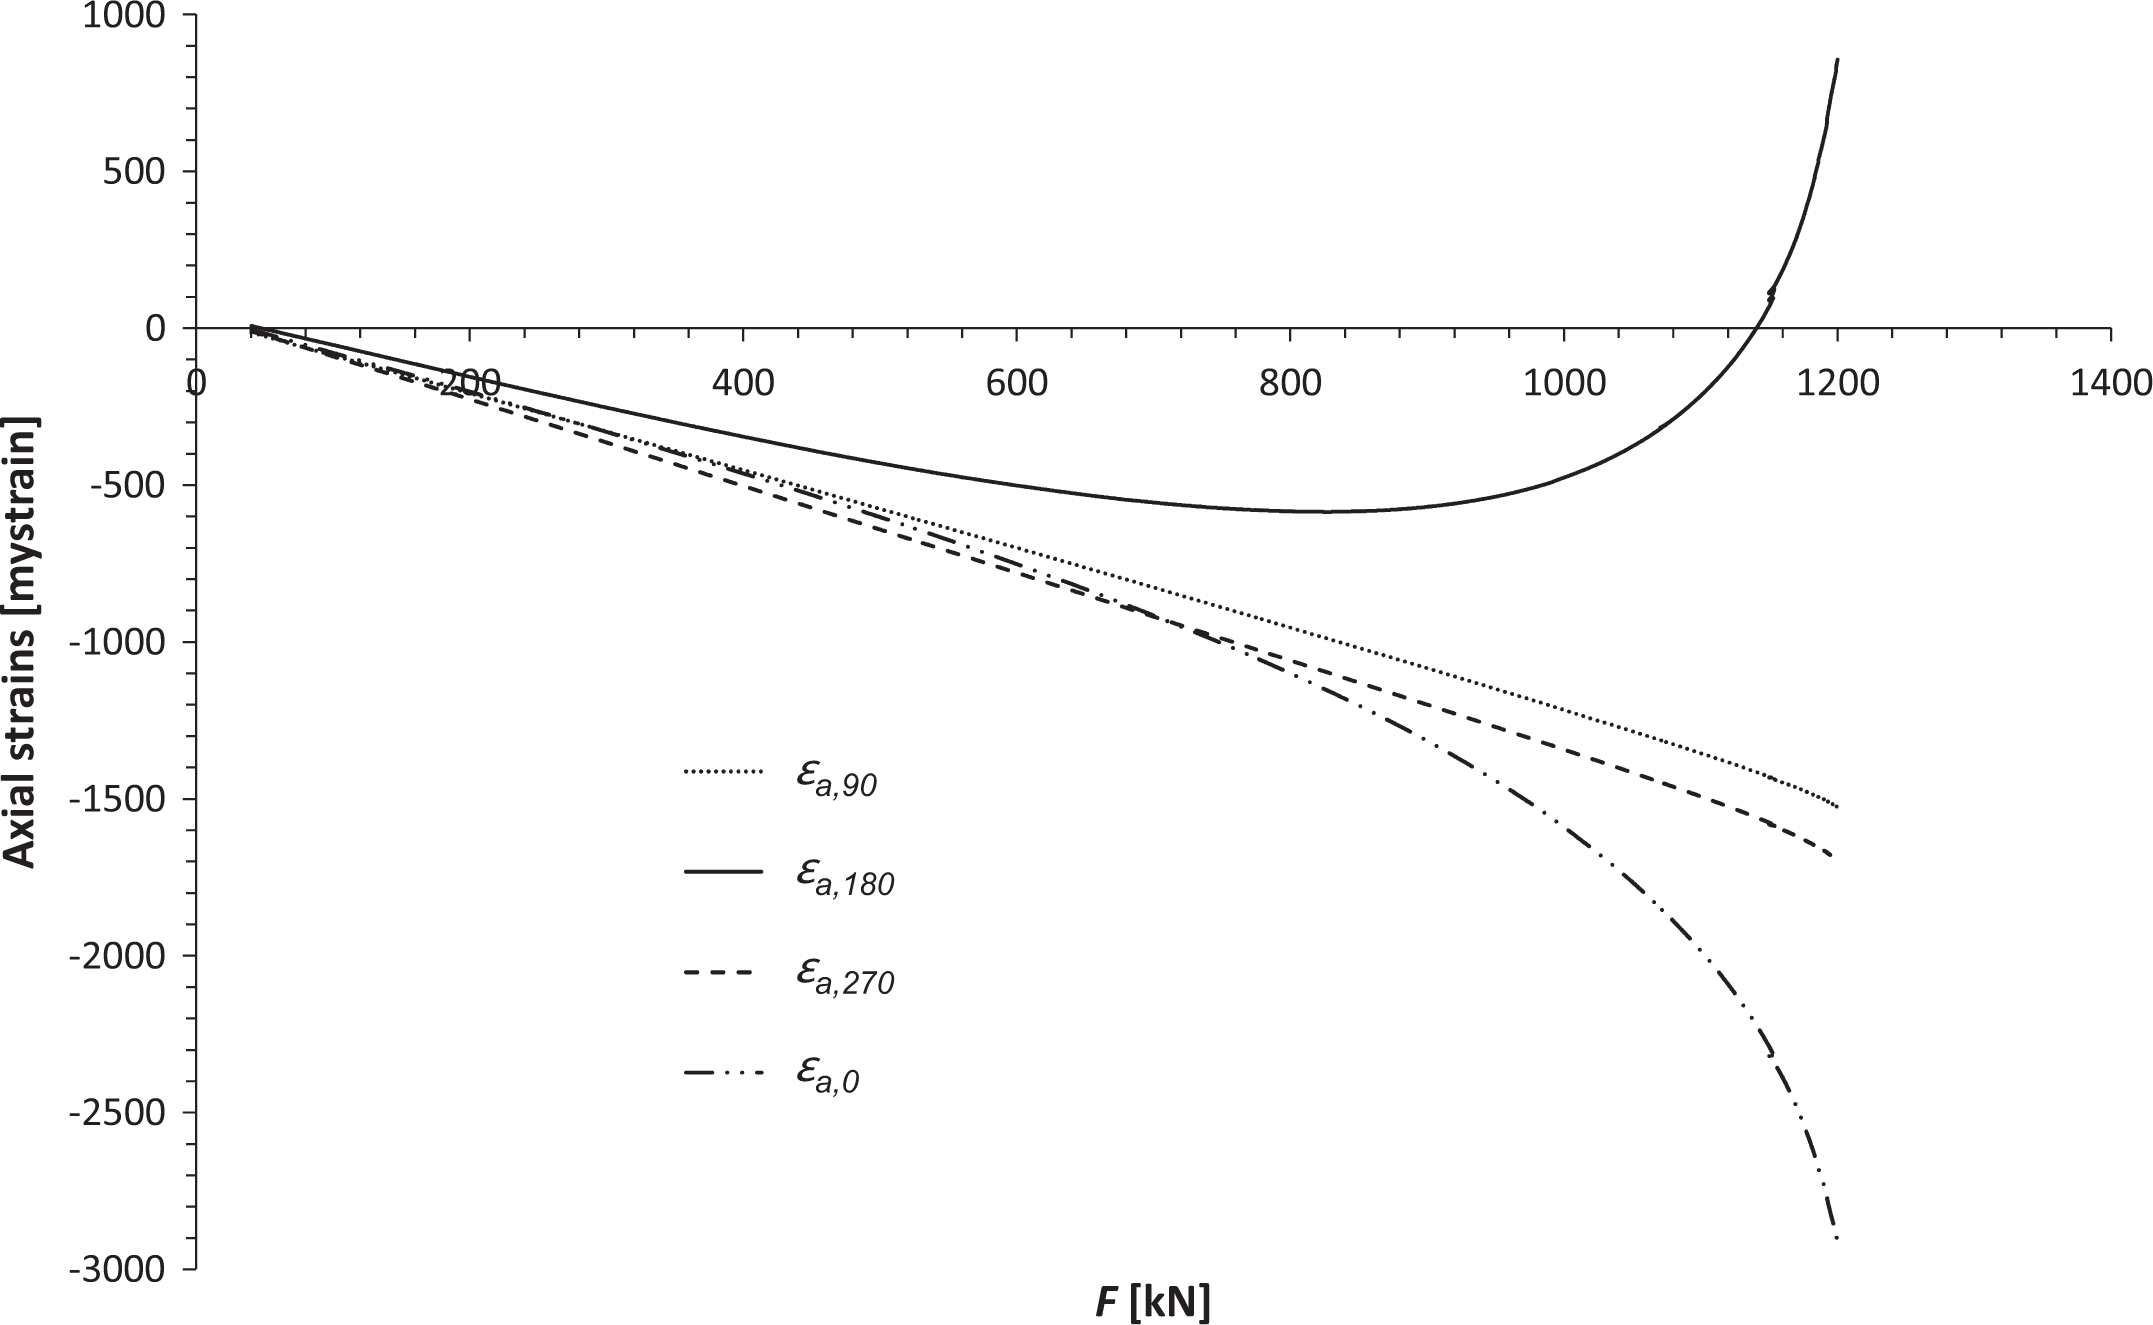
Axial strains at all positions for specimen B loaded to 1200 kN (test run 10).

Normalized mid-span deflection versus normalized force for specimens A and B subjected to approximately 1200 kN.
Table 5 lists major test results. Specimen A did not reach 1200 kN as it failed in an unexpected manner between mid-span and the load-cell end of the specimen. This was due to production flaw where the wall thickness for a certain length of the tube was less than required. This deficiency might have contributed to the measured differences between specimens A and B. This second test session shows that whereas the axial compressive modulus measured by the strain gages was identical to the previous runs, the modulus based on the axial displacements was not the same. This is probably due to problems attaching the axial displacement sensors in exactly the same positions as in the first test session.
Test runs for both specimens to 1200 kN/failure.
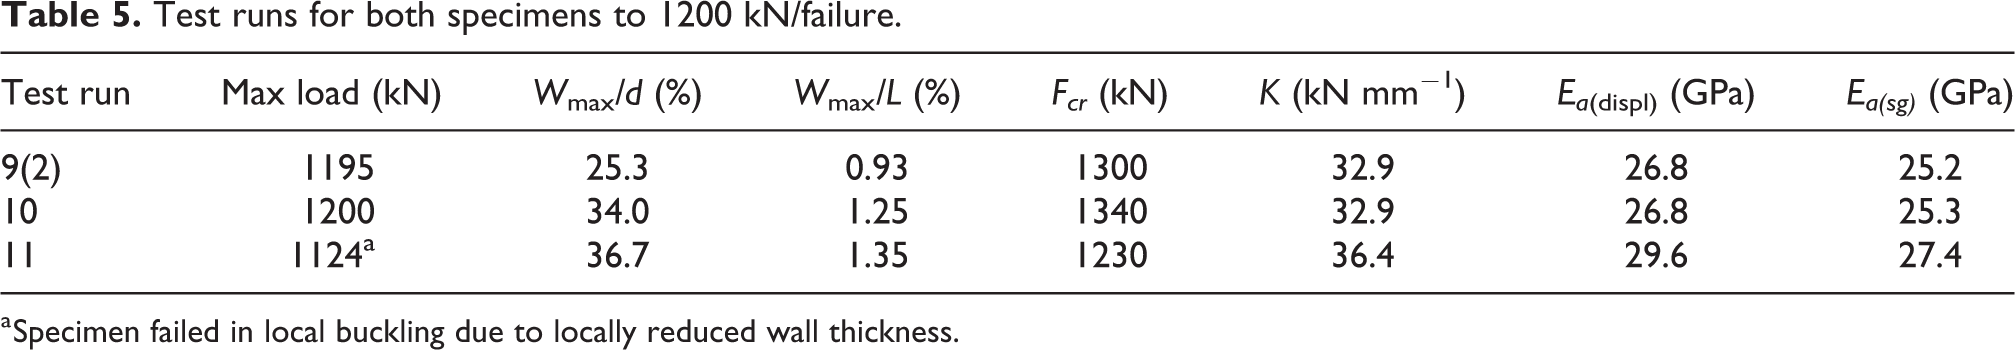
a Specimen failed in local buckling due to locally reduced wall thickness.
Evaluation of test results
The two test specimens showed classical buckling behaviour in all tests, that is, slender columns with initial imperfections given by the geometric eccentricities of the specimen and the transverse displacement due to the gravity loading. The transverse deflection versus longitudinal position is seen in Figure 18, for a compressive load close to 1100 kN. In Figure 18 (where X = x + L/2), two different sinusoidal-shaped curves are plotted: one having the same centre displacement as measured and the other the same initial slope near the ends as the deformed specimen. Measured data at the positions y2 and y3 are mirrored in Figure 18 to present the whole shape from end-to-end.

Normalized lateral deflection versus longitudinal position for specimens A and B subjected to approximately 1100 kN axial load and fitted sinusoidal shapes.
The lateral deformation of the tube during loading appeared not to be a perfect half-wave sine curve which could be due to the stiffness effect of the mid-span sleeve and friction in the spherical bearings. The latter would cause transfer of bending moments and reduction in the slope of the deformed shape close to the ends. The measured deformed shape indicated that the mid-span stiff sleeve/tube section (0.6 m long, 28.6 mm thick) modulated the transverse deflection at that point and that this effect is the governing one. Parasitic bending moments at the ends did not seem to have a pronounced effect. Hence, the mid-span deflections were less than expected for a pole without a mid-span joint. Specimens A and B exhibited identical deformed shape at 1100 kN and the deflections were approximately 10–13% less than a fitted sinusoidal curve through the deflections measured closest to the ends yielding a curve with the same slope as the measured one.
For a circular tube without any cut-outs or local reinforcements, Feng et al. 23 reported a lateral deformation in the shape of a half-sinusoidal curve. They also reported that equation (2) overestimated the buckling load of columns with smaller slenderness ratio and proposed another equation to determine the stability of FRP columns. However, the present work has shown that for the studied columns, interaction between local and global buckling is not the governing phenomenon for the critical buckling load. In his review, Russo 24 also studied different pultruded shapes with varying slenderness ratio. He proved that at higher slenderness ratios, photographic surveys of the collapses illustrated the lack of interaction between local and global buckling. Applying the semi-empirical procedures described in his article for pultruded composite columns, our much larger specimens were not subject to local-global instabilities. When global buckling occurred, the average axial compressive stress in the cylinder cross section was 44–46 MPa, which is only 13% of the compressive strength of the material.
The two specimens displayed a slightly different behaviour and critical loads (1200 vs. 1260 kN). This behaviour was independent on angular orientation of the specimen as well as the maximum load it was subjected to. As mentioned earlier, specimen A failed in the last test run due to a local flaw in the cylinder wall, that is, a zone of reduced wall thickness due to less thickness of the axial layers which lead to a local buckling failure of the composite. The locally reduced axial stiffness could be seen in the measured axial stiffness, which was 7% lower for specimen A. However, the symmetrical spaced sensors measuring the transverse displacement at L/3 did not show any difference during the test runs.
Concluding remarks
This article has presented and discussed the feasibility of assembling a composite pole for an externally guyed high-voltage transmission tower using composite material components, subjected to a combined transverse and axial compressive load tested in a bespoke jig. Design and production of the test jig was carried out with great attention to stiffness of the steel structure and concentricity and angularity of the attachment points. Attention was also paid to produce two identical 25-m long glass fibre–reinforced polyester specimens with small geometric eccentricities and installing these into the test jig using low friction spherical bearings to simulate pinned end connections. Well-documented classical theory for the prediction of the critical buckling load was applied to estimate the buckling load of the two specimens. The following conclusions summarize the work presented here: Thin-walled circular cross-section composite material parts made from efficient production processes can serve as a basis for slender poles in externally guyed high-voltage transmission towers. There is a potential for further optimization to reduce weight, production cost and tower erection costs at remote sites requiring helicopter transportation. In-depth analysis of tests results required extensive and reliable instrumentation of the tests specimens as well as laboriously characterization of their out-of-straightness. Even small eccentricities influence highly the deformed shape when loaded. Spherical bearings proved to represent pinned end connections with negligible influence on the deformed shape. Furthermore, multiple loading–unloading cycles and loading at different angular positions proved to be highly repetitive and the effect of out-of-straightness in one plane was mirrored when the specimen was rotated 180° and retested. Methods previously used extensively in studies of buckling of slender pultruded composite profiles have been applied to establish the critical load of the two 25-m long specimens. Linearized Southwell plots of several test runs to 73% of the buckling load showed the average critical force of the two specimens where within 9% and 4%of the Euler buckling load utilizing the measured compressive E-modulus from each test run. In the last test runs, when the specimens were loaded to approximately 1200 kN, the deviation from the previously measured critical force from Southwell plots was approximately 5%. As studied and documented previously by several authors, the current test specimen geometry (cross-sectional shape and geometrical slenderness ratio) and material composition has shown that the critical loads can be established by Southwell plots and that the structure studied is not prone to interaction between local and global instabilities. The designed test jig worked flawlessly. The absence of parasitic effects, for example, high friction, made it possible to study the effect of the small measured eccentricities of the tested specimens.
Footnotes
Authors’ note
The composite pole demonstrator project was managed by CSUB AS which also manufactured the end cones as well as developed the adhesive bonding procedures in cooperation with Lindberg & Lund AS. The cylinders and sleeves were manufactured by Amiblu and strain gauges were installed by Amiblu which also carried out materials testing of the tube wall on coupon level. Design and FE analysis of the specimens were carried out by Fibre Content Ltd, UK. Design, dimensioning and production of the test jig were made by RSM Contract AS. Manufacture of the all partners laboriously assembled the two specimens which were extensively instrumented by Urdal Services AS.
Declaration of conflicting interests
The author(s) declared no potential conflicts of interest with respect to the research, authorship, and/or publication of this article.
Funding
The author(s) disclosed receipt of the following financial support for the research, authorship, and/or publication of this article: This work was supported by Statnett as a part of the Research and development project Composite tower for 420 kV level that is part of the EU-funded research consortium Best Path.