
Abstract
This work reports the synthesis and characterisation of reduced graphene-1,3,4-oxadiazole-2-thiol (rGS) as a novel nanocompound derivative for graphene. The preparation was performed through a series of reactions starting from graphene oxide, followed by incorporation of different proportions of this nanocompound with poly(vinyl alcohol) (PVA), via non-covalent bonding, to afford the rGS/PVA polymer composites. The pure rGS compound, rGS/PVA composite films and pure PVA film were characterised by different techniques including infrared (Fourier transform infrared) spectroscopy, scanning electron microscopy and powder x-ray diffraction. The electrical properties of the composite films, involving dielectric constant, permittivity (ε′), imaginary permittivity (ε″), conductivity (σAC) and loss factor tan δ, were investigated. The measurements were performed at frequencies of (5kHz to 0.5 MHz) at room temperature. At low frequency, the dielectric permittivity (ε′) and imaginary permittivity (ε″) attained higher values in all cases, although with increasing frequency these values diminished rapidly. It was also found that the alternating current conductivity of the composites increased with increasing frequency.
Introduction
Graphene nanosheet has opened up new prominent formulations for a broad variety of novel nanomaterials. 1 Therefore, intensive research has been reported on developing high-performance polymer nanocomposites for various industrial applications. 2 Graphene, at a very low loading, causes spectacular improvements in polymer-based composites’ properties, leading to the formation of numerous electrically conductive nanocomposites. Such conducting nanocomposites have been widely applied in anti-static materials, electromagnetic interference (EMI) shielding, chemical sensor, bipolar plates for fuel cells, and so on. 3 –6 To achieve maximal properties enhancement, synthesis of such composites requires homogeneous graphene dispersion in the matrix. In addition, external loading should be efficiently transmitted via a strong interaction between the graphene and the matrix interface. Nevertheless, the homogeneous dispersion of graphene in the polymer matrix remains a provoking issue. That may arise due to the scarcity of soluble/dispersible graphenes in a common solvent with the polymer. 7 –10 However, the electrical conductivity of the polymers is greatly dependent on the polymer properties, as well as the filler type, geometrical shape, and distribution. In general, carbon allotropes and related nanocompounds have widely been utilised as conductive fillers, such as carbon black, carbon fibres (CFs), graphite, carbon nanotubes (CNT), graphene and functionalised graphene. 7,11 –20 The objective of the present work is to highlight the preparation of nanocomposite polymer films and study their electrical properties. The synthesis was performed through doping of poly(vinyl alcohol) (PVA), one type of water-soluble polymer, with reduced graphene-1,3,4-oxadiazole-2-thiol (rGS) as a novel graphene derivative. This system can provide stable dispersion of rGS in polar solvent (water) and forming hydrogen bonding with (PVA) easily, subsequently, it may improve the electrical properties of the composite.
Experimental
Materials
The starting materials were obtained from different sources and companies: sodium nitrate (Merck KGaA, Darmstadt, Germany), graphite (Alpha Chemika, Maharashtra, India), potassium permanganate, concentrated sulphuric acid (98%), hydrochloric acid (36%), potassium hydroxide, carbon disulphide and PVA (Sigma-Aldrich, Taufkirchen, Germany), hydrogen peroxide (30%) (HIMEDIA, Mumbai, India) and hydrazine monohydrate (Qualikems, Gujarat, India).
Preparation of graphene oxide, reduced graphene oxide and rGS
Graphene oxide (GO) was prepared following a modified Hummers method from pristine graphite powder. 21 Reduced graphene oxide (rGO) was obtained by reduction of GO as following: GO 1 g was dispersed in water (100 mL) and sonicated for 30 min. Then, hydrazine hydrate (2 mL, 64.2 mmol) was added into the dispersed solution and the temperature was maintained at 100°C under constant stirring for 24 h. The rGO gradually precipitated out as a black powder. The product was filtered, washed thoroughly with water and dried in a vacuum oven at 50°C for 24 h.
The rGS was prepared by dispersing of rGO (1 g) in methanol (75 mL), followed by the addition of concentrated sulphuric acid (5 mL). Then, the solution was refluxed for 13 h. The resulting suspension was filtered, washed with distilled water and dried under vacuum for 24 h to reveal the graphene ester (rGE). Dry rGE powder (0.5 g) was dispersed into saturated hydrazine hydrate (50 mL), and the solution was refluxed for 30 h. The suspended solution was filtered, washed with distilled water and dried under vacuum for 24 h to produce graphene hydrazide (rGH). The rGS was prepared by loading mixture of potassium hydroxide (0.5 g), ethanol (75 mL) and rGH (0.2 g) in a 250-mL round-bottomed flask. The solution was stirred for 2 h at room temperature and placed in an ice-bath. Carbon disulphide (0.3 mL) was added dropwise to the solution with constant stirring. The resulting black greenish solution was refluxed for 24 h. Finally, the resulting suspension was filtered, washed with 1 M HCl, then washed with distilled water and dried under vacuum for 24 h to produce rGS. The chemical reactions are represented in Figure 1.

Preparation of nanosheet compounds (GO, rGO, rGE, rGH and rGS) and rGS/PVA composites.
Fabrication of rGS/PVA composites
PVA/rGS composites films, with different percentage rGS loadings (1, 4 and 8 wt%), were synthesised by simple solution casting. PVA (2 g) was dissolved in hot distilled water (25 mL), then the desired amount of rGS (with respect to the PVA/rGS composite) was slowly added. The resulting mixture was stirred for 30 min to form a homogeneous solution. Subsequently, the solution was cast onto a glass plate and dried under vacuum at 60°C. Finally, the film was peeled off to study the improvement of the physical properties of PVA/rGS composites.
Instrumentation
Fourier transform infrared (FTIR) spectra of the samples were recorded with an IR Shimadzu 8400 spectrophotometer (Nishinokyo Kuwabara-cho, Nakagyo-ku, Kyoto 604-8511, Japan) over the range of 4000–400 cm−1. Morphology of as-prepared samples was characterised by scanning electron microscopy (SEM, JEOL 6330 Cryo Field Emission (FESEM), the samples were carried out at Jordan University of Science and Technology) with an accelerating voltage of 20 kV. X-ray diffraction (XRD) analyses were carried out with Shimadzu
Dielectric properties of the rGS/PVA composites were measured using an LCR meter type PM6036 and calculated by measurement of real permittivity, imaginary permittivity, loss factor (tan δ) and the alternating current (AC) conductivity (σAc). The investigations were made at different frequencies (5 kHz to 0.5 MHz) at room temperature. The dielectric parameter, as a function of frequency, is described by the complex permittivity equation

where the real part ε′ and imaginary part ε″ are the components for the energy storage and loss, respectively, for each cycle of the electric field. ω is the angular frequency; ω = 2Πf, where f is the applied frequency. The measured capacitance C was used to calculate the dielectric constant ε′ using the following expression

in which d is the film thickness, A is the area of the electrodes and εo is the permittivity of the free space (ε0 = 8.85 × 10⁻¹² F m−1).
Whereas the dielectric loss ε″(ω) and tan δ were evaluated by the following equation 22

The AC conductivity (σ ac) can be calculated by the following equation 22

Results and discussion
Characterisation
The FTIR spectra for the nanocompounds (GO, rGO, rGS) and pure PVA were recorded as shown in Figures 2 and 3, respectively. The spectrum of GO illustrates the presence of broad band at 3433 cm−1 denoting the stretching vibration of hydroxyl groups ν(O–H). The bands at 1733 cm−1 are attributed to the ν(C=O) moiety of (−COOH) groups. The bands at 1161 and 1060 cm−1 are ascribed to the stretching of epoxy and alkoxy groups, respectively. 23,24 The peak at 1623 cm−1 may be from skeletal vibrations of unoxidised graphitic domains. 7 On the other hand, from the examination of the IR spectrum of the rGO, one can still observe the hydroxyl group peaks at 3431 cm−1, though with less intensity compared to that of GO.
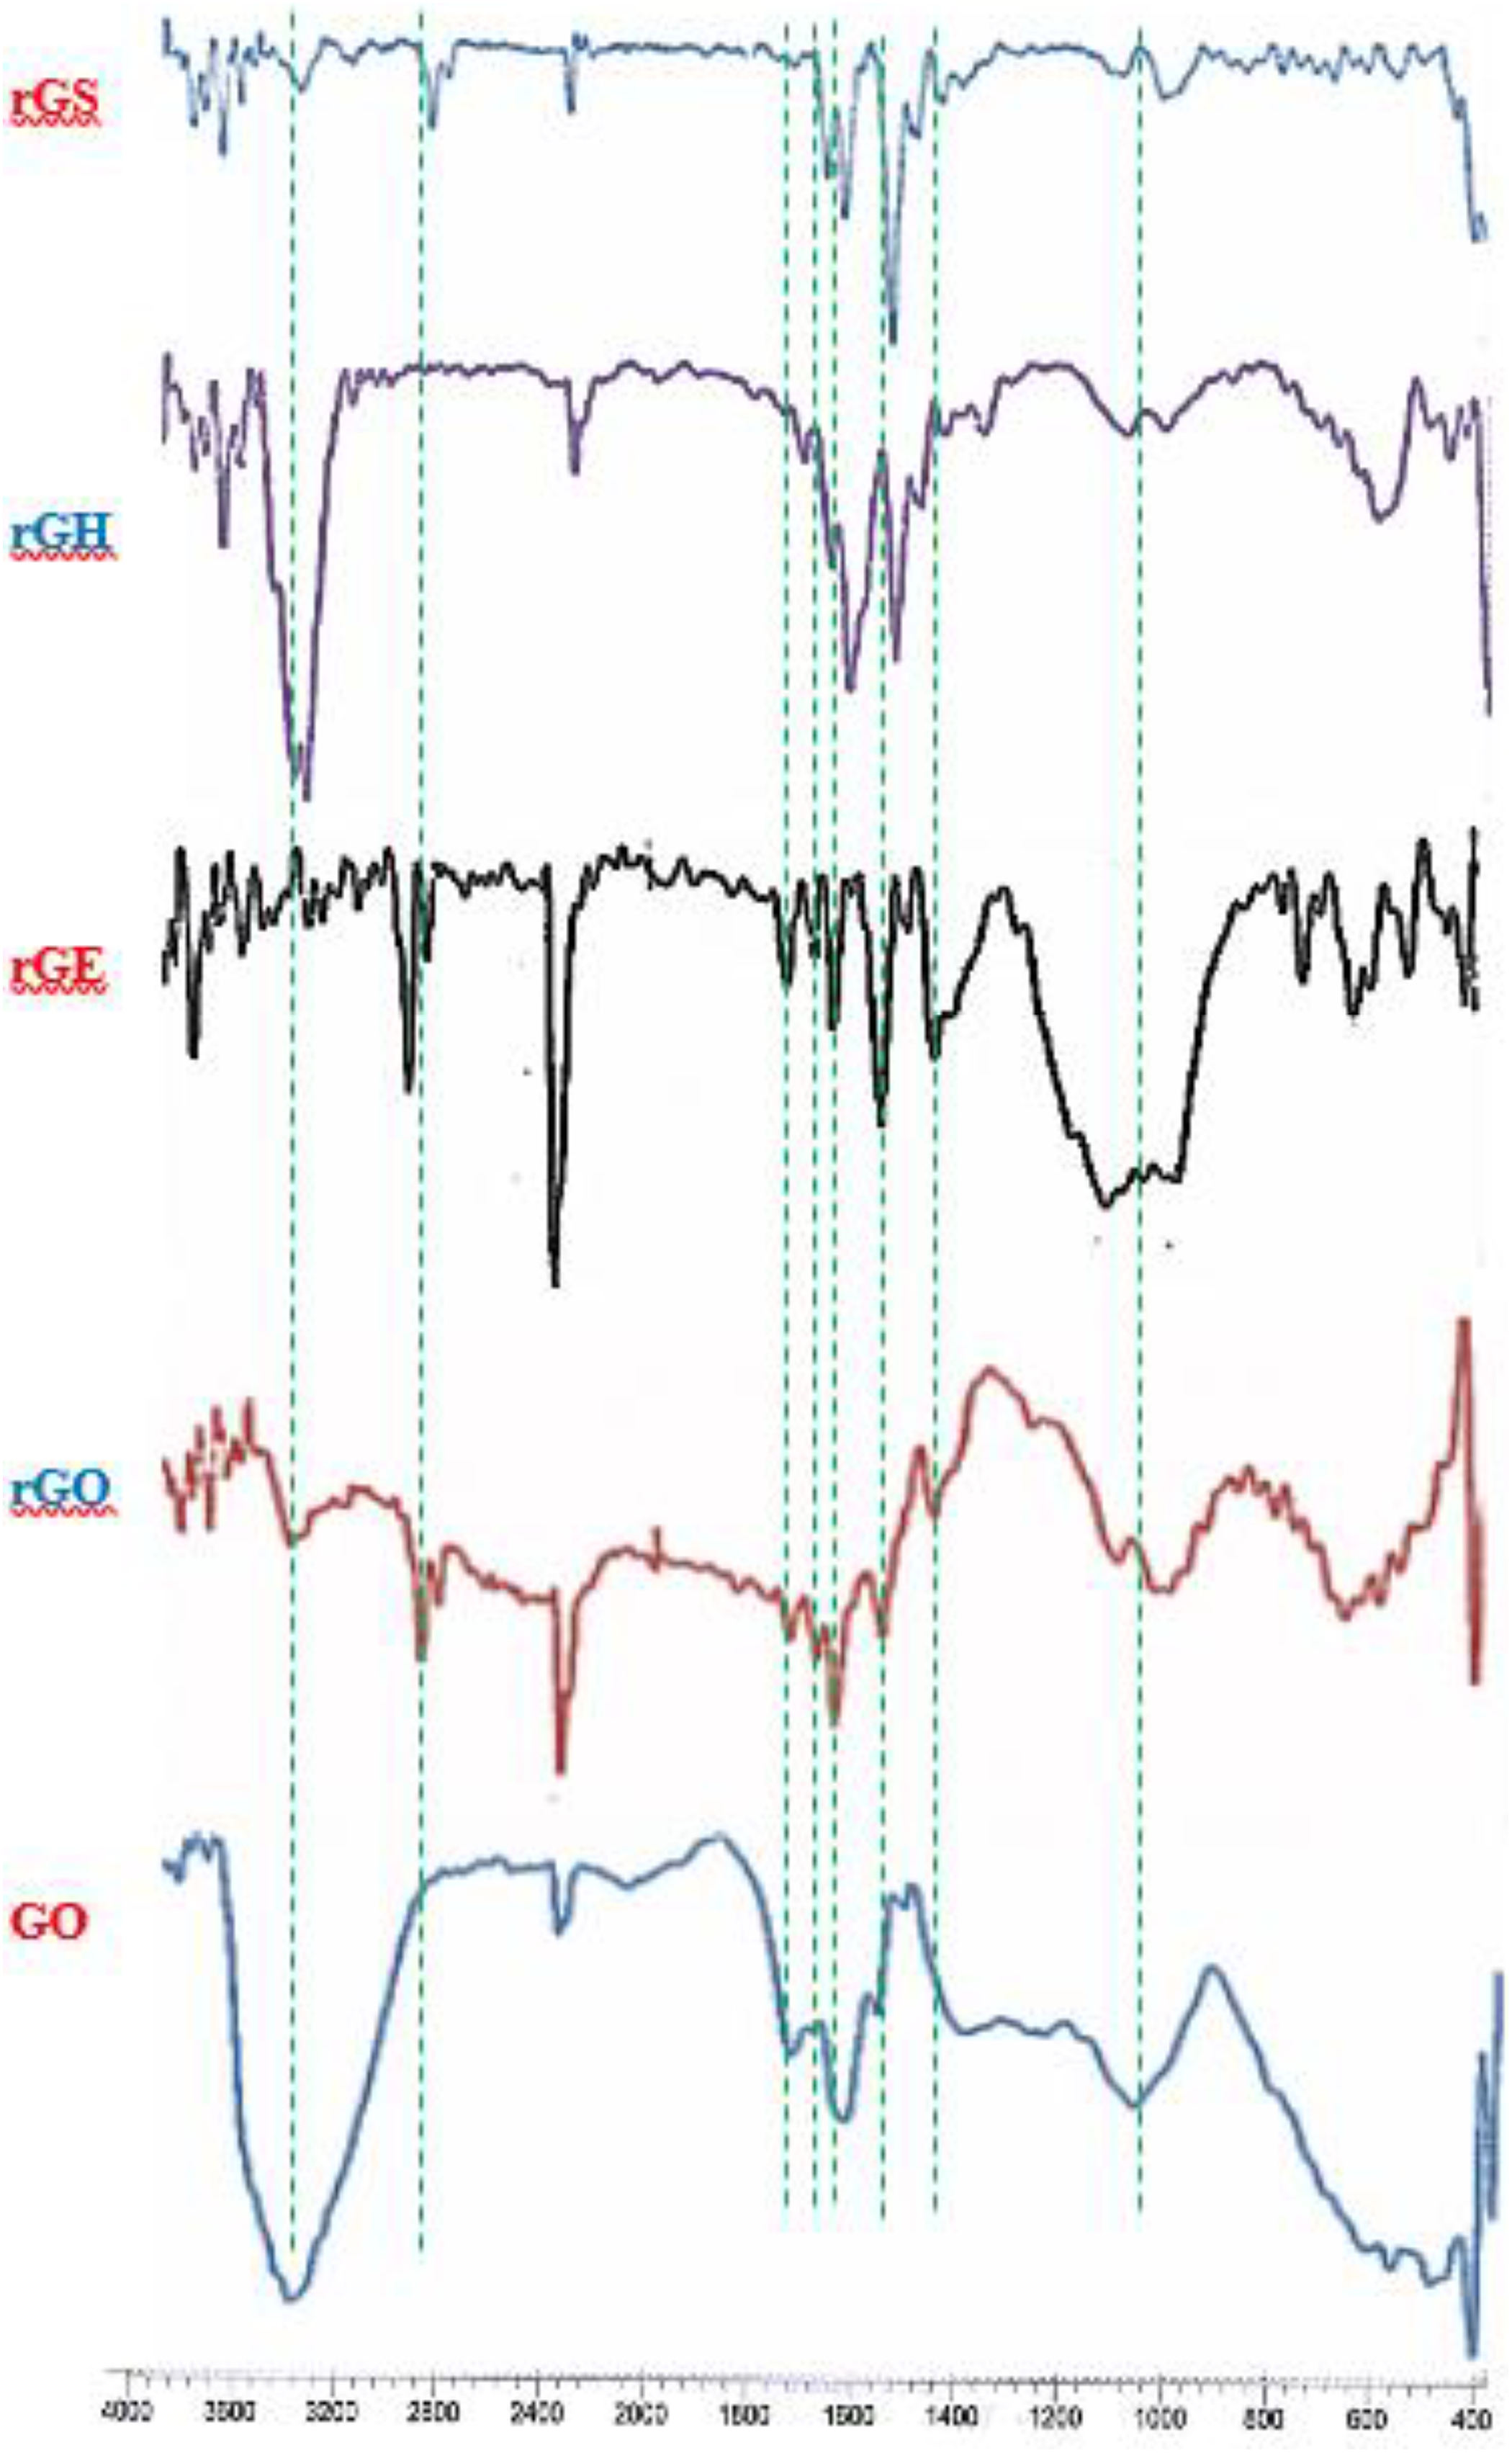
Collected FTIR spectra of GO, rGO, rGE, rGH and rGS.

FTIR spectrum of PVA.
The spectrum of rGS clearly reveals major peaks associated to its structure such as a weak band at 3440 cm−1 denoting ν(N–H) stretching vibration of secondary amine. The weak absorption band at the region 2385 cm−1 relates to ν(S–H), while the absorption peak at 1652 cm−1 belongs to ν(C=N oxadiazole) and that at 1558 cm−1 relates to ν(C=C). In addition, peaks at 1458 cm−1 and at 1027 cm−1 appear, which correspond to ν(C–N) and ν(C–O oxadiazole) stretching vibration, respectively. 25 These observations suggest that the cyclisation reaction had been successfully performed on the edges of the rGE nanosheets. However, the FTIR spectra for (GO, rGO, rGH, rGE and rGS) nanosheets, for comparison, are presented in Figure 2. The spectrum of PVA, Figure 3, indicates a typical free nonbonded stretching alcoholic hydroxyl –ν(O–H) band at 3427–3591 cm−1, and hydrogen bonded band at 3230 cm−1. One can also glimpse the ν(C–H) alkyl stretching band at 2858−2933 cm−1, 26,27 and the bending vibration of (C–H) at 1377 cm−1. However, the FTIR data of pure PVA and nanosheets are listed in Table 1.
List of data from FTIR analysis of nanosheets and PVA (peak positions are given in cm−1.)
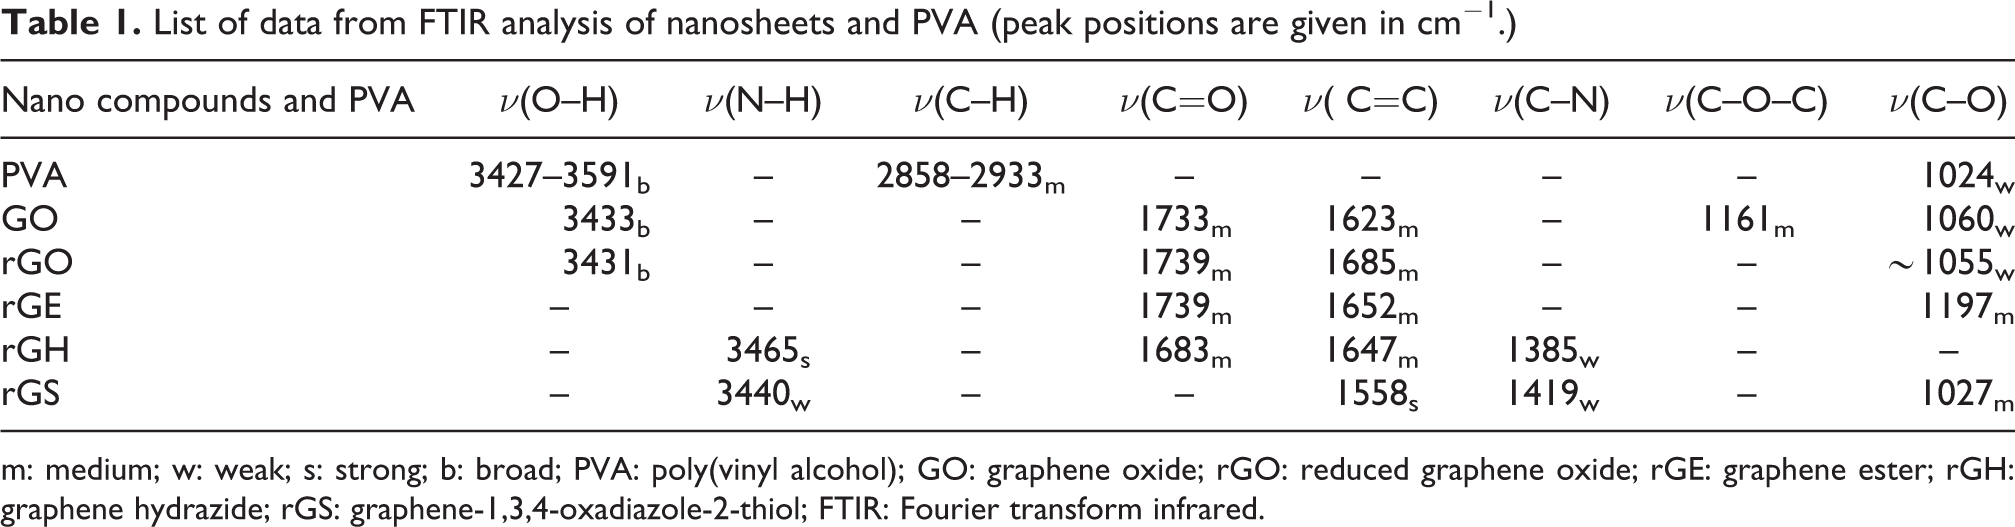
m: medium; w: weak; s: strong; b: broad; PVA: poly(vinyl alcohol); GO: graphene oxide; rGO: reduced graphene oxide; rGE: graphene ester; rGH: graphene hydrazide; rGS: graphene-1,3,4-oxadiazole-2-thiol; FTIR: Fourier transform infrared.
The XRD investigations for pristine graphite PG, GO, rGO, rGE, rGH and rGS provide the spectrum patterns, as shown in Figure 4(a). An intense peak centred at 2θ = 11.86° can be observed in the pattern of GO, which corresponds to the average interlayer spacing of 0.77 nm. At the same time, a faint basal reflection (002) at 2θ = 26.6° (d spacing = 0.34 nm) related to pristine graphite is also seen. 28 An interlayer spacing of GO, increased from 0.34 to 0.77 nm, may emerge due to the intercalation of oxygen-containing functional groups and water molecules. 29 For rGO, the peak at 2θ = 11.86° shifts to 26.19°, suggesting the removal of interlayer oxygen functional groups and formation of a multilayer stack of graphene or rG due to the π–π interaction. Similarly, the rGS exhibits a broad peak centred at 2θ = 26.19°, which is attributed to the formation of a few layer functionalised graphene. This broad peak indicates the poor ordering of the sheets along the stacking direction. Figure 4(b) shows the XRD pattern of PVA, with diffraction peaks at 2θ of 19.6 and 22.7 corresponding to the crystalline regions of the polymer. 30

XRD patterns of (a) PG, GO, rGO, rGE, rGH and rGS; (b) PVA and (c) rGS/PVA nanocomposite.
The XRD profile for rGS/PVA nanocomposite film, Figure 4(c), shows the main peaks at 2θ positions of 19.4°, 26.19° and 43.2° corresponding to (110), (002) and (100), respectively. This observation indicates the dispersion of rGS into the PVA matrix. However, the XRD pattern of the rGS/PVA nanocomposite film shows the PVA peak (19.4° (110)) and significant decrease in the intensity of rGS diffraction peaks (26.19° (002) and 43.2° (100)). Such results may demonstrate that rGS is fully exfoliated into single rGS sheets in the PVA matrix. 31,32
The SEM micrographs of the pure rGS sheets, Figure 5(a), clearly display a wrinkled surface topology and appear to be very thin. This surface may manifest from the crumpling and scrolling of rGS sheets and could provide a large active area for deposition of heavy metal ions. However, Figure 5(b) shows SEM cross section micrographs of the rGS/PVA composite after drying. The SEM images clearly indicate that the rGS are well-dispersed and partially aligned in the PVA matrix. The rGS nanosheets may settled through hydrogen bonding with the PVA polymer matrix, as visualised in the chemical structure, Figure 5(b).

The SEM images of (a) pure rGS and (b) rGS/PVA matrix.
Electrical properties
The dielectric permittivity (ε′), imaginary permittivity (ε″), conductivity (σAC) and loss factor (tan δ) of the (1 wt%, 4 wt% and 8 wt%) rGS/PVA composite films were measured as a function of frequency at room temperature and are shown in Figure 6(a) to (d). The dielectric permittivity ε′, also known as the relative dielectric constant, was the real part of the complex dielectric permittivity. The loss factor (tan δ = ε″/ε′) is commonly used as a measure for energy dissipation in any dielectric material. In addition, the frequency effect on the electrical properties was studied in the range of 5 kHz to 0.5 MHz. As expected, the rGS/PVA composites exhibited a typical dielectric properties percolation transition behaviour as the concentration of rGS increased. The dielectric permittivity of PVA matrix, without rGS, gradually decreased from 4.34 to 3.53 as the frequency increased. It can certainly be observed that the dielectric permittivity of the PVA was enhanced by blending with rGS nanosheets. Nevertheless, at low rGS concentration, the dielectric permittivity of the composites still exhibited a slow decreasing trend with increasing frequency. For instance, the dielectric permittivity of the composite (1 wt%) shows a gradual decrease from 4.84 to 4.56. While as the rGS content approached about 4 wt%, a percolation transition from an insulator to conductor occurred, which is accompanied by a dramatically increased dielectric permittivity. The dielectric loss of the rGS/PVA composites is also substantially increased by the incorporation of conductive rGS nanosheets. For the composite with an rGS content of 4 wt%, the loss factor is about an order of magnitude higher (0.3474) than that of pure PVA in the lower frequency region. The loss factor of the 8 wt% composite at 104 kHz boosts to an even higher value. Such increase in the loss factor is inevitable because of the significant enhancement in conductivity of the rGS/PVA composites and could be considered as one of the important features of the percolative composites. On the other hand, for composites incorporated with conductive fillers, the dielectric loss is mainly caused by current leakage. 33 Higher content of conductive fillers could construct more conductive paths and thus result in more significant current leakage and dielectric loss. Figure 6(d) displays the frequency dependence of AC conductivity (σ) of the rGS/PVA composites with different rGS contents. For the composites with low rGS contents (4 wt%), the conductivity curves show a strong dependence on frequency owing to their insulating nature. The AC conductivity of the composites increases with the increasing frequency. An insulator–semiconductor transition is clearly observed when the rGS loading exceeds 4 wt%. These results are in good agreement with the variation of dielectric properties of the rGS/PVA composites.

(a) Dielectric permittivity (ε′), (b) imaginary permittivity (ε″), (c) loss factor (tan δ) and (d) conductivity (σ) of the rGS/PVA composites with different concentrations of rGS as a function of frequency at room temperature.
Conclusions
rGS and PVA (rGS/PVA) polymer nanocomposites have been successfully synthesised. The incorporation of rGS into the PVA matrix was monitored by SEM, XRD and FTIR analysis. The properties of the resulting PVA composite films were sensitive to the structures of the fillers. The rGS/PVA composite films exhibited a significant improvement in electrical properties at a low loading weight percent of rGS compared to pure PVA. Therefore, the rGS compound may be an effective nanofiller, and the nanocomposites could be useful for many practical applications.
Footnotes
Declaration of conflicting interests
The author(s) declared no potential conflicts of interest with respect to the research, authorship, and/or publication of this article.
Funding
The author(s) received no financial support for the research, authorship, and/or publication of this article.