
Abstract
Hexamethylenetetramine (HA) is widely used as a raw material in the medical, chemical, industrial, and military industries, and the fast and quantitative analysis of HA is important for manufacturing processes in these fields. Owing to its efficiency, low cost, nondestructive testing, and convenience, near infrared (NIR) spectroscopy is a powerful technique for quantitatively analyzing the HA concentration in HA–acetic acid (HAc) solutions, demonstrating application potential in the production of hexogen and octogen. A series of preprocessing algorithms and variable selection methods were studied to improve the detection accuracy of the NIR spectroscopic calibration. Forty-six different combinations of standard normal variation (SNV), multiplicative signal correction, first derivative, second derivative, and discrete wavelet transform (DWT) were screened. The effects of four variable selection methods (successive projection algorithm (SPA), uninformed variable elimination, competitive adaptive reweighted sampling, and multiverse optimization (MVO)) were compared. Finally, a model (SPXY-SNV-1stDer-DWT-MVO-RF) was developed by combining sample set portioning based on the joint x–y distance (SPXY) algorithm with the random forest (RF) calibration model, and MVO was combined with the NIR technique for the first time. The model achieved a coefficient of determination for the calibration set (R2), root mean square error of the calibration set (RMSEC), coefficient of determination for the prediction set (r2), and root mean square error of the prediction set (RMSEP) of 1.000, 0.04%, 0.999, and 0.05%, respectively. This study demonstrated the novelty and feasibility of HA quantitative detection by NIR spectroscopy and provided valuable insights for optimizing quantitative analysis models by optimizing algorithms, indicating the great application potential of NIR spectroscopy in related fields.
Introduction
The quality of raw materials is closely related to product quality and yield in chemical production processes. Conventionally, chemical titration is often used for quality testing. 1 However, this method has inherent limitations because it relies on organic reagents and specialized equipment. Furthermore, the accuracy of the test results may be influenced by variations in the operator skill level. Additionally, the prolonged testing period associated with this method can lead to delayed acquisition of titration results. Consequently, potential issues in the production process may not be identified promptly. Near infrared (NIR) spectroscopy has become a crucial tool in the field of chemical analysis owing to its efficiency, speed, low cost, nondestructive testing, and convenience. NIR spectroscopy has demonstrated significant potential for the quantitative analysis of samples and has found extensive applications in various fields, such as food inspection, 2 pharmaceutical manufacturing, 3 chemical production,4,5 environmental monitoring, 6 and agricultural product processing. 7
Establishing calibration models based on chemometrics and NIR spectroscopy enables the rapid quantitative detection of raw material quality, which provides robust support for improving production efficiency, product quality, and resource utilization efficiency. Nevertheless, the susceptibility of spectroscopic data to disturbances from factors such as stray light, noise, and baseline shifts presents a considerable challenge in the development of quantitative models for NIR analysis. To improve the prediction accuracy, implementing effective data preprocessing before establishing a quantitative model is essential. Common preprocessing methods, including but not limited to standard normal variation (SNV), 8 multiplicative signal correction (MSC), 8 discrete wavelet transform (DWT), 9 first derivative (1stDer), and second derivative (2ndDer), 10 can eliminate the influence of other components in spectral signals, making the identification of spectral information easier. Different pre-processing methods have distinct features. For instance, wavelet transform is highly effective in time-frequency domain analysis, whereas baseline correction methods are better suited for addressing baseline shifts. Combining multiple preprocessing methods may help handle baseline shifts and noise that affect certain spectra. Additionally, excess variable information may result in an oversized dataset for modeling, thereby increasing the computational time. Simultaneously, irrelevant information can be introduced, compromising the overall performance of the model and hindering its ability to achieve the intended objectives. To address this problem, variable selection methods are paired with preprocessing techniques to eliminate redundant information, thereby enhancing the predictive accuracy and stability of the model. Research indicates that intelligent optimization algorithms, such as genetic algorithms (GA) and particle swarm optimization (PSO), are often employed for wavenumber variable selection because of their superior performance in global search, nonlinear optimization, and handling high-dimensional datasets or complex feature selection problems when compared to traditional methods, such as the successive projections algorithm (SPA), uninformed variable elimination (UVE), and competitive adaptive reweighted sampling (CARS).11–15 Robust global optimization capabilities, rapid convergence, and a minimal number of parameters are exhibited by the multiverse optimization (MVO) algorithm, 16 making it well suited for addressing complex problems across various domains, such as trajectory optimization, 17 parameter optimization, 18 location of the critical failure surface of a slope, 19 and optimal band selection for hyperspectral image data.20,21 However, to date, MVO coupled with NIR spectroscopy for the quantitative determination of chemical compound concentrations has not been reported.
Hexamethylenetetramine (HA) is used widely in the medical, chemical, and military industries. For instance, an acetic acid solution (HAc) of HA is an important raw material for producing energetic hexogen and octogen compounds. Quantitative analysis of the HA concentration in HA–HAc solutions may have potential applications in improving the safety and quality consistency of the manufacturing process of these energetic compounds. In this study, the effects of different preprocessing methods and variable selection techniques on the accuracy of a quantitative model for NIR spectroscopy were investigated. Based on the analysis of the NIR spectroscopic signals obtained from the HA–HAc solution, various preprocessing algorithms and combinations (considering the number and order of the combinations) were employed to establish a random forest (RF) calibration model. The modeling effectiveness of different preprocessing algorithms was analyzed. Multiple variable selection methods, such as SPA, UVE, CARS, and MVO, were applied to optimize the variables, and the coefficient of determination of the calibration set (R2), root mean square error of the calibration set (RMSEC), coefficient of determination of the prediction set (r2), and root mean square error of the prediction set (RMSEP) were used to identify the optimal variable selection method. These results offer a reliable and efficient approach for the rapid quantitative analysis of HA concentration in HA–HAc solutions, which may also support the quantification of HA by the NIR technique in the medical and chemical industries.
Experimental and method
Sample preparation and spectral acquisition
Different quantities of HA and HAc were weighed using an EX12001ZH Electronic Balance (Shanghai Ohaus Instrument Co., Ltd, China) and different concentration HA solutions were prepared. The concentration of HA in the HA–HAc solution was analyzed by chemical titration. The HA concentrations of 102 HA–HAc solutions were determined; the HA concentrations ranged from 6.87% to 13.00% and were evenly distributed, as shown in Figure 1. The industrial-grade HA had a purity exceeding 99.30%, with a water content less than 0.20%. Glacial acetic acid with a purity exceeding 99.0% was purchased from the Beijing Tongguang Fine Chemical Co., Ltd. Distribution of the hexamethylenetetramine concentration.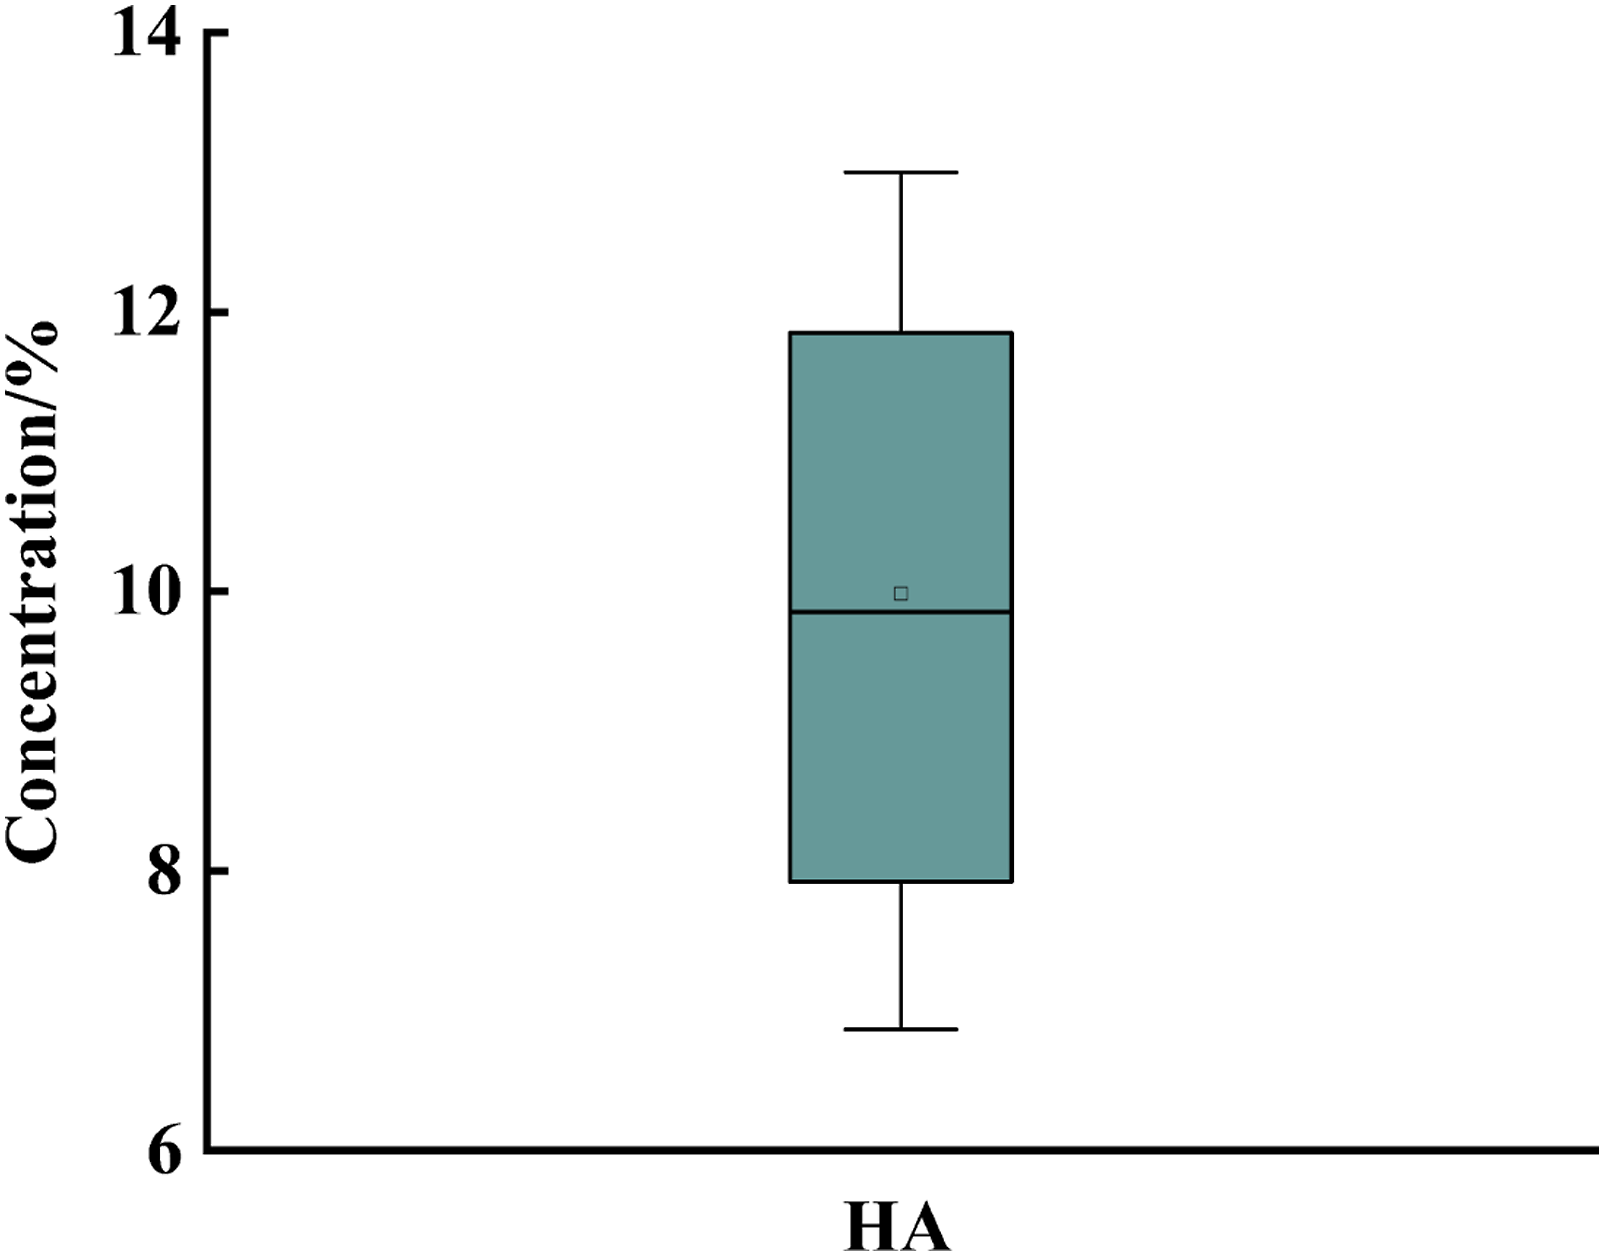
An Antaris II Fourier Transform NIR Spectrometer (ThermoFisher, Waltham, MA, USA) was used, with an empty transmission liquid sample tube (borosilicate glass KIMAX-51 glass tube) as the background, and the spectra were recorded at a room temperature of 25 ± 1°C, with a spectral range of 10,000-4000 cm−1 and a resolution of 8 cm−1. A total of 1557 wavenumbers were acquired per spectrum.
Sample set division
The dataset of 102 HA–HAc solution samples was partitioned using sample set partitioning based on joint x–y distance (SPXY) and random splitting (RS), resulting in a calibration set of 72 samples and prediction set of 30 samples. SPXY software was used to partition the sample set. The spectral data x and HA concentration y affect the modeling results; therefore, when considering the distance between samples, the same importance is given to the distance between the spectral data x and HA concentration y in the space to ensure that the sample distribution is maximally represented and the multidimensional vector space is effectively covered.22,23 The specific division formulas are as follows:

Spectral preprocessing
Figure 2 shows the NIR spectrum of the HA–HAc solution. The spectral signals reveal overlaps in the regions between 4000 and 4800 cm−1, accompanied by deformation and slight burrs. These overlaps may stem from baseline shifts, temperature variations, and background noise from other components.
24
Therefore, conducting baseline correction, noise filtering, and scattering corrections is necessary. Common techniques for eliminating continuous background shifts and enhancing the spectral resolution involve the use of 1stDer and 2ndDer.
10
The DWT can be employed to break down a signal into a set of overlapping wavelet functions, thereby facilitating the correction of background noise and simultaneous noise reduction.
9
Additionally, to remove any scattering effects on the spectra resulting from inconsistent particle distributions and diverse particle sizes, MSC or SNV should be employed.
8
An investigation to compare the advantages and disadvantages of the five preprocessing methods (no preprocessing, single preprocessing, and combined approaches) was conducted. Additionally, this study analyzed the impact of various combination sequences on modeling and aimed to identify the most effective preprocessing technique. Original NIR spectra of HA–HAc solutions.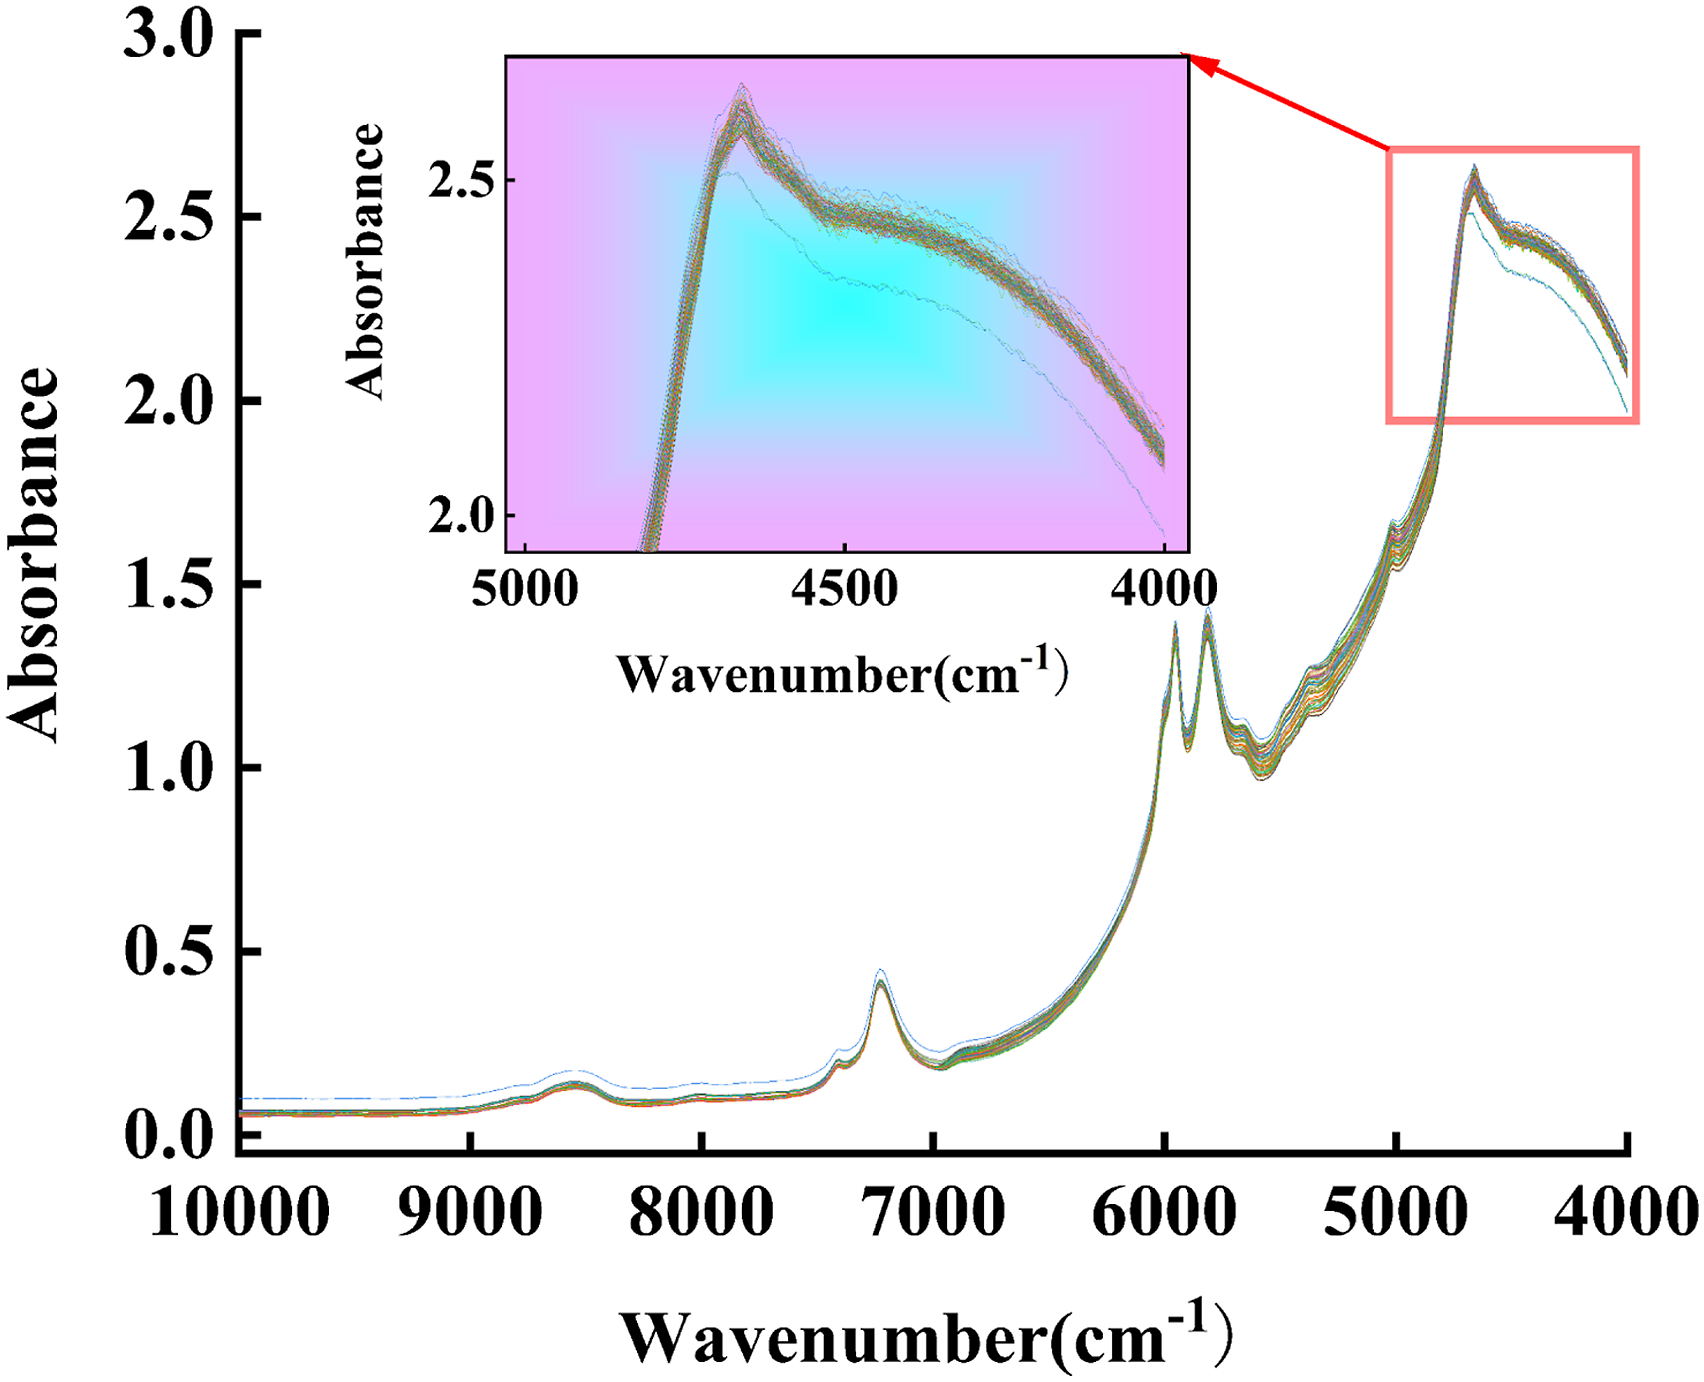
Variable selection
The MVO algorithm is an optimization algorithm that determines the universe with the best expansion rate through the interaction of white holes, black holes, and wormholes in a multi-universe. During the calculation, each universe in the multi-universe can be regarded as a candidate solution to the optimization problem, and the objects in the universe are the variables of the candidate solution. After several cycles of evolution, an optimal solution is obtained.16,25,26 Notably, MVO has been successfully applied to solve global optimization problems related to continuity. However, this continuous approach is unsuitable for variable selection problems. In general, variable selection in spectroscopy can be regarded as an optimization problem of variable combinations. Therefore, a vector composed of 1 or 0, which indicates whether the variable was selected or not, was used as the MVO input.
Herein, MVO is applied to the selection of variable information for HA–HAc solution NIR spectroscopy. The modeling of variable information after four traditional optimization algorithms, namely, the SPA, UVE, CARS algorithm, and MVO is compared to determine the best variable information selection method to improve the predictive performance of the model.
RF calibration model construction
In machine learning, the construction of RF involves an ensemble of decision trees to create a method based on the theory of statistical estimation for developing predictive models. While demonstrating outstanding performance in classification tasks, the inherent characteristics of ensemble decision trees enable them to navigate complex data relationships and alleviate the risk of model overfitting. Moreover, they exhibit commendable proficiency in handling a plethora of input variables and intricate data structures, making them particularly well suited for applications in NIR spectroscopy processing. 27 This study combined the calibration set of the NIR spectral intensities of HA–HAc solutions with the HA concentration in the solutions. A RF calibration model was constructed by aggregating the outputs of all regression trees, which were subsequently employed to predict the HA concentration in the prediction set of HA–HAc solutions. During the development of the RF calibration model, the optimization of model performance parameters, such as the number of decision trees and the number of nodes per decision tree, was achieved by utilizing five-fold cross-validation and grid search algorithms to determine the optimal parameters.
Results and discussion
Sample set division
Comparison of different modeling methods for HA evaluation.
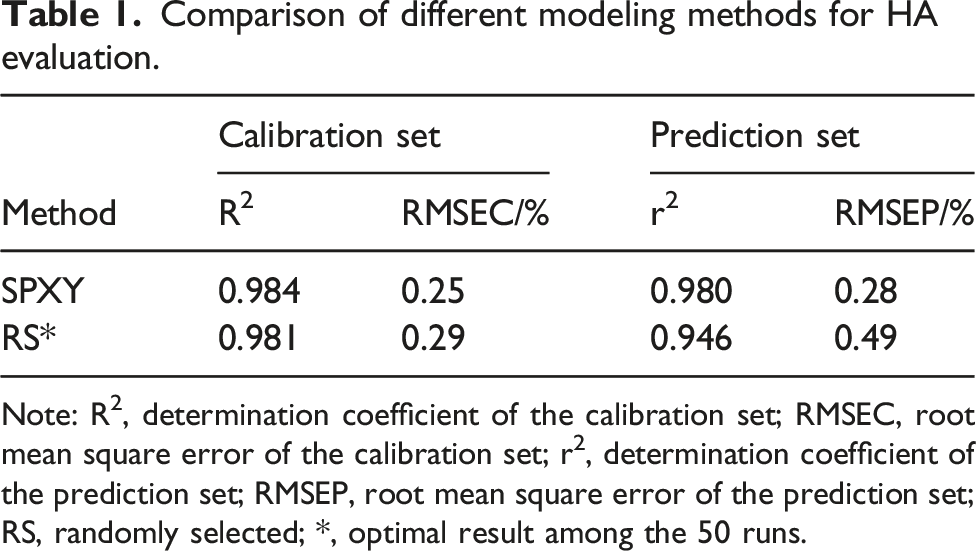
Note: R2, determination coefficient of the calibration set; RMSEC, root mean square error of the calibration set; r2, determination coefficient of the prediction set; RMSEP, root mean square error of the prediction set; RS, randomly selected; *, optimal result among the 50 runs.
This superiority stems primarily from the refined sample-partitioning strategy of the SPXY method, which assigns equal importance to both the spectral and concentration spaces, ensuring a more balanced distribution of samples between the training and testing sets. This prevents the excessive presence of any particular category of data in either the training or testing sets, thereby aiding better model generalization. 13 Furthermore, in contrast to random partitioning, which causes an uneven feature distribution that affects model learning and predictive capacity, SPXY considers data correlations. This effectively enhances the predictive performance of the model, resulting in superior performance compared to a random distribution.
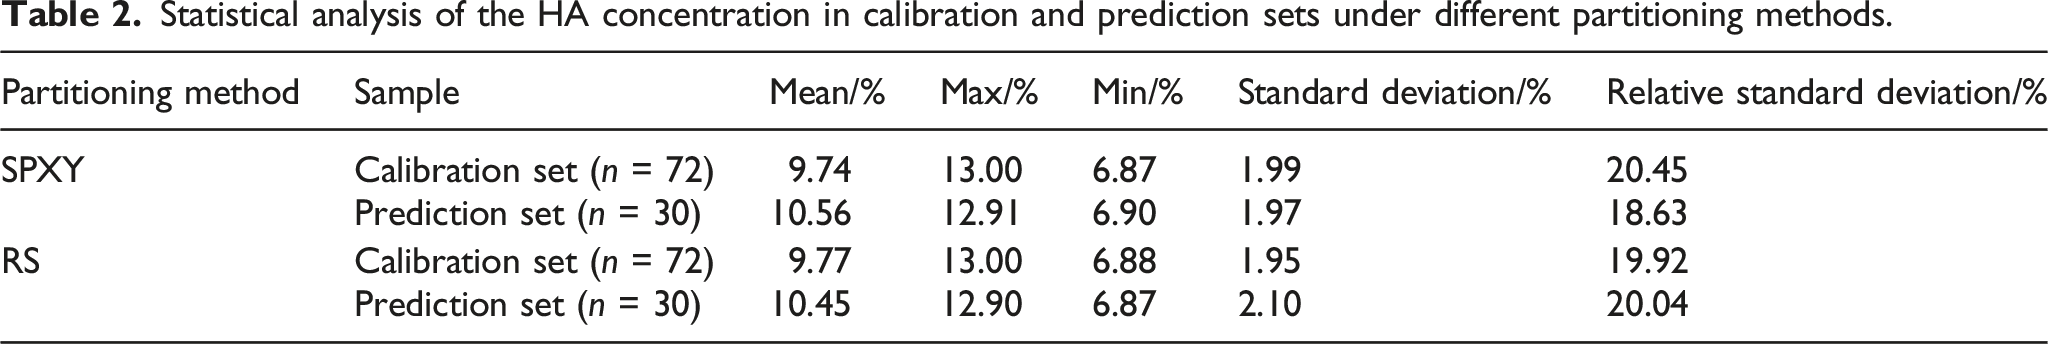
Statistical analysis of the HA concentration in calibration and prediction sets under different partitioning methods.
Comparative analysis of different preprocessing methods
Five separate preprocessing techniques, SNV, MSC, 1stDer, 2ndDer, and DWT, were individually applied to the NIR spectra of the HA–HAc solutions (Figure 3). Appropriately processed spectral data were used as input variables to construct the RF correction model. To assess the effectiveness of the model using various preprocessing methods, we compared the determination coefficients and root-mean-square errors of the model for the calibration and prediction sets. Table 3 provides a thorough analysis of the predictive performance of the RF correction model considering the optimal parameter configurations. NIR spectra of single preprocessing methods for HA–HAc solution (a): SNV; (b): MSC; (c): 1stDer; (d): 2ndDer; and (e): DWT. HA concentration predictive performance of RF calibration models for different pretreatment methods.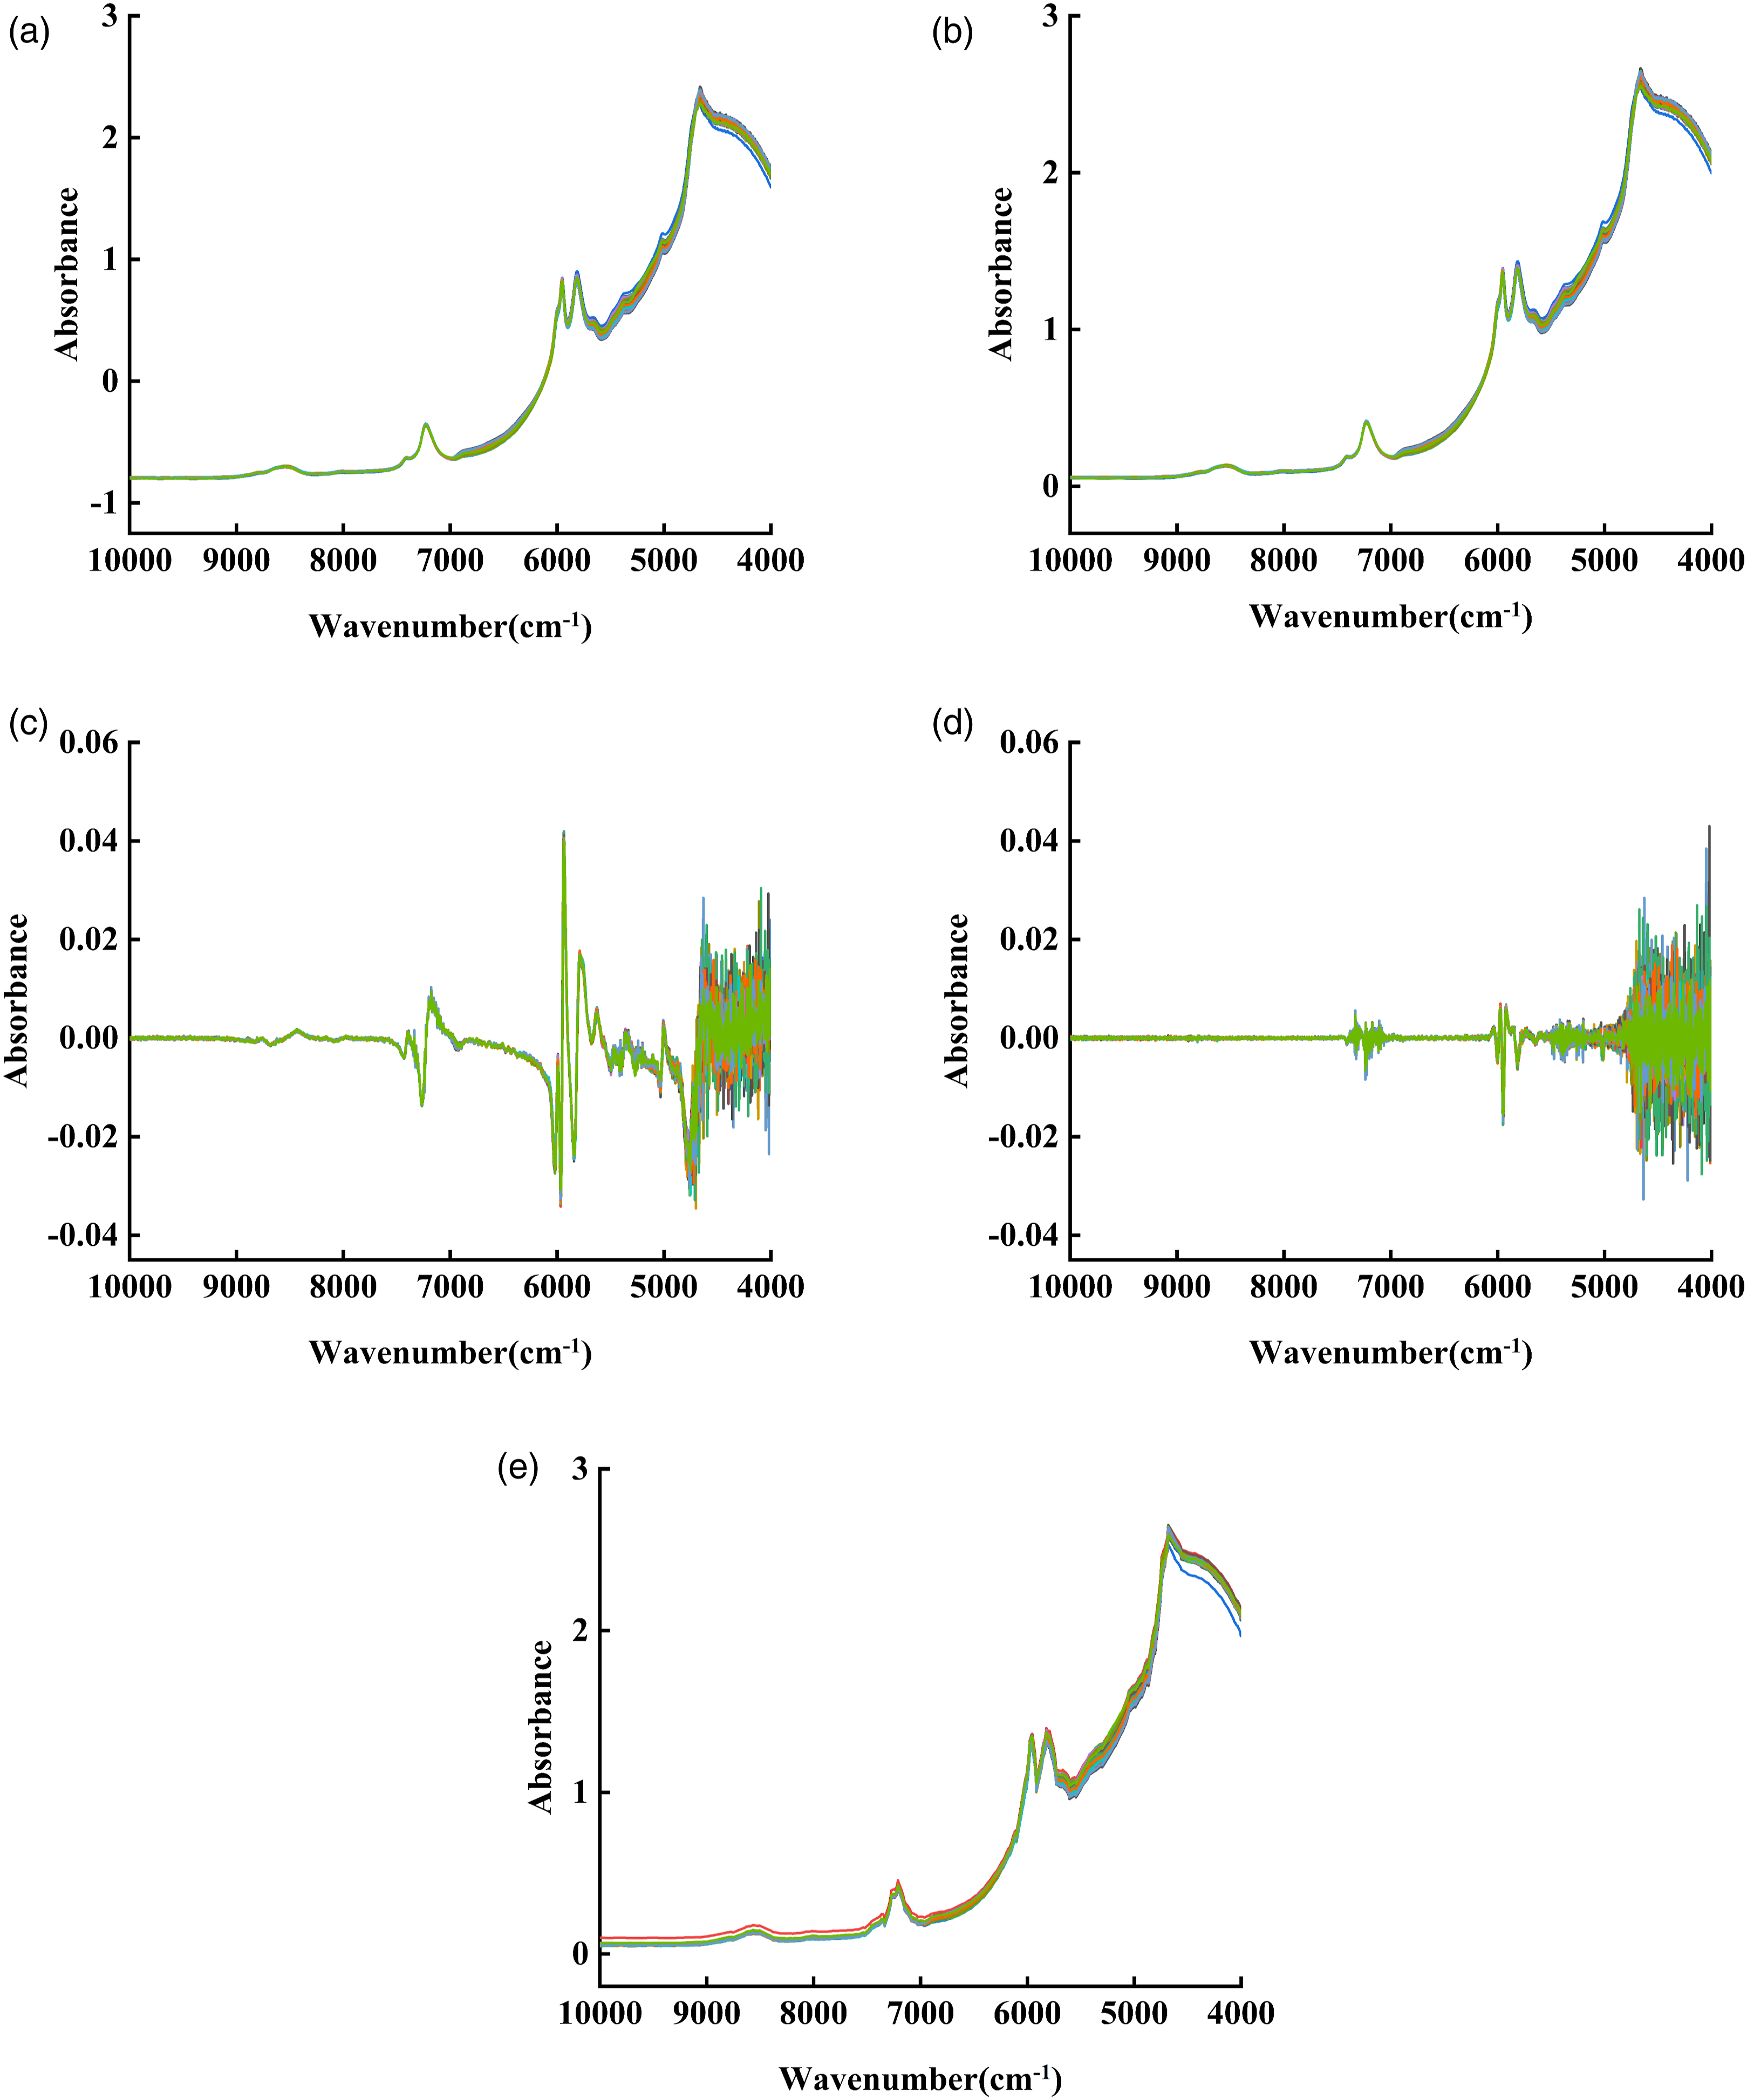
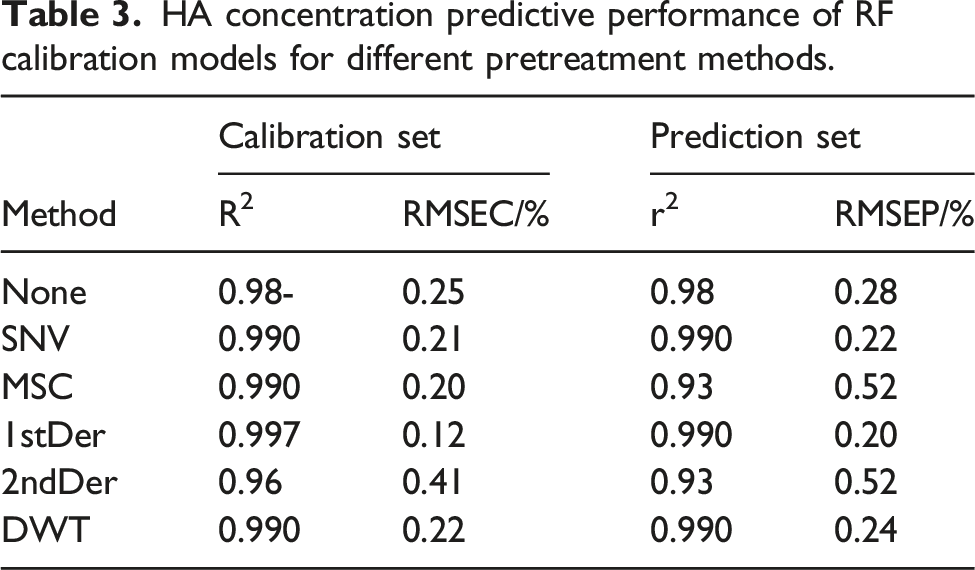
Combining the analysis of Figure 3 and Table 3 indicates that implementing the SNV and MSC treatments (refer to Figure 3(a) and (b)) greatly improves the handling of scattering effects on the spectra, thereby resulting in better spectral quality. As the MSC treatment was performed, the RMSEC value decreased in the correction set; however, the RMSEP value increased in the prediction set, implying unsatisfactory generalization performance. In contrast, the application of SNV treatment enhanced the comparison and stability of spectral data, enabling the model to apprehend a broad data framework and obtain exceptional generalization performance on novel data. Consequently, reduced RMSEC and RMSEP values were observed.
To mitigate the influence of the instrumental background or shift on the signal presented in Figure 3(c) and (d), the use of 1stDer and 2ndDer effectively curbs intervention from the baseline and background. The amplification of variations within the 4000-4800 cm−1 band becomes more prominent. This is likely because of the sensitivity of the derivative operation to local spectral variations, including noise. Increases in both the RMSEC and RMSEP values after processing with 2ndDer suggests a decline in the performance of the calibration model, possibly due to an emphasis on the spectral gradients that cause signal distortion, particularly in the region between peaks and valleys. In contrast, 1stDer offers a smoother approach that assists in extracting information from the spectra, thereby decreasing the interference of noise on the overall RMSEC and RMSEP values postprocessing.
In addition, when DWT was applied to the spectrum (Figure 3(e)), a substantial overlap with the original spectrum was observed. This indicates that the DWT technique effectively preserves spike information from the original spectrum while eliminating incidental background noise. The reduction in the RMSEC and RMSEP values achieved through the application of the DWT algorithm highlights the efficacy of wavelet transformation in enhancing the spectral clarity and effectively removing unwanted noise components while retaining vital information.29,30 This ultimately leads to improved model performance.
These results highlight the variations in the effectiveness of the different preprocessing methods owing to their unique strengths. Different preprocessing algorithms may be used in specific scenarios; therefore, employing various combinations of these methods allows us to overcome the limitations of individual techniques, harness their advantages, and facilitate better handling of noise, interference, and other data challenges. Consequently, employing various combinations of these methods may enhance the robustness of the model, enable it to adapt to diverse data variations and anomalies, and thus improve the overall preprocessing effectiveness.
Labelling of various combinations of preprocessing algorithms.
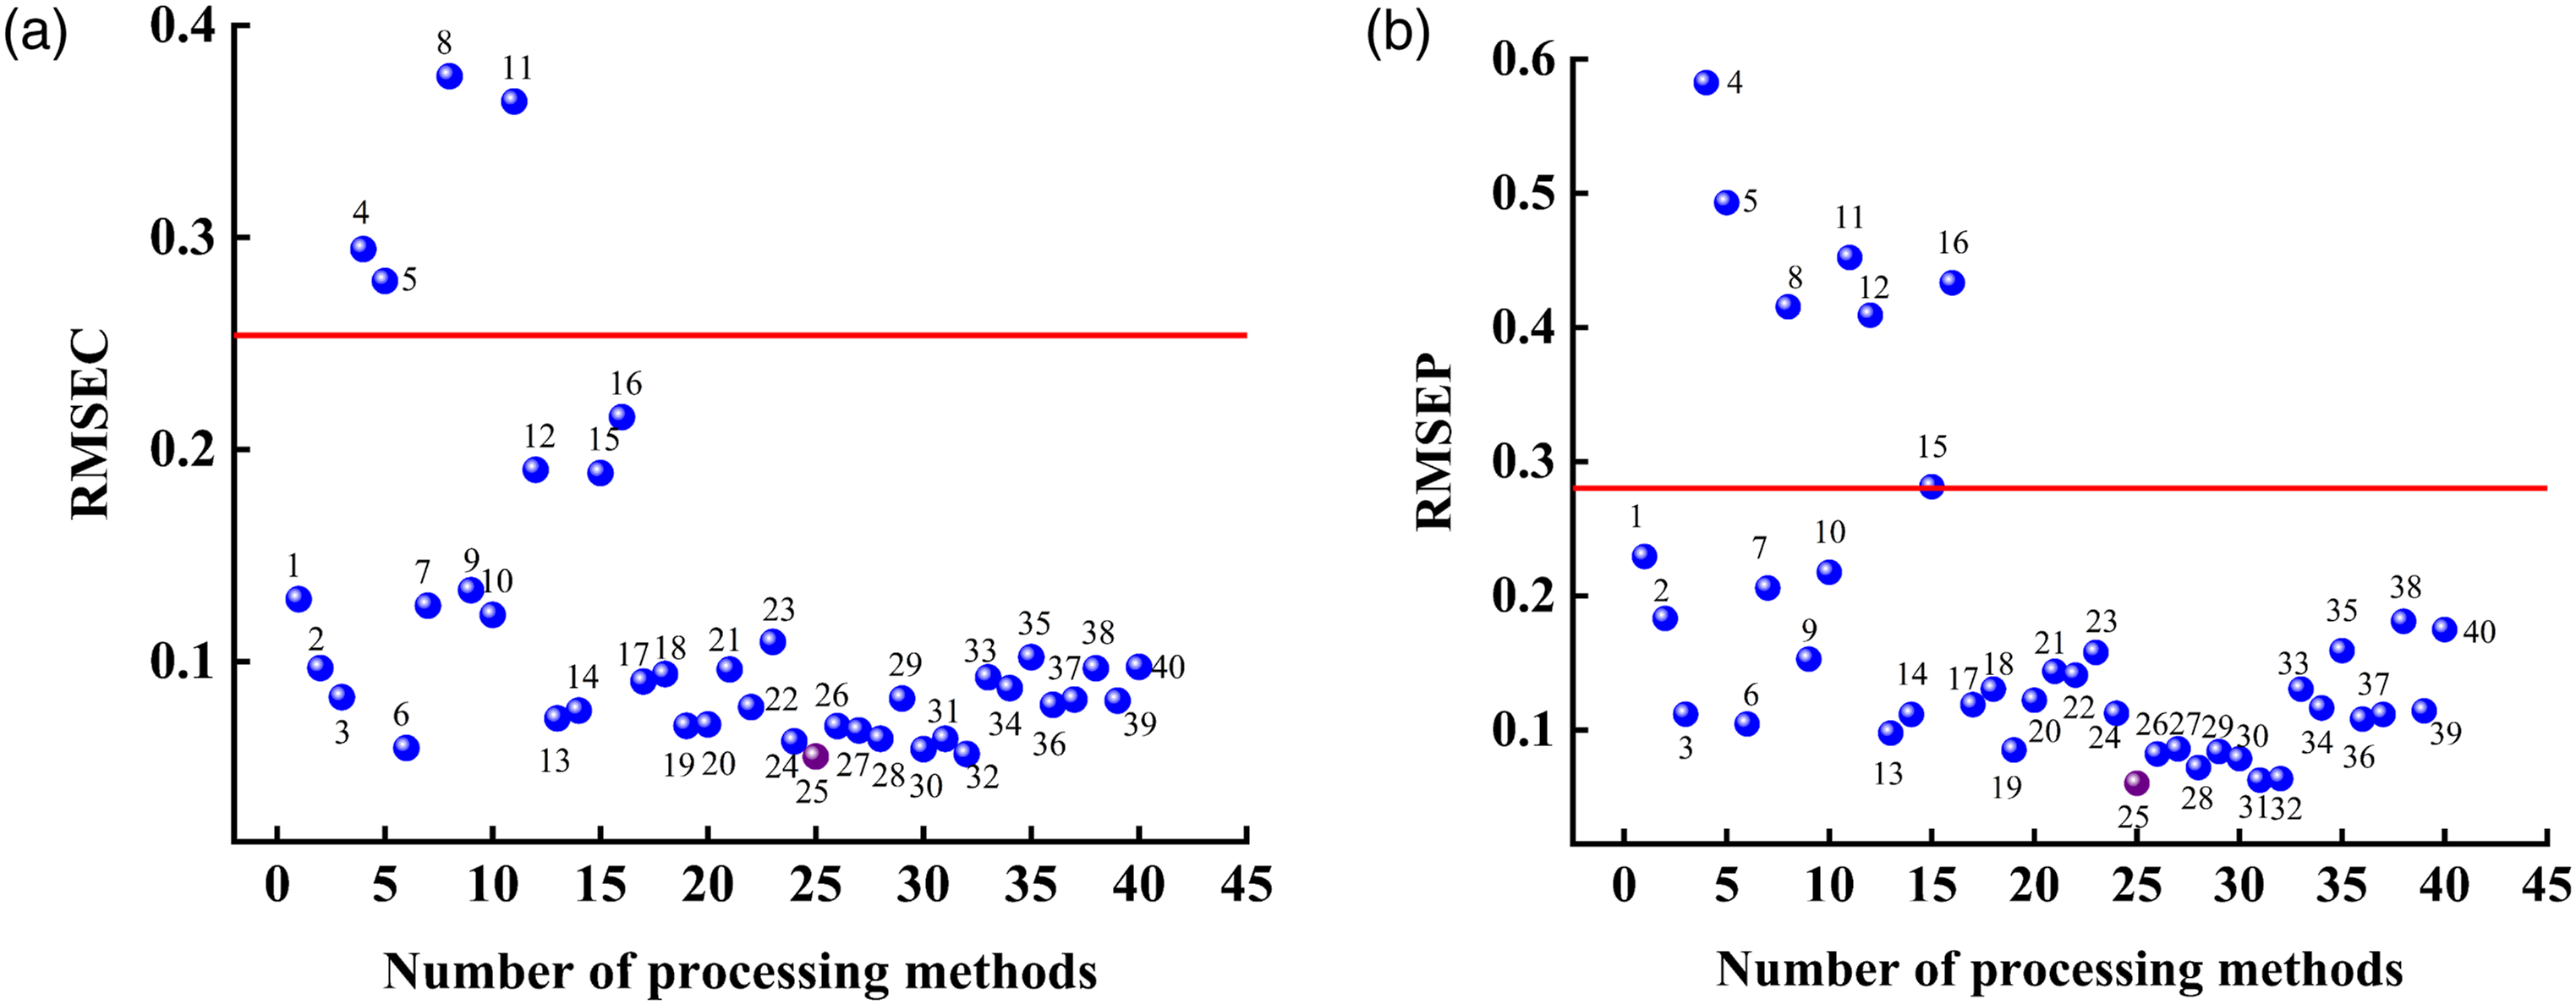
RMSEC values (a) and RMSEP values (b) of RF (red line) and the combination of 40 preprocessing methods with RF (blue balls).
Figure 4 shows that preprocessing combination 25 (SNV+1stDer + DWT) was the most effective, resulting in reductions of 78.2% and 78.5% in the RMSEC and RMSEP values, respectively. Algorithmic overlay processing improves the quality of spectral data and enhances the predictive performance of the model. Nonetheless, preprocessing combinations 4, 5, 8, and 11 showed inferior effects, as indicated by their elevated RMSEC and RMSEP values. The increase in RMSEP values for the preprocessing combinations 12, 15, and 16 indicates inadequate generalization performance of the model, whereas all other preprocessing combinations outperformed no preprocessing. There are three potential reasons for this phenomenon: (1) algorithmic errors in the preprocessing techniques could inadvertently remove useful signals in addition to the intended noise, resulting in their obscurity or elimination and ultimately harming the predictive performance of the model 31 ; (2) the sequence of data transformation steps may have been altered, leading to a negative impact on the ability of the model to generalize; and (3) the generalization performance of the model is affected by data characteristics such as baseline shift, scattering, and noise effects present in the HA–HAc NIR spectral signals. Therefore, baseline correction, noise filtering, and scattering correction can optimize the results. Analyzing the experimental results described above and utilizing spectral signal characteristics to determine suitable preprocessing algorithms before testing various combinations can enhance the efficiency and scientific validity of the preprocessing prior to modeling. For the HA–HAc NIR spectra preprocessed with SNV+1stDer + DWT, the values for R2 and RMSEC were 0.999 and 0.06%, respectively. Meanwhile, the values for r2 and RMSEP were 0.999 and 0.06%, respectively.
Selection of input variables for the SNV-1stDer-DWT-RF correction model for NIR spectra of HA–HAc solutions
When using HA–HAc solution NIR spectroscopy combined with the SNV-1stDer-DWT-RF algorithm for quantitative analysis, the large number of selected variables easily leads to too many modeling quantities, thus increasing the modeling time, and the redundant information contained will reduce the accuracy of the model analysis. If too few variables are used, although the modeling time is reduced, important variable information can be missed, which makes the effective spectral information unable to be fully applied to modeling and also reduces the accuracy of quantitative model analysis. Therefore, the screening of input variables is an essential step in modeling. The input variables preprocessed by SNV-1stDer-DWT were screened using the SPA, UVE, CARS, and MVO algorithms to build a RF correction model. Considering the stochastic nature of the CARS and MVO algorithms, the process was repeated 50 times to select the optimal wavenumber bands and better evaluate the variable selection methods. The optimal variable selection method was determined by comparing the predictive performance of the models. The variables selected by the four optimization algorithms are shown in Figure 5. Band comparison preferred by different variable selection methods.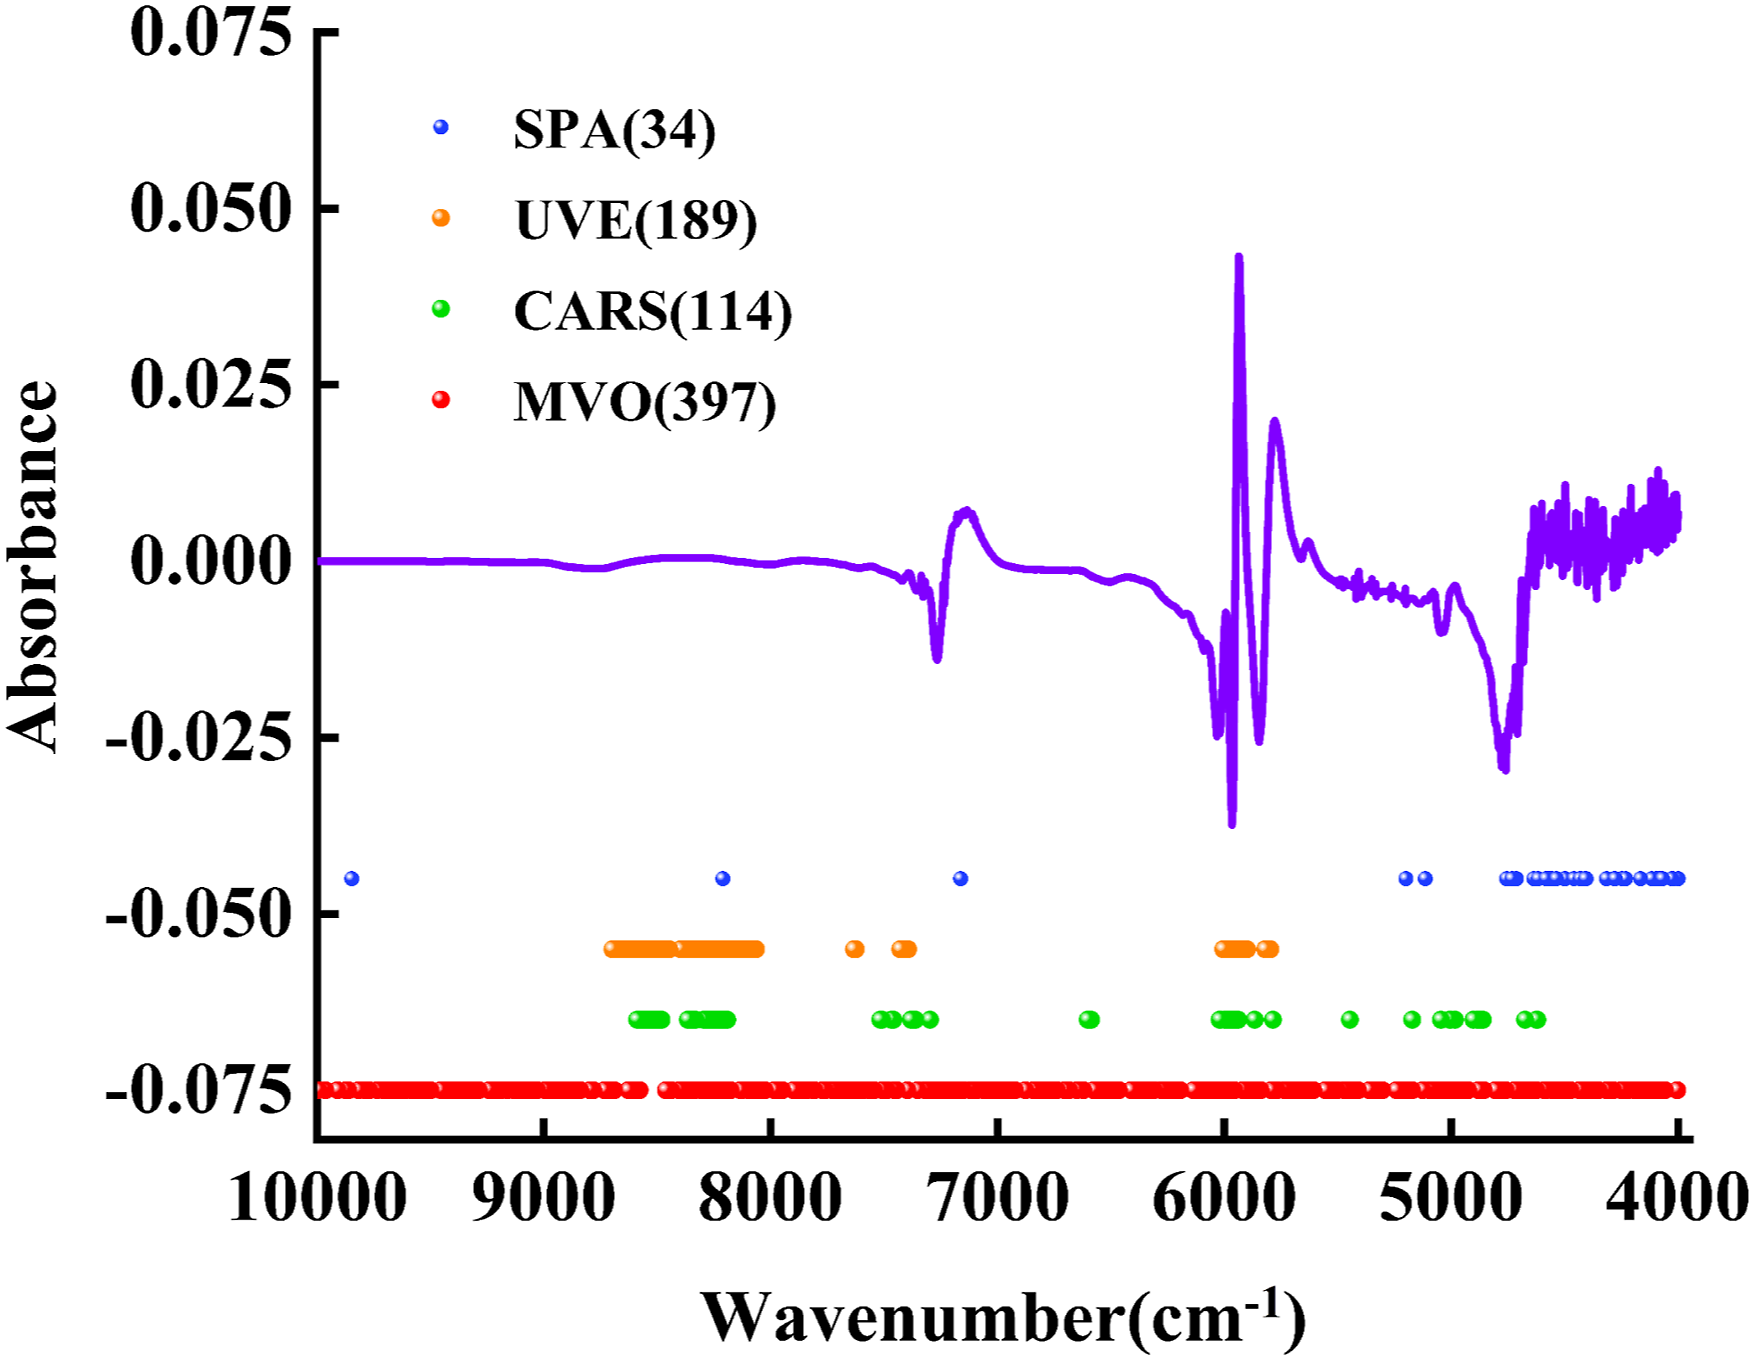
The SPA algorithm has the lowest number of selected variables (only 34), and these variables are mainly concentrated in the wavenumber range of 4000–4800 cm−1. Unlike the SPA algorithm, the UVE algorithm did not select any variables in the wavenumber range of 4000–4800 cm−1 but selected a large number of variables in the ranges of 5700–6000 cm−1 and 8000–8600 cm−1. In contrast, the CARS algorithm showed a balanced trend in variable selection, with variables selected in several band ranges. The MVO algorithm selected the most variables, which was only 25.50% of the initial variables. This difference may reflect the different strategies and tradeoff considerations used by the different algorithms in the variable selection process.
Comparison of different algorithms after variable optimization.
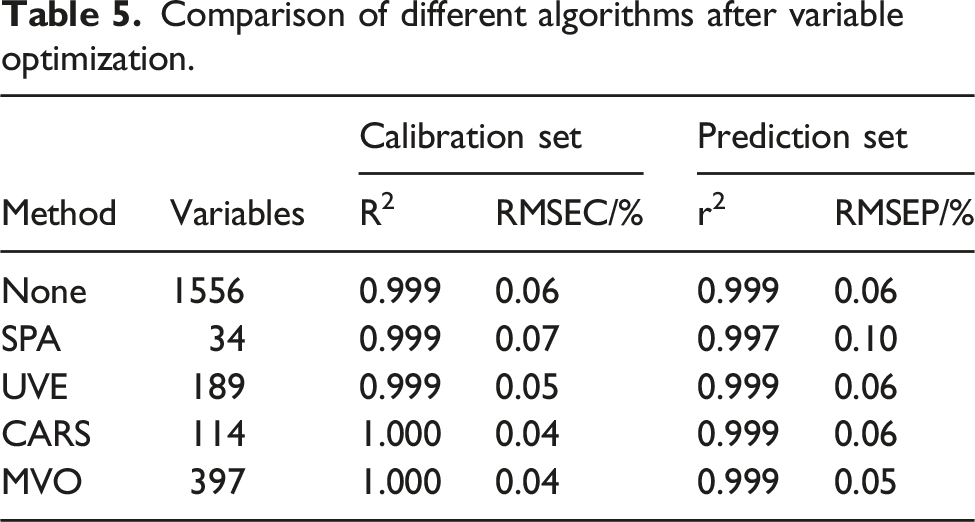
Certainly, in terms of the variable count, the SPA algorithm selected the least number of variables, indicating that the quantitative model constructed using SPA-selected variables was less complex. However, the MVO algorithm selected more variables, suggesting that the calibration model constructed using the MVO-selected variables was more complex and encompassed more spectral information. However, evaluating the model solely based on the variable count is insufficient, and the variable count must be combined with the generalization performance of the model and ability of the selected variables to effectively explain the target variables. The characteristic peaks of the NIR spectra of HA were at 4081-4367 cm−1, 7067-7168 cm−1, 8264 cm−1, and 9497 cm-1, 33 and the variables selected by the SPA, UVE, and CARS algorithms did not fully cover these characteristic peaks, indicating the difficulty of these three algorithms in fully capturing the characteristics of HA. In contrast, the MVO algorithm selected variables that captured the characteristic peaks, and the better modeling performance was indicated by the smallest RMSEC and RMSEP values. Notably, both the UVE and CARS algorithms selected fewer variables but achieved approximately predictive results. This can be attributed to a simplified strategy during variable selection, sacrificing some information to enhance computational speed, thereby catering to practical applications that require a balance between real-time capability and accuracy. However, this study placed a stronger emphasis on determining an accurate HA concentration in the HA–HAc solution. In the pursuit of high precision, we prefer to retain more information, even if it involves sacrificing computational speed. Nevertheless, the computational speed sacrifice is not as significant as imagined; the prediction times for UVE, CARS, and MVO are 0.41 s, 0.36 s, and 0.58 s, respectively, with a modest sacrifice of only 0.22 s, which is well within an acceptable range. Therefore, the MVO algorithm can be considered the best variable selection method.
Conclusion
By screening a series of combinations of different preprocessing methods for NIR spectroscopy, the combined approach of SNV+1stDer + DWT effectively addressed the baseline shift, scattering, and noise in the spectral signals and notably enhanced the performance of the RF correction model. Additionally, the MVO algorithm was introduced to optimize the quantitative NIR spectral model for the first time and improve the predictive performance of the quantitative analysis of HA–HAc solutions. Although the above research still falls within the realm of offline detection and cannot satisfy the requirement of real-time monitoring or online process control, NIR spectroscopic analysis may replace manual titration and provide a convenient and fast quantitative detection method for HA–HAc solutions This method may not only provide robust technical support for improving the safety and quality consistency of hexane and octogen production but also be significant for extending the application of NIR technology for quantitatively detecting HA in the medical and chemical industries.
Footnotes
Author’s note
All authors made substantial contributions to the conception or design of the work or the acquisition, analysis, or interpretation of data for the work. We have drafted the work or revised it critically for important intellectual content, approved the final version to be published, and agreed to be accountable for all aspects of the work in ensuring that questions related to the accuracy or integrity of any part of the work are appropriately investigated and resolved. All persons who made substantial contributions to the work reported in the manuscript, including those who provided editing and writing assistance but were not authors, are named in the Acknowledgments section of the manuscript.
Acknowledgements
Declaration of conflicting interests
The author(s) declared no potential conflicts of interest with respect to the research, authorship, and/or publication of this article.
Funding
The author(s) received no financial support for the research, authorship, and/or publication of this article.
Data Availability Statement
The data that support the findings of this study are available from the corresponding author upon reasonable request.